Science Arts & Métiers (SAM)
is an open access repository that collects the work of Arts et Métiers Institute of
Technology researchers and makes it freely available over the web where possible.
This is an author-deposited version published in: https://sam.ensam.eu
Handle ID: .http://hdl.handle.net/10985/15098
To cite this version :
Nicolas AUBIN, Benoît AUGIER, Patrick BOT, Frédéric HAUVILLE, Matthieu SACHER, Richard FLAY - Wind tunnel investigation of dynamic trimming on upwind sail aerodynamics - In: The 22th CHESAPEAKE SAILING YACHT SYMPOSIUM, Etats-Unis, 2016-04 - The 22th CHESAPEAKE SAILING YACHT SYMPOSIUM - 2016
Any correspondence concerning this service should be sent to the repository Administrator : [email protected]
THE 22nd CHESAPEAKE SAILING YACHT SYMPOSIUM
ANNAPOLIS, MARYLAND, MARCH 2016
Wind tunnel investigation of dynamic trimming on upwind sail aerodynamics
Aubin N., Naval academy research Institut - IRENAV, France
1Augier B., Naval academy research Institut - IRENAV, France
Bot P., Naval academy research Institut - IRENAV, France
Hauville F., Naval academy research Institut - IRENAV, France
Sacher M., Naval academy research Institut - IRENAV, France
Flay R. G. J., Yacht Research Unit, Department of Mechanical Engineering, The University of
Auck-land, New Zealand
ABSTRACT
An experiment was performed in the Yacht Research Unit’s Twisted Flow Wind Tunnel (University of Auckland) to test the effect of dynamic trimming on three IMOCA 60 inspired mainsail models in an upwind (AW A = 60◦) unheeled con-figuration. This study presents dynamic fluid structure in-teraction results in well controlled conditions (wind, sheet length) with a dynamic trimming system. Trimming oscil-lations are done around an optimum value of CFobj previ-ously found with a steady trim. Different oscillation ampli-tudes and frequencies of trimming are investigated. Mea-surements are done with a 6 component force balance and a load sensor giving access to the unsteady mainsail sheet load. The driving CFxand optimization target CFobj coef-ficient first decrease at low reduced frequency frfor quasi-steady state then increase, becoming higher than the quasi-steady state situation. The driving force CFx and the optimiza-tion target coefficient CFobj show an optimum for the three different design sail shapes located at fr= 0.255. This op-timum is linked to the power transmitted to the rig and sail system by the trimming device. The effect of the camber of the design shape is also investigated. The flat mainsail design benefits more than the other mainsail designs from the dynamic trimming compared to their respective steady situtation. This study presents dynamic results that cannot be accurately predicted with a steady approach. These re-sults are therefore valuable for future FSI numerical tools validations in unsteady conditions.
NOTATION
FSI Fluid-structure interaction
VSPARS Visual Sail Position And Rig Shape YRU Yacht Research Unit
A Dynamic trimming amplitude (mm) AW S Apparent wind speed (m s−1) AW A Apparent wind angle (◦) c Reference chord (m)
CFi Force coefficient in the i axis direction (-) CFobj Optimization target coefficient (-) CFsheet Force coefficient in the mainsail sheet (-) f Input frequency (Hz)
fr Reduced frequency (-) Fi Force in i axis direction (N) Fsheet Force in the main sail sheet (N) h Mainsail luff length (m) Lcar Car traveller line length (mm) Lsheet Mainsail sheet length (mm)
M Smax Mainsail with maximum camber for the design shape M Sstd Mainsail with standard camber for the design shape M Sf lat Mainsail with zero camber for the design shape P Mechanical power from the sheet (mW) q Dynamic pressure (Pa)
S Sail mould area (m2) T Time period of oscillation (s) Uref Reference wind velocity (m s−1) ρ Density of air (kg m−3)
INTRODUCTION
A challenging task in yacht design modeling and simula-tion is the analysis of dynamic effects in the Fluid Structure Interaction (FSI) of the yacht sails and rig. The dynamic be-havior can be caused by the sea state or the wind, but can
also be caused by the action of the crew while trimming. Literature has pointed out the difficulty of considering the realistic sailing environment of a yacht (Charvet et al., 1996, Marchaj, 1996, Garrett, 1996). Recent studies have under-lined the importance of considering the dynamic behavior: forced pitching motion in the wind tunnel (Fossati and Mug-giasca, 2012), 2D simplified pitching (Gerhardt et al., 2011), interaction of yacht sails in unsteady conditions (Gerhardt, 2010), full scale experiments and simulations (Augier et al., 2012, 2013, 2014), and downwind sails (Collie and Gerrit-sen, 2006, Deparday et al., 2014). Downwind sail design is where the gain from a dynamic aero-elastic analysis seems to be potentially the greatest due to the large motion and the induced large load variation. The main findings of these different studies are the same, i.e. the aerodynamics can be predicted more accurately with an unsteady approach.
To account for this dynamic behavior, several Dynamic Velocity Prediction Programs (DVPPs) have been devel-oped (Masuyama et al., 1993, Masuyama and Fukasawa, 1997, Richardt et al., 2005, Keuning et al., 2005) which need models of dynamic aerodynamic and hydrodynamic forces. While the dynamic effects on hydrodynamic forces have been studied extensively, the unsteady aerodynamic behavior of sails has received much less attention. (Schoop and Bessert, 2001) first developed an unsteady aeroelastic model in potential flow dedicated to flexible membranes but neglected the inertia. In a quasi-static approach, a first step is to add the velocity induced by the yacht’s motion to the steady apparent wind to build an instantaneous appar-ent wind (Richardt et al., 2005, Keuning et al., 2005) and to consider the aerodynamic forces corresponding to this in-stantaneous apparent wind using force models obtained in the steady state.
Recently, advanced computational resources have en-hanced numerical simulations and have allowed coupling of fluid and structural solvers dedicated to yacht sails (Ren-zsh and Graf, 2010, Chapin and Heppel, 2010, Trimarchi et al., 2013, Ranzenbach et al., 2013). In past years, IRE-Nav and the K-Epsilon company have developed numerical tools dedicated to the simulation of the dynamic behavior of yacht sails. The FSI potential model ARAVANTI has been validated by full scale measurements (Augier et al., 2012) and enables numerical studies of a yacht pitching in a head swell (Augier et al., 2013, 2014), showing a clear break with the quasi-static approach. The recent RANS FSI coupling ARA-FINETM/Marine (Durand et al., 2014) is required to simulate cases with strong separation for downwind simula-tions, but it is very time and CPU consuming.
Even though some advanced models are now available for sail aerodynamics, there is a real need for detailed validation of numerical simulations in order to provide reliable design tools for the sailing industry. Controlled experiments are also a great opportunity to understand the physics of FSI of yacht sails. Unfortunately, realistic and reliable experimen-tal data is scarce and the validation of models in real condi-tions is difficult (Augier et al., 2012, Fossati et al., 2015). In
this context, wind tunnel testing and full-scale testing are re-quired for comparison and validation (Flay, 1996, Renzsch and Graf, 2013, Le Pelley et al., 2002). Wind tunnel test-ing has the advantage of betest-ing in a controlled environment where a balance can be used to measure the forces created by the sails on the boat frame (Viola and Flay, 2010, Fos-sati, 2010, Fossati and Muggiasca, 2009, 2010, Wright et al., 2010). Pressure and flying shape measurements can also be performed in wind tunnels (Lasher and Richards, 2007, Graf and M¨uller, 2009, Viola and Flay, 2011, Viola et al., 2013). In a recent study, (Gerhardt et al., 2011) developed an an-alytical model to predict the unsteady aerodynamics of in-teracting yacht sails in 2D potential flow, and performed 2D wind tunnel oscillation tests with a motion range typical of a 82-foot (25m) racing yacht (1992 International America’s Cup Class). Recently (Fossati and Muggiasca, 2012, 2009, 2010, 2011) studied the aerodynamics of model-scale rigid sails in a wind tunnel, and showed that pitching motion has a strong and non-trivial effect on aerodynamic forces.
A dedicated experiment has been developed in the Yacht Research Unit Twisted Flow Wind Tunnel, University of Auckland, to study the aerodynamics of dynamic trimming. The model was simplified to a simple model-sized IMOCA 60 mainsail and a mast with no shrouds. We measured the effect of dynamic trimming on the forces (Fx, Fy) with the balance and the load in the sheet (Fsheet) for a given incom-ing wind (Uref = 3.5 m s−1at 1.5 m height at model-scale location in an empty wind tunnel configuration) for 3 differ-ent sail design shapes.
In the first part of the paper, we describe the experimental set up and we define the optimum trimming. In the second part, the results are presented for different trimming oscilla-tion amplitudes and frequencies and for different sail design shapes. Finally the influence of these different parameters on the global performance of the rig is discussed.
EXPERIMENTAL SETUP
Experiments were performed thanks to the Sailing Fluids collaboration program in the Twisted Flow Wind Tunnel of the Yacht Research Unit of the University of Auckland de-scribed in (Flay, 1996).
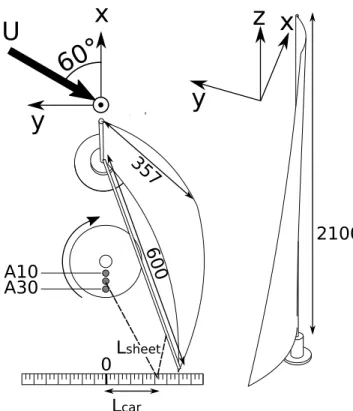
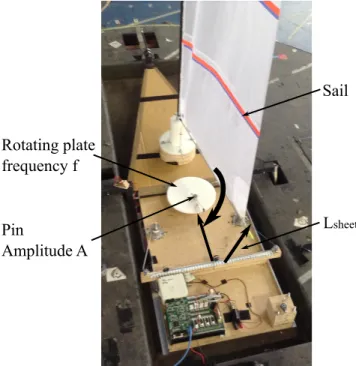
An 1/13th scale IMOCA 60 foot design mainsail was designed and built by INCIDENCE SAILS, using SAIL-PACK software developed by BSG DEVELOPPEMENTS, for these experiments. A system of three stepper motors and a control card was used in order to modify the main sheet length Lsheet and main car position Lcar (see Fig. 1). Therefore, the mainsail trimming was imposed remotely without any human contact in the wind tunnel. The un-certainty of imposed trimming was estimated to be ±2 mm through repeated measurements. Fig. 2 shows the 2.2 m long mast with the scaled mainsail in the 7.2 m wide by 3.5 m tall open jet test section of the YRU wind tunnel. Sail geometry is defined in Fig. 1. The rig is composed of a single 14 mm circular section carbon mast without
spread-x
y
U
60°
A10
A30
0
357
600
2100
x
z
y
L
carL
sheetFigure 1: Experimental set up for dynamic trimming. Di-mensions are in mm.
ers, backstay or forestay. The objective is to create a sim-ple bench experiment to study the aerodynamic effect of the dynamic trimming and to validate trimming optimization methods. The experiment includes Fluid Structure Interac-tion with mast deformaInterac-tion for use in numerical model com-parisons. A six-component force balance located under the floor of the wind tunnel measures aerodynamic forces. The X-direction is aligned with the model longitudinal direction forward (driving force), the Y -direction is perpendicular positive port-side and measures the side force and the Z-direction is vertical as shown in Fig. 1. The balance preci-sion was verified by calibration testing and the uncertainty on X, Y and Z axis are ±0.09 N, ±0.11 N and ±0.27 N re-spectively. A load sensor of 50 N range measures the sheet load with a precision of ±0.02 N. The flying shape is mea-sured with five orange stripes (see Fig.2) through the VS-PARS acquisition system (Le Pelley and Modral, 2008). The sampling frequency of the system measurement is 200 Hz and every run is recorded over 30 s.
The velocity profile follows the empty wind tunnel boundary layer profile and is not twisted (no vanes in the flow). The apparent wind speed (AW S) is Uref = 3.5 m s−1 ± 0.15 m s−1 - measured at 1.5 m high at the model-scale location in an empty configuration- and an ap-parent wind angle (AW A) set to 60◦± 2◦.
A Pitot tube in the wind tunnel roof, was used to measure the dynamic pressure during each run. The mean value q(t) calculated for each test was used for the normalization of
Figure 2: Model mainsail in YRU Twisted Flow Wind Tun-nel, University of Auckland
equations in order to correct for the possible fluctuations in the wind tunnel flow speed.
Optimum trimming
Different sail design shapes were tested. Three sails, made from the same sail cloth were designed with different cam-bers:
• MSstd = camber of the full scale sail (9.19% at the ref-erence stripe)
• MSflat = no camber
• MSmax = more camber than MSstd (11.67% at the ref-erence stripe)
A first test was performed in order to determine the best trim for the studied AW A = 60◦. The model was placed on the balance and the sail was statically trimmed to the op-timum CFobj = CFx− 0.1|CFy|. This optimization target takes into account the contribution of the side force on the aerodynamic force and can be found in the design process of sailing yacht to consider the penalty due to the added hy-drodynamic drag and leeway. For more details on the op-timization function readers should refer to (Sacher et al., 2015). Three stepper motors were used as winches to trim the sail: two motors used to trim the traveller position Lcar and one centered motor used to trim the main sheet length Lsheet. Here we were looking for the best 2 trimming pa-rameters (Lsheet, Lcar). Optimum trimming was extracted from the test using the algorithm described in (Sacher et al.,
2016) and used as the reference for the dynamic trimming described in the following sections.
Dynamic trimming
The dynamic trimming consists of an oscillation in the sheet length Lsheetaround the optimum trimming length obtained previously. The dynamic trimming was done with a fixed traveller position Lcar (obtained from the optimum trim-ming) and the instantaneous sheet length Lsheet(t) could be calculated from the controlled and recorded angular position of the rotating plate (see Fig. 3 and 1 ). Lsheet(t), the instan-taneous length of the sheet, is a function of A the amplitude of variation in mm, f the frequency of oscillation (rotation frequency of the stepper motor controlling the rotating plate) in Hz and the model-scale configuration geometry. The fre-quency f and amplitude A of oscillation were controlled by the rotating plate placed at the center-line of the boat as il-lustrated in Fig. 3. The sheet was connected to a pin fixed on the plate. The amplitude of oscillation depends on radial position of the pin. A = 10 mm stands for an eccentric of 10 mm and corresponds to a peak to peak amplitude of mo-tion of 20 mm on Lsheet(oscillation of Lsheetof ±10 mm).
Rotating plate
frequency f
Pin
Amplitude A
L
sheetSail
Figure 3: Experimental set up for dynamic trimming: rotat-ing disk (photograph taken without wind)
RESULTS
We examine here the influence of the dynamic trimming on the aerodynamic forces of the sail. Three different sails were tested for 3 amplitudes of oscillation of 10 mm, 20 mm and 30 mm and 7 ordered frequencies from 0 Hz to 3 Hz. From
these frequencies, non-dimensional reduced frequencies fr are defined in the post processing parameters.
Post processing parameters
In this study we define the reduced frequency fr = f.c/Uref, with f the frequency of oscillation in Hz, c the reference chord length c = S/h = 0.475 m and Uref = 3.5 m s−1the reference flow speed. The reduced frequency is a non-dimensional indicator defined as the ratio of the os-cillating motion to the reference convection time, from 0 to 0.38.
In the following part, aerodynamic forces and sheet loads are normalized as:
• the instantaneous aerodynamic driving force is defined using CFx(t) =
Fx(t)
q(t)S
• its mean value presented in our study CFx = CFx(t) = Fq(t)Sx(t)
• equivalent definition is used for the side force coeffi-cient CFy = CFy(t) =
Fy(t)
q(t)S
• equivalent definition is used for the sheet load coeffi-cient CFsheet = CFsheet(t) =
Fsheet(t)
q(t)S
• q(t) = 1 2ρU (t)
2is the dynamic pressure measured dur-ing the run by the pitot tube.
Forces were averaged over an integer number of period of oscillation regardless of the reduced frequency in order to compare relevant mean values. Time series were filtered with a low pass filter frequencies defined as a Savitzky-Golay filter of order 1 of span 21 samples (Schafer, 2011). Effect of the reduced frequency fr
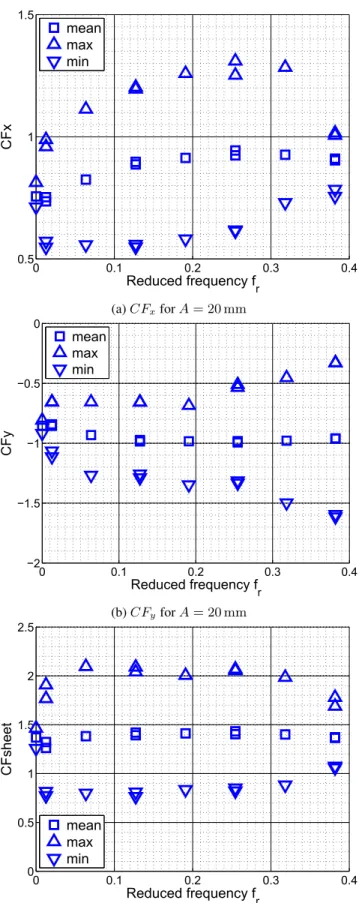
We focus here on the effect of the reduced frequency fron the forces for the case of the standard mainsail (MSstd) for an oscillation amplitude A = 20 mm round the optimum Lsheet. Coefficients were averaged over the maximum num-ber of integer oscillation periods found in the 30 s recording. Results are presented in Fig. 4. Measurements were dou-bled and showed good repeatability. Up and down triangles represent the maximum amplitude i.e. the maximum and minimum value of the time series.
For the first oscillation frequency studied, fr < 0.02, the force coefficients decrease compared to the static situ-ation fr = 0 values. The oscillation is very slow and could be considered as quasi-steady. This quasi-steady oscillation around the optimum Lsheet degrades the performance be-cause the sail is trimmed at a non-optimum point most of the time. For fr > 0.02, dynamic trimming increases the mean force coefficient, which reaches a maximum around fr= 0.255.
0 0.1 0.2 0.3 0.4 0.5 1 1.5 Reduced frequency fr CFx mean max min (a) CFxfor A = 20 mm 0 0.1 0.2 0.3 0.4 −2 −1.5 −1 −0.5 0 Reduced frequency f r CFy mean max min (b) CFyfor A = 20 mm 0 0.1 0.2 0.3 0.4 0 0.5 1 1.5 2 2.5 Reduced frequency fr CFsheet mean max min (c) CFsheetfor A = 20 mm
Figure 4: Effect of fr at amplitude A = 20 mm on CFx (fig 4a), CFy(fig 4b) and CFsheet(fig 4c) for the standard mainsail. Up and down triangles represent the maximum and minimu amplitude of the time series respectively
The aerodynamic forces seem to benefit from an unsteady propulsion phenomenon due to the flapping of the sail. This unsteady propulsion is maximized for a defined range of fre-quencies and its effect decreases above fr= 0.255. Ampli-tudes of variation of the force coefficients, illustrated by the triangles in Fig. 4, increase significantly until fr = 0.255 and collapse dramatically at higher frequencies for CFxand CFsheet. In the case of CFy, the amplitude of variation keeps increasing with the frequency of oscillation. The re-sults show the effect of dynamic trimming compared to the steady trimming maximizes CFxat a specific range of re-duced frequency around 0.255.
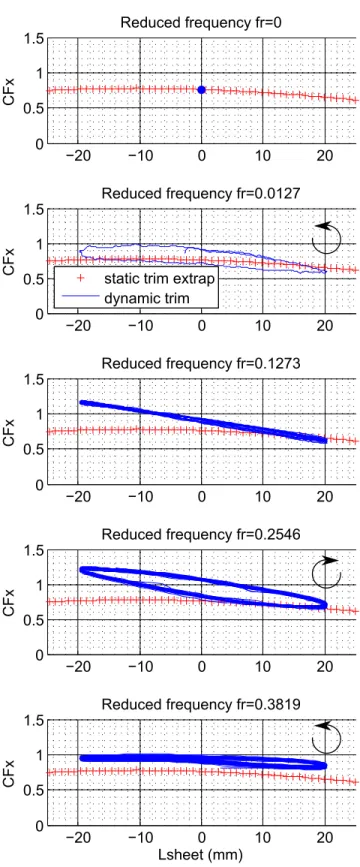
Figs. 5 and 6 present the temporal evolution of the load in the sheet and the driving coefficient with the sheet length. This type of Lissajou representation was first proposed for a sailing yacht study by Fossati and Muggiasca (2009, 2010, 2011) in wind tunnel testing and was then used by (Augier et al., 2013, 2014) in simulations and full scale measure-ments. For more clarity, signals are represented for only 12 s. We present 4 of the 8 studied frequencies, but the trends are identical. The top graph illustrates the static case. The number of cycles represented increases with the fre-quency fr. All the curves have been centered around their respective optimimum Lsheet, which are slightly different for the different design shapes. Lsheet = 0 mm is set at the static optimum trim Lsheet staticfor the optimum of the optimization target CFobj.
CFsheet vs Lsheet describes a loop which witnesses a hysteresis phenomenon (Fig. 5). In this case, the area in-side the loop is the mechanical work exchanged with the rig system from the trimming stepper motor. The counter-clockwise sense of rotation, indicated by the arrow on the figure, shows that the work is negative, i.e. given to the sys-tem. This confirms that the sail and rig system are forced by the motion of the sheet for the whole range of studied frequencies. The area in the loop increases slightly until f r = 0.255 where it reaches a maximum. The loop col-lapses at f r = 0.38. The work exchanged with the rig sys-tem is a maximum at f r = 0.255 which corresponds to the optimum CFxobserved in Fig. 4a.
CFxvs Lsheet describes a loop as well (Fig. 6). One should realise that the area inside the loops is not actual physical work however it follows the same trend as the work energy from Fxalong the x-direction. It is very interesting to observe that the sense of rotation switches for the dif-ferent frequencies. For fr = 0.013 and 0.38, the system dissipates energy as it turns counter-clockwise. The system gains energy from the oscillation at fr = 0.255 (clockwise rotation). The fr= 0.127 case is a transition where the loop describes a figure 8 shape.
−20 −10 0 10 20 0.5 1 1.5 2 2.5 Reduced)frequency)fr=0 CFsheet −20 −10 0 10 20 0.5 1 1.5 2 2.5 Reduced)frequency)fr=0.0127 CFsheet −20 −10 0 10 20 0.5 1 1.5 2 2.5 Reduced)frequency)fr=0.1273 CFsheet −20 −10 0 10 20 0.5 1 1.5 2 2.5 Reduced)frequency)fr=0.2546 CFsheet −20 −10 0 10 20 0.5 1 1.5 2 2.5 Reduced)frequency)fr=0.3819 Lsheet)(mm) CFsheet
Figure 5: Evolution of CFsheet with Lsheet at amplitude A = 20 mm for the standard mainsail for different reduced frequencies. Signals are presented for 12 s. The steady part was done without load sensor, so no steady load sheet is available for this configuration.
−20 −10 0 10 20 0 0.5 1 1.5 Reduced9frequency9fr=0 CFx −20 −10 0 10 20 0 0.5 1 1.5 CFx Reduced9frequency9fr=0.0127 9 static9trim9extrap dynamic9trim −20 −10 0 10 20 0 0.5 1 1.5 Reduced9frequency9fr=0.1273 CFx −20 −10 0 10 20 0 0.5 1 1.5 Reduced9frequency9fr=0.2546 CFx −20 −10 0 10 20 0 0.5 1 1.5 Reduced9frequency9fr=0.3819 Lsheet9(mm) CFx
Figure 6: Evolution of CFxwith Lsheet at amplitude A = 20 mm for the standard mainsail for different reduced fre-quencies. Signals are presented for 12 s. Red crosses repre-sent the steady state extrapolated from the 2D optimization part data.
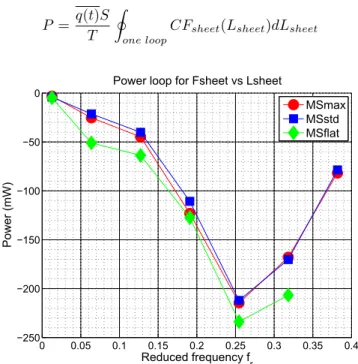
Power is calculated at each reduced frequency and pre-sented in Fig. 7. Power is proportional to the area in the loop illustrated in Fig. 5 and is defined as:
P = q(t)S T
I
one loop
CFsheet(Lsheet)dLsheet
0 0.05 0.1 0.15 0.2 0.25 0.3 0.35 0.4 −250 −200 −150 −100 −50 0 PowerWloopWforWFsheetWvsWLsheet ReducedWfrequencyWf r PowerW(mW) MSmax MSstd MSflat
Figure 7: Power given to the system by the sheet oscillation forcing at A = 20 mm. Power is proportional to the area in the loop represented in Fig. 5
The power value shown on Fig. 7 is the averaged value of each power value calculated using the previous equation on each entire period oscillation loop. The exchange of energy of the forcing is related to the maximum of force obtained at fr = 0.255 and the sudden collapse of the amplitude of variation of CFxand CFsheet at fr = 0.38. Nevertheless a part of the trend observed in the force coefficient needs to be explained by studying the other parameters of the other forcing parameters such as the sail camber i.e. the design shape.
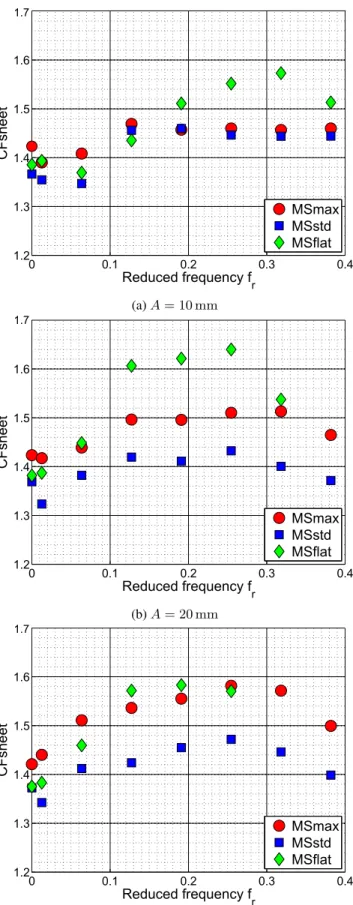
Effect of the design shape
The effects of the reduced frequency fr on the forces are presented for the 3 design shapes and the 3 amplitudes of oscillation. For each sail, the trimming oscillation is done around its specific optimum. Lsheet Static are different for each case. Again, coefficients are averaged over the max-imum number of full oscillation periods found in the 30 s recording. Results are presented in Figs. 8, 9 and 10, CFx, CFsheet and CFobj respectively. Oscillation ampli-tudes (maximum and minimum value) of force coefficients are not displayed for clarity but trends are identical to those described in the previous section. Due to the parameters of the optimum trimming (Lsheet, Lcar) for the flat mainsail design shape, high frequency oscillations could not be ex-plored at A = 30 mm because the forcing was too strong.
The general trends described in the previous section are identical for the 3 studied sail design shape and the differ-ent amplitudes of oscillation. The tendencies observed at A = 20 mm are amplified at greater amplitude A = 30 mm and slightly minimized at A = 10 mm.
It is interesting to notice that the effect of the dynamic trimming is greater for the flat mainsail design MSflat. The CFxcoefficient are nearly identical for the two cambered sails for A = 10 mm and A = 20 mm whereas the static performances are significantly worse. It seems that the dy-namic behavior due to flapping catches/compensates for the defect of flat mainsail design MSflat in static conditions. The unsteady propulsion phenomenon is high enough to compensate for the poor aerodynamic performance of the flat sail in a steady trimming. The oscillation needs a mini-mum of amplitude of A > 10 mm to have a significant effect on the MSflat. However, the optimum of MSflat is reached for a specific frequency fr = 0.255 and decreases rapidly around this value, unlike the other sails MSmax and MSstd where the range of optimal frequencies is wider.
The load in the sheet in static situations i.e. fr = 0 is linked to the camber (Fig. 9). The static CFsheetis greater for the maximum camber mainsail MSmax and it is iden-tical for the two other sails. Variations in the load in the sheet CFsheet for different frequencies are consistent with the effect of dynamic trimming observed on MSflat. The trends are identical with CFx. At low oscillation ampli-tudes, the sheet tension increases significantly for the flat sail until fr= 0.32, when the CFsheetreaches a maximum and decreases slightly after fr = 0.13 for the other sails. For A = 20 mm, the maximum load in the sheet is reached at lower frequencies but a greater load is still necessary to make the flat sail oscillate. It seems that at these amplitudes, the energy brought to the system by the forced oscillation is greater in the case of MSflat, which explains the impor-tant gain on the aerodynamic coefficients observed in Figs. 5 and 6. The differences between the sails are smoothed at A = 30 mm in CFsheet, as illustrated by the energy brought to the system in CFxand CFy. Energy brought to the sys-tem by the oscillation of the sheet is illustrated in Fig. 7. The power exchanged is a maximum at fr= 0.255.
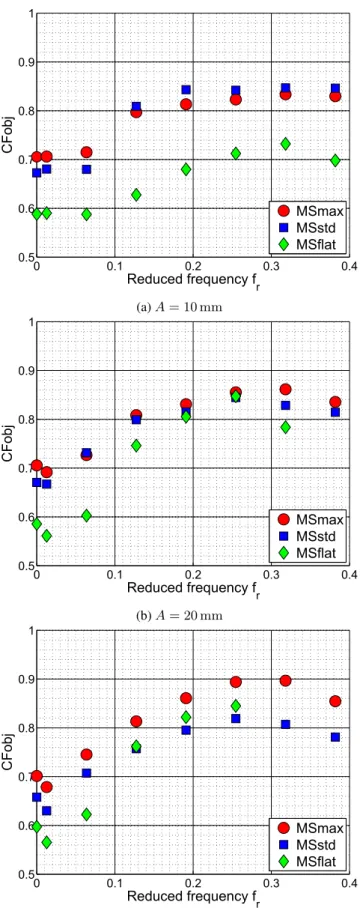
The CFobj evolution shown in Fig. 10 depends on both the camber of the sail and the amplitude of oscillation. For the low oscillation A = 10 mm in Fig. 10a, the optimization target shows a maximum for the flat mainsail design con-trary to the standard and maximum camber designs which present a plateau from fr = 0.255. This plateau disappears for higher amplitude oscillations and all the curves present a maximum. The maximum camber design presents either the best optimization value or is fairly close to the maxi-mum optimization target value regarding the different os-cilation frequencies and amplitudes. For this AW A = 60◦ this trend confirms the sailors’ knowledge causing them to try to increase the camber by easing the outhaul of the sail to improve their performance in a situation such as a dogleg while sailing perpendicular to the true wind direction.
0 0.1 0.2 0.3 0.4 0.5 0.6 0.7 0.8 0.9 1 1.1 Reducedlfrequencylfr CFx MSmax MSstd MSflat (a) A = 10 mm 0 0.1 0.2 0.3 0.4 0.6 0.7 0.8 0.9 1 1.1 Reduced frequency fr CFx MSmax MSstd MSflat (b) A = 20 mm 0 0.1 0.2 0.3 0.4 0.6 0.7 0.8 0.9 1 1.1 Reduced frequency fr CFx MSmax MSstd MSflat (c) A = 30 mm
Figure 8: Effect of fr on CFx for the 3 design shape at amplitude (a) A = 10 mm, (b) A = 20 mm and (c) A = 30 mm. 0 0.1 0.2 0.3 0.4 1.2 1.3 1.4 1.5 1.6 Reduced frequency fr CFsheet MSmax MSstd MSflat 1.7 (a) A = 10 mm 0 0.1 0.2 0.3 0.4 1.2 1.3 1.4 1.5 1.6 Reduced frequency fr CFsheet MSmax MSstd MSflat 1.7 (b) A = 20 mm 0 0.1 0.2 0.3 0.4 1.2 1.3 1.4 1.5 1.6 Reduced frequency fr CFsheet MSmax MSstd MSflat 1.7 (c) A = 30 mm
Figure 9: Effect of fron CFsheetfor the 3 design shape at amplitude (a) A = 10 mm, (b) A = 20 mm and (c) A = 30 mm.
0 0.1 0.2 0.3 0.4 0.5 0.6 0.7 0.8 0.9 1 Reducedxfrequencyxfr CFobj MSmax MSstd MSflat (a) A = 10 mm 0 0.1 0.2 0.3 0.4 0.5 0.6 0.7 0.8 0.9 1 Reducedxfrequencyxfr CFobj MSmax MSstd MSflat (b) A = 20 mm 0 0.1 0.2 0.3 0.4 0.5 0.6 0.7 0.8 0.9 1 Reducedxfrequencyxfr CFobj MSmax MSstd MSflat (c) A = 30 mm
Figure 10: Effect of fron CFobjfor the 3 design shapes at amplitude (a) A = 10 mm, (b) A = 20 mm and (c) A = 30 mm.
DISCUSSION
Dynamic contributions to aerodynamic forces can be de-composed into three components. The first one is due to the change in circulation around the profile. At this AW A = 60◦, the more camber, the more lift in static conditions. The second component is due to the unsteady propulsion caused by the forced oscillation. At a certain range of frequencies studied, flapping might produce vortices structures benefi-cial to the aerodynamic force produced by the sail. Vortices structures are linked to the sail area, the frequency and the amplitude of oscillation but do not depend on the sail pro-file. This flapping effect on the flat sail MSflat which suffers from a poor static aerodynamic contribution is then much more significant but on a narrow range of frequencies. The third component is the energy transferred to the system by the oscillation forcing. As mentioned in the section describ-ing the effect of the reduced frequency fr, mechanical work is given to the system by the forcing in the sheet (Fig. 7). This work is dissipated at most of the frequencies but is ben-eficial to the thrust at fr = 0.255 (Fig. 8). In the case of a dynamic trimming, the aerodynamic force is composed of the three components with different effects depending on the frequencies and amplitudes of oscillation. It seems that the forcing at fr = 0.255 benefits from all three components, the reason for the local optimum at that frequency.
CONCLUSIONS
An innovative oscillating trimming experiment has been de-veloped in the Twisted Flow Wind Tunnel at the Yacht Re-search Unit, University of Auckland. The oscillating trim-ming effect has been studied on different design shapes of IMOCA 60 type mainsails at AW A = 60◦ with different input parameters: amplitude and reduced frequency. The dynamic oscillations clearly show that quasi-static measure-ments are not relevant for predicting aerodynamic forces even at quite low reduced frequencies. These results sup-port previous findings that static or quasi-static approaches are not sufficient to capture the complexities of dynamic ef-fects, even for the simplified oscillating trimming simula-tion.
The sheet load measurement enabled us to calculate the mechanical power transmitted from the trimming device to the entire rig and sail system and could be correlated with the aerodynamic force evolutions of the different sails.
The dynamic effect showed that there was an optimum re-duced frequency fr= 0.255 that improved the performance function for the different sails related to a maximum power transmitted to the rig and sails by the sheet. The three differ-ent model sails presdiffer-ented the same trends, but the dynamic improvement was more significant for the flat sail: up to an increase of 40% of its CFobjat fr= 0.255 and A = 30 mm compared to the steady case.
Oscillations around optimum static trim have also been performed for AW A = 25◦ and AW A = 40◦ and will
be compared to this paper’s results in a future publication. Flying shape and rig part tracking analysis will also be per-formed. Further work will be done using those data for comparison and validation of unsteady numerical simula-tion tools.
ACKNOWLEDGEMENTS
This project has received funding from the European Unions Seventh Program for research, technological development and demonstration under grant agreement No PIRSES-GA-2012-318924 and from the Royal Society of New Zealand for the UK-France-NZ collaboration project, SAILING FLUIDS (see www.sailingfluids.org). This work was sup-ported by the French Naval Academy, Brest M´etropole Oc´eane, R´egion Bretagne and the Marie Curie Euro-pean Unions Seventh Framework Programme (FP7/2007-2013) under REA grant agreement no PCOFUND-GA-2013-609102 (PRESTIGE-Campus France). This work was supported by the ”Laboratoire d’Excellence” LabexMER (ANR-10-LABX-19) and co-funded by a grant from the French government under the program ”Investissements d’Avenir”. The authors are grateful to K-Epsilon and VS-PARS company for their continuous collaboration and to Ronan Floch from Incidence Sails for designing and man-ufacturing the model-scale sails. The authors would like to thank the SEFER services for providing the electronical ac-tuator and remote control parts, Mr David Le Pelley, wind tunnel manager, and Dr Nick Velychko for their help, guid-ance, their wise advice and comments.
REFERENCES
CHARVET, T., HAUVILLE, F. and HUBERSON, S., Numer-ical simulation of the flow over sails in real sailing condi-tions, Journal of Wind Engineering and Industrial Aero-dynamics, 63(1-3), (1996), 111 – 129.
MARCHAJ, C., Sail performance: techniques to maximize sail power, International Marine/Ragged Mountain Press (1996).
GARRETT, R., The symmetry of sailing: the physics of sail-ing for yachtsmen, Sheridan House, Inc. (1996).
FOSSATI, F. and MUGGIASCA, S., An experimental investi-gation of unsteady sail aerodynamics including sail flex-ibility, 4th High Performance Yacht Design Conference, Auckland, New Zeeland (2012).
GERHARDT, F., FLAY, R.G.J. and RICHARDS, P.J., Un-steady aerodynamics of two interacting yacht sails in two-dimensional potential flow, Journal of Fluid Mechanics, 668(1), (2011), 551–581.
GERHARDT, F.C., Unsteady Aerodynamics of Upwind-Sailing and Tacking, Ph.D. thesis, The University of Auckland (2010).
AUGIER, B., BOT, P., HAUVILLE, F. and DURAND, M., Experimental validation of unsteady models for fluid structure interaction: Application to yacht sails and rigs, Journal of Wind Engineering and Industrial Aerodynam-ics, 101, (2012), 53–66.
AUGIER, B., BOT, P., HAUVILLE, F. and DURAND, M., Dynamic Behaviour of a Flexible Yacht Sail Plan, Ocean Engineering, 66, (2013), 32–43.
AUGIER, B., HAUVILLE, F., BOT, P., AUBIN, N. and DU
-RAND, M., Numerical study of a flexible sail plan submit-ted to pitching: Hysteresis phenomenon and effect of rig adjustments, Ocean Engineering, 90, (2014), 119–128. COLLIE, S. and GERRITSEN, M., The challenging
turbu-lent flows past downwind yacht sails and practical ap-plication of CFD to them, 2nd High Performance Yacht Design Conference, Auckland, New-Zealand (2006). DEPARDAY, J., BOT, P., HAUVILLE, F., MOTTA, D., LE
PELLEY, D.J. and FLAY, R.G.J., Dynamic measure-ments of pressures, sail shape and forces on a full-scale spinnaker, 23rd HISWA Symposium on Yacht Design and Yacht Construction, Amsterdam (2014).
MASUYAMA, Y., TAHARA, Y., FUKASAWA, T. and MAEDA, N., Dynamic performance of sailing cruiser by a full scale sea reality, The 11th Chesapeake Sailing Yacht Symposium, Annapolis, USA (1993).
MASUYAMA, Y. and FUKASAWA, T., Full scale measure-ment of sail force and the validation of numerical calcu-lation method, The 13th Chesapeake Sailing Yacht Sym-posium, Annapolis, USA (1997).
RICHARDT, T., HARRIES, S. and HOCHKIRCH, K., Ma-neuvering simulations for ships and sailing yachts using FRIENDSHIP-Equilibrium as an open modular work-bench, International Euro-Conference on Computer Ap-plications and Information Technology in the Maritime Industries (2005).
KEUNING, J., VERMEULEN, K. and DE RIDDER, E., A generic mathematical model for the manoeuvring and tacking of a sailing yacht, The 17th Chesapeake Sailing Yacht Symposium, (143–163), Annapolis, USA (2005). SCHOOP, H. and BESSERT, N., Instationary aeroelastic
computation of yacht sails, International Journal for Nu-merical Methods in Engineering, 52(8), (2001), 787–803. RENZSH, H. and GRAF, K., Fluid Structure Interaction simulation of spinnakers - Getting closer to reality, 2nd International Conference on Innovation in High Perfor-mance Sailing Yachts, Lorient, France (2010).
CHAPIN, V. and HEPPEL, P., Performance optimization of interacting sails through fluid structure coupling, 2nd International Conference on Innovation in High Perfor-mance Sailing Yachts, Lorient, France (2010).
TRIMARCHI, D., VIDRASCU, M., TAUNTON, D., TURNOCK, S. and CHAPELLE, D., Wrinkle development analysis in thin sail-like structures using MITC shell fi-nite elements, Fifi-nite Elements in Analysis and Design, 64, (2013), 48–64.
RANZENBACH, R., ARMITAGE, D. and CARRAU, A., Mainsail Planform Optimization for IRC 52 Using Fluid Structure Interaction, 21st Chesapeake Sailing Yacht Symposium, March, (50–58), Annapolis (2013).
DURAND, M., LEROYER, A., LOTHODE´, C., HAUVILLE, F., VISONNEAU, M., FLOCH, R. and GUILLAUME, L., FSI investigation on stability of downwind sails with an automatic dynamic trimming, Ocean Engineering, 90, (2014), 129–139.
FOSSATI, F., BAYATI, I., ORLANDINI, F., MUG
-GIASCA, S., VANDONE, A., MAINETTI, G., SALA, R., BERTORELLO, C. and BEGOVIC, E., A novel full scale laboratory for yacht engineering research, Ocean Engi-neering, 104, (2015), 219–237.
FLAY, R.G.J., A twisted flow wind tunnel for testing yacht sails, Journal of Wind Engineering and Industrial Aero-dynamics, 63(1-3), (1996), 171–182.
RENZSCH, H. and GRAF, K., An experimental validation case for fluid-structure-interaction simulations of down-wind sails, 21st Chesapeake Sailing Yacht Symposium, March, (59–66), Annapolis (2013).
LE PELLEY, D.J., EKBLOM, P. and FLAY, R.G.J., Wind tunnel testing of downwind sails, 1st High Performance Yacht Design Conference, (66–75), Auckland (2002). VIOLA, I.M. and FLAY, R.G.J., On-water pressure
mea-surements on a modern asymmetric spinnaker, 21st HISWA Symposium on Yacht Design and Yacht Con-struction, November, Amsterdam (2010).
FOSSATI, F., Aero-Hydrodynamics and the Performance of Sailing Yachts: The Science Behind Sailing Yachts and Their Design, Adlard Coles Nautical (2010).
FOSSATI, F. and MUGGIASCA, S., Sails Aerodynamic Be-havior in dynamic condition, The 19th Chesapeake Sail-ing Yacht Symposium, Annapolis, USA (2009).
FOSSATI, F. and MUGGIASCA, S., Numerical modelling of sail aerodynamic behavior in dynamic conditions, 2nd International Conference on Innovation in High Perfor-mance Sailing Yachts, Lorient, France (2010).
WRIGHT, A.M., CLAUGHTON, A.R., PATON, J. and LEWIS, R., Off-wind sail performance prediction and op-timisation, The Second International Conference on In-novation in High Performance Sailing Yachts, Lorient, France (2010).
LASHER, W. and RICHARDS, P., Validation of Reynolds-averaged NavierStokes simulations for international Americas Cup class spinnaker force coefficients in an at-mospheric boundary layer., Journal of Ship Reseasrch, 51 (1), (2007), 2238.
GRAF, K. and M ¨ULLER, O., Photogrammetric Investiga-tion of the Flying Shape of Spinnakers in a Twisted Flow Wind Tunnel, 19th Chesapeake Sailing Yacht Sympo-sium, March, Annapolis (2009).
VIOLA, I.M. and FLAY, R.G.J., Sail pressures from full-scale, wind-tunnel and numerical investigations, Ocean Engineering, 38(16), (2011), 1733–1743.
VIOLA, I., BOT, P. and RIOTTE, M., Upwind sail
aerody-namics: A RANS numerical investigation validated with wind tunnel pressure measurements, International Journal of Heat and Fluid Flow, 39, (2013), 90–101.
FOSSATI, F. and MUGGIASCA, S., Experimental investiga-tion of sail aerodynamic behavior in dynamic condiinvestiga-tions, Journal of Sailboat Technology, 2, (2011), 1–41.
LE PELLEY, D. and MODRAL, O., VSPARS: A combined sail and rig recognition system using imaging techniques, 3rd High Performance Yacht Design Conference, 14, (2008), 57–66.
SACHER, M., HAUVILLE, F., BOT, P. and DURAND, M., Sail trimming FSI simulation - comparison of viscous and inviscid flow models to optimise upwind sails trim, 5th High Performance Yacht Design Conference, (217–228), Auckland, New-Zealand (2015).
SACHER, M., HAUVILLE, F., DUVIGNEAU, R., LE MA
-TRE, O., AUBIN, N. and DURAND, M., Experimental and numerical trimming optimizations for a mainsail in upwind conditions, The 22nd Chesapeake Sailing Yacht symposium, Annapolis, Maryland (2016).
SCHAFER, R., What Is a Savitzky-Golay Filter?, IEEE Sig-nal Processing Magazine, 28(4), (2011), 111–117.