To Salt or Not to Salt: Three MALDI-TOF IMS Protocols Where (De)Salting Proved Essential
Par Ethan Yang
Département de chimie, Faculté des arts et des sciences
Thèse présentée en vue de l’obtention du grade de doctorat (Ph.D.) en chimie
Mai 2020
Université de Montréal
Département de chimie, Faculté des arts et des sciences
Cette thèse intitulée
To Salt or Not to Salt: Three MALDI-TOF IMS Protocols Where (De)Salting Proved Essential
Présenté par Ethan Yang
A été évalué(e) par un jury composé des personnes suivantes Prof. Pierre Thibault
Président-rapporteur Prof. Pierre Chaurand
Directeur de recherche Prof. Karen Waldron
Membre du jury Prof. Kevin Schey Examinateur externe
Résumé
Présentement, la désorption ionisation laser assistée par la matrice (MALDI) est la méthode d’ionisation préférentielle pour étudier les lipides par l’imagerie par spectrométrie de masse (IMS). Bien qu’il existe les matrices spécifiques aux lipides, tel que la 1,5-DAN pour les phospholipides et la 2,5-DHB pour les triacylglycérols, il est toujours nécessaire d’augmenter la sensibilité de cette technique pour les échantillons atypiques ou certaines classes de lipides.
Dans la première étude, nous avons amélioré la sensitivité pour les phospholipides sur les tubes de Malpighi de mouches prélevés par microdissection dans un tampon physiologique à base de sodium et potassium. Un protocole de lavage à deux étapes a était trouvé favorable : un premier rinçage dans le glycérol suivi d’un second rinçage dans l’acétate d’ammonium. Ce protocole permet de réduire au maximum la présence de sels sans délocalisation notoire des phospholipides. La détection et l’imagerie des phospholipides en ionisation négative et positive ont suggéré une distribution uniforme sur toute la longueur des tubes. Ces résultats ont été comparés à ceux obtenus sur des sections tissulaires minces de mouche entière acquis avec les deux polarités. Néanmoins, la structure tridimensionnelle complexe des tubes rénaux suggère que la microdissection est l’approche la plus favorable pour en étudier leur lipidome.
Dans la deuxième étude, nous avons déterminé que l’addition de formate d’ammonium (AF) peut améliorer la détection des gangliosides par IMS dans le cerveau. Curieusement, il est nécessaire de rincer l’échantillon dans une solution d’AF avant l’addition de ce même sel suivit d’une conservation de l’échantillon dans un congélateur pendant 24 heures après la déposition de la matrice afin d’obtenir la meilleure augmentation de sensibilité. En moyenne, cette approche a permis d’augmenter l’intensité d’un facteur dix avec trois fois plus d’espèces de gangliosides détectées. De plus, malgré l’étape de lavage, nous n’avons pas observé la délocalisation des
gangliosides puisqu’il est toujours possible d’obtenir les résultats d’IMS de qualité avec une résolution spatiale de 20 µm.
Finalement, nous avons établi que le nitrate d’argent permet l’analyse des oléfines par IMS, en particulier du cholestérol. En optimisant le protocole de déposition par nébulisation, il est possible de générer une couche mince et homogène de nitrate d’argent ce qui rend la possibilité d’effectuer l’IMS à haute résolution spatiale, jusqu’à 10 µm, sans perte de qualité comparativement aux autres approches publiées.
L’ensemble de ce travail démontre l’effet du sel sur la sélectivité et la sensibilité pour cibler les familles de lipides désirées, ce qui nécessite les études ultérieures sur le rôle de ces sels lors du processus de la désorption-ionisation.
Mots clés : MALDI, imagerie par spectrométrie de masse, lipidomique, sel, optimisation, ganglioside, phospholipide, cholestérol, tube de Malpighi
Abstract
Matrix-assisted laser desorption/ionization imaging mass spectrometry (MALDI IMS) is currently the ionization method of choice for elucidating the spatial distribution of lipids on thin tissue sections. Despite the discovery of lipid friendly matrices such as 1,5-DAN for phospholipids and 2,5-DHB for triacylglycerols, there is a continued need to improve sensitivity.
In the first study, we improved the overall sensitivity for phospholipids of entire fly Malpighian tubules microdissected in PBS with a two-step wash in glycerol followed by ammonium acetate that removed the bulk of the salt with minimal species delocalization and tubule displacement. We were able to detect phospholipids in both positive and negative ion modes and revealed an even distribution of most phospholipids along the length of this organ. We compared the method to the results from whole body fly sections acquired in dual-polarity mode at the same spatial resolution and found it to be more suitable for studying the tubules because of the complex three-dimensional structure of this organ within the fly.
In the second study, we observed a marked improvement in ganglioside signals on mouse brain tissue sections with ammonium salt addition. Specifically, when the sample was first desalted in a low concentration ammonium formate solution, spray-coated with the same salt, coated with matrix and finally left in the freezer overnight before data acquisition, we observed an average overall improvement in ganglioside signal intensity by ten-fold and the number of species detected by three-fold. This method also did not affect the spatial distribution of the gangliosides, as high spatial resolution IMS results acquired at 20 µm showed no species delocalization.
Finally, we sought to determine if salts could be employed directly as matrices. In this work, we tested silver-based metal salts and discovered that spray depositing silver nitrate alone is a viable method for the IMS detection of olefins, particularly cholesterol. With the optimized dry
spray parameter, the overall deposition is homogeneous and composed of microscopic salt crystals that allow for high spatial resolution IMS down to 10 µm while maintaining acceptable overall signal quality comparable to that of previously published protocols.
Overall, this thesis demonstrates we can manipulate the local salt distribution to influence the sensitivity and selectivity to target specific lipid subfamilies, opening the door for future research to understanding the role salts play during the laser desorption/ionization process.
Keywords: MALDI, Imaging Mass Spectrometry, Lipidomics, Salt, Optimization, Ganglioside, Phospholipid, Cholesterol, Malpighian Tubules, Brain
Table of Contents
Résumé ... i Abstract ... iii Table of Contents ... v List of Tables ... x List of Figures ... xi Abbreviations ... xvi Acknowledgements ... xx Chapter 1: Introduction ... 11.1. What is Mass Spectrometry? ... 2
1.1.1. The Anatomy of a Mass Spectrometer ... 3
1.1.2. Matrix-Assisted Laser Desorption/Ionization (MALDI) ... 4
1.1.2.1. History of MALDI ... 4
1.1.2.2. The Basics of MALDI ... 5
1.1.3. Time-of-Flight (TOF) Mass Analyzer ... 7
1.1.3.1. Improvements to TOF: Delayed Extraction (DE) and the Reflectron (rTOF) .... 9
1.1.3.2. TOF/TOF Tandem Mass Spectrometry (MS/MS) ... 11
1.2. From MS to Imaging MS ... 13
1.2.1. Imaging MS: From Proteomics to Lipidomics ... 14
1.2.2.1. MALDI IMS of Free Fatty Acids and Sterols ... 16
1.2.2.2. IMS of Phospholipids ... 19
1.2.2.3. IMS of Phospholipids on Drosophila ... 21
1.2.2.4. IMS of Gangliosides ... 22
1.2.3. Advantages and Drawbacks of MALDI IMS ... 24
1.2.4. MALDI IMS Sample Preparation ... 25
1.2.4.1. Thin Tissue Sections ... 25
1.2.4.2. Microdissected Organs ... 28
1.2.5. Effect of Salts on MALDI IMS of Lipids ... 29
1.3. Research Objectives ... 31
Chapter 2: Mapping the Fly Malpighian Tubule Lipidome by Imaging Mass Spectrometry .... 34
2.1. Abstract ... 35
2.2. Introduction ... 36
2.3. Experimental ... 37
2.3.1. Materials & Reagents ... 37
2.3.2. Malpighian Tubule Microdissection Protocol ... 38
2.3.3. Fly Embedding and Cryosectioning Protocol ... 38
2.3.4. MALDI IMS Sample Preparation ... 39
2.3.5. MALDI-TOF Mass Spectrometry ... 40
2.4. Results & Discussion ... 41
2.4.1. Buffer Selection for Malpighian Tubule Microdissection ... 42
2.4.2. Sample Washing Wash Optimization for Microdissected Malpighian Tubules ... 42
2.4.3. Matrix Selection for Microdissected Malpighian Tubules ... 44
2.4.4. On-tissue characterization of Microdissected Malpighian Tubules ... 44
Figure 2-2: Positive and Negative ion Polarity MALDI-TOF MS Lipid Profiles. ... 45
2.4.5. Choice of Embedding Medium and Matrix for Fly Sections ... 48
2.4.6. On-tissue Characterization of the Fly Sections ... 49
2.4.7. Advantages and Limitations of Each Approach ... 52
2.5. Conclusions ... 53
2.6. Acknowledgements ... 54
2.7. Supplemental Information ... 55
Chapter 3: Enhancing Ganglioside Species Detection for MALDI-TOF Imaging Mass Spectrometry in Negative Reflectron Mode ... 69
3.1. Abstract ... 70
3.2. Introduction ... 71
3.3. Experimental ... 72
3.3.1. Chemicals and Reagents ... 72
3.3.2. Tissue Sampling and Sectioning ... 72
3.3.4. Investigating ammonium formate (AF) deposition by the TM-Sprayer ... 73
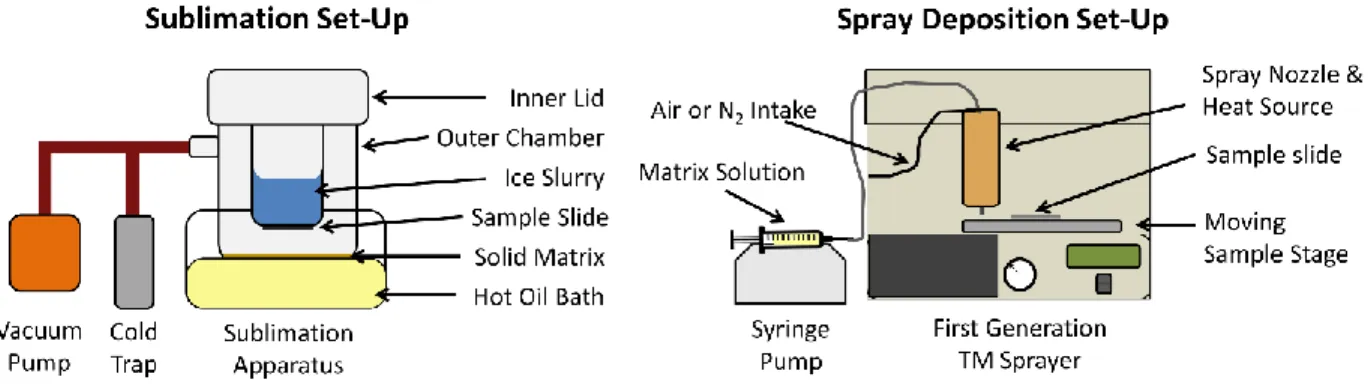
3.3.5. Matrix Deposition by Sublimation ... 74
3.3.6. Determining the Optimal Wait Time Before Data Acquisition ... 74
3.3.7. MALDI-TOF Mass Spectrometry ... 74
3.3.8. Data Analysis ... 75
3.4. Results & Discussion ... 76
3.4.1. Choice of Matrix and its Method of Deposition ... 76
3.4.2. On-Tissue Optimization & Characterization ... 76
3.4.3. On-Tissue Signal Identification ... 81
3.4.4. IMS of a Horizontal Mouse Brain Section ... 82
3.5. Conclusions ... 86
3.6. Acknowledgements ... 86
3.7. Supplemental Information ... 88
Chapter 4: Silver Spray Deposition for AgLDI Imaging MS of Cholesterol and Other Olefins on Thin Tissue Sections ... 99
4.1. Abstract ... 100
4.2. Introduction ... 101
4.3. Experimental ... 103
4.3.1. Materials & Reagents ... 103
4.3.3. Silver Salt Manual Spotting ... 104
4.3.4. Silver Salt Spray Deposition ... 104
4.3.5. Silver Sputter Deposition ... 105
4.3.6. LDI Mass Spectrometry ... 105
4.3.7. Data Analysis ... 106
4.4. Results & Discussion ... 107
4.4.1. Silver Salt Selection ... 107
4.4.2. Silver Nitrate Thickness Optimization ... 107
4.4.3. Solvent System Optimization ... 109
4.4.4. On-Tissue Characterization of AgNO3 Sprayed Samples ... 114
4.4.5. Silver Sprayed versus Silver Sputtered IMS ... 117
4.4.6. Advantages and Limitations of the AgNO3 Spray Approach ... 118
4.5. Conclusions ... 119
4.6. Acknowledgements ... 120
4.7. Supplemental Information ... 121
Chapter 5: Conclusion & Future Perspectives ... 129
5.1. Conclusion ... 130
5.2. Future Perspectives ... 132
List of Tables
Table 1-1: Total Lipid Species in Lipid Maps by Category as of March 25, 2020. ... 16
Supplemental Table 2-1: Poly-Lysine Application Protocol. ... 55
Supplemental Table 2-2: H&E Protocol. ... 55
Supplemental Table 2-3: Putative Assignments of the Top 65 Phospholipid Signals by MS/MS.56 Supplemental Table 3-1: H&E Staining Protocol for Mouse Brain Section... 89
Supplemental Table 3-2: TM Sprayer AF Deposition Parameters. ... 91
Supplemental Table 4-1: H&E Protocol Applied. ... 121
List of Figures
Figure 1-1: The Four Main Components of a Standard Mass Spectrometer. ... 3
Figure 1-2: General MALDI Mechanism. ... 6
Figure 1-3: Linear TOF MS System Schema. ... 8
Figure 1-4: Delayed Extraction Schema. ... 9
Figure 1-5: General Schema of reflectron TOF MS. ... 10
Figure 1-6: LIFT-TOF/TOF Schema. ... 12
Figure 1-7: General Overview of Imaging Mass Spectrometry. ... 13
Figure 1-8: An Example Fatty Acid. ... 17
Figure 1-9: Structure of Cholesterol. ... 18
Figure 1-10: The Six Phospholipid Classes and Their Headgroups... 20
Figure 1-11: Ganglioside Synthesis Pathway. ... 23
Figure 1-12: MALDI IMS Workflow. ... 26
Figure 1-13: Sublimation and Spray Matrix Deposition Set-Up. ... 27
Figure 2-1: Malpighian Tubule MALDI IMS Workflow. ... 39
Figure 2-3 MALDI IMS Results of Microdissected Malpighian Tubules. ... 46
Figure 2-5: Dual Ion Polarity MALDI IMS acquired from a Whole-body Drosophila Section. ... 51 Supplemental Figure 2-1: Positive Ionization MALDI-TOF MS Lipid Profiles Acquired from Microdissected Malpighian Tubules in Different Buffers. ... 59 Supplemental Figure 2-2: Negative Ionization MALDI-TOF MS Lipid Profiles Acquired from Microdissected Malpighian Tubules in Different Buffers. ... 60 Supplemental Figure 2-3: Positive Ionization MALDI-TOF MS Lipid Profiles Acquired from Microdissected Malpighian Tubules in PBS and Washed in Different Ammonium-Based Salts. 61 Supplemental Figure 2-4: Negative Ionization MALDI-TOF MS Lipid Profiles Acquired from Microdissected Malpighian Tubules in PBS and Washed in Different Ammonium-Based Salts. 62
Supplemental Figure 2-5: Positive and Negative Ionization MALDI-TOF MS Lipid Profiles from Microdissected Tubules in PBS and Washed Using Different % Glycerol Solutions. ... 63
Supplemental Figure 2-6: Mean Positive Ionization MALDI-TOF IMS Spectra of Lipids Acquired from Fly Tissue Sections Obtained after Embedding and Sectioning in Different Media. ... 64 Supplemental Figure 2-7: Segmentation Analysis of the Dual Polarity IMS Results after Legs and Wings Removal. ... 65 Supplemental Figure 2-8: MALDI MS/MS Fragmentation Pattern of PA, PE, PI, LPC, PC and SM Species. ... 67
Figure 3-1: Typical Negative Mode MALDI MS Spectra (Scaled to the Same Intensity) from Brain Tissue Sections Subjected to the Control, Optimal Ammonium Formate (AF) Wash, Optimal AF
Spray Deposition, and Optimal AF Wash Followed by Optimal AF Spray Deposition. ... 77
Figure 3-2: Effects of Wait Time, AF Wash and AF Spray on Ganglioside Signal. ... 79
Figure 3-3: MALDI-TOF MS/MS spectra of GM1 (d36:1) ... 81
Figure 3-4: MALDI-TOF IMS of serial horizontal mouse brain tissue sections ... 83
Figure 3-5: MALDI-TOF IMS of mouse horizontal brain tissue sections (near serial sections from the same brain) in the hippocampus region ... 85
Supplemental Figure 3-1: Schematic Representation of the Ganglioside Lipid Family. ... 88
Supplemental Figure 3-2: Typical Negative Reflectron Mode MALDI-TOF MS Spectra of the Brain Hippocampal Region ... 90
Supplemental Figure 3-3: Optimization Curves for AF washing Conditions ... 92
Supplemental Figure 3-4: Brightfield Images of 14 µm Mouse Brain Sections at 20X Magnification Before and After 30 µg/cm2 Ammonium Formate (AF) Deposition... 93
Supplemental Figure 3-5: Typical Negative Mode MALDI-TOF MS Spectra from Brain Tissue Sections Subjected to Four Different Sample Preparation Approaches ... 94
Supplemental Figure 3-6: Typical MALDI-TOF MS Profiling Data Obtained from the Total Ganglioside Extract using DAN as the Matrix (above) and On-Tissue Using the Optimal Method (below). ... 95
Supplemental Figure 3-7: On-Tissue MALDI-TOF MS/MS Spectra of Fully Identified Ganglioside Species Displaying a Typical Fragmentation Pathway. ... 96 Supplemental Figure 3-8: MALDI-TOF IMS of Purported Unidentified Sialylated Species from Serial Horizontal Mouse Brain Tissue Sections ... 97
Supplemental Figure 3-9: MALDI-TOF MS Spectra Acquired on a Mouse Brain Tissue Section in the Hippocampal Area after the Optimal Section Processing Method was Applied. ... 98
Figure 4-1: Optimization of Silver Nitrate Spray Deposition on Mouse Brain Homogenate sections. ... 109 Figure 4-2: Effects of Solvent System on Crystal Size and Deposition Homogeneity. ... 111
Figure 4-3: Effects of TFA concentration on total cholesterol signal and signal homogeneity. .. 113 Figure 4-4: AgLDI MS & IMS at 100 µm spatial resolution from a half mouse brain section after AgNO3 spray deposition ... 115 Figure 4-5: High-resolution AgLDI IMS from a horizontal mouse brain section. ... 117 Supplemental Figure 4-1: Spectral Comparison of Silver Salts Spotted on a Mouse Brain Tissue Section. ... 124 Supplemental Figure 4-2: The Effects of Flow Rate and Track Spacing on AgNO3 Crystal Size.
... 125 Supplemental Figure 4-3: Representative MS/MS Results of Select Olefins and Other Species. ... 126
Supplemental Figure 4-4: Spectral and Image Comparison of AgNO3 Spray vs Silver Sputtering of
the Mouse Cerebellum. ... 127 Supplemental Figure 4-5: Visual Horizontal Mouse Brain Section Comparison After Silver Spray and Sputter Deposition. ... 128
Abbreviations
9AA: 9-Aminoacridine
AA: Arachidonic Acid
ACN: Acetonitrile
Ag: Silver
AgAc: Silver Acetate
AgLDI: Silver-Assisted Laser/Desorption Ionization AgNO3: Silver Nitrate
AmA: Ammonium Acetate
AmB: Ammonium Bicarbonate
AmF: Ammonium Formate
Cer: Ceramide
CHO: Cholesterol
Da: Dalton
1,5-DAN: 1,5-Diaminonapthalene
DG: Diacylglyceride
DHA: Docosahexaenoic Acid
2,5-DHB: 2,5-Dihydroxybenzoic Acid 2,6-DHA: 2,6-Dihydroxyacetophenone 2,5-DHA: 2,5-Dihydroxyacetophenone
CHCA: α-Cyano-4-hydroxycinnamic
SA: Sinapinic Acid
FA: Fatty Acid GA: Asialoganglioside GD: Disialoganglioside GG: Gangliosides GL: Glycerolipids GM: Monosialoganglioside GP: Pentasialoganglioside GQ: Quadrosialoganglioside GT: Trisialoganglioside
H&E: Hematoxylin and Eosin Staining IMS: Imaging Mass Spectrometry
ITO: Indium Tin Oxide
LA: Linoleic Acid
LDI: Laser/Desorption Ionization m/z: Mass-to-Charge Ratio
MALDI: Matrix-Assisted Laser/Desorption Ionization
MeOH: Methanol
MS/MS: Tandem Mass Spectrometry
MS: Mass Spectrometry
MT: Malpighian Tubule
MBT: 2-Mercaptobenzothiazole NEG: Negative Ionization Mode
nH: Norharmane
PA: Phosphatidic Acid
PBS: Phosphate-Buffered Saline
PBT: Phosphate-Buffered Saline with 0.1% Tween
PC: Phosphatidylcholine
PE: Phosphatidylethanolamine
PI: Phosphatidylinositol
PL: Phospholipid
POS: Positive Ionization Mode
PS: Phosphatidylserine
S/N: Signal-to-Noise Ratio
SM: Sphingomyelin
SP: Sphingolipid
ST: Sterol lipid
TFA: Trifluoroacetic Acid
TG: Triacylglyceride
TOF/TOF-MS: Tandem TOF Mass Spectrometry
Acknowledgements
Cette aventure a commencé le 12 mars, 2015, cinq ans avant le confinement qui nous a tous forcé de rester chez nous pendant plus que deux mois. Nearly one year had passed since receiving my bachelor’s degree from McGill University and I was jobless. Having received rejection letters from all medical schools I had applied for and only a few thousand dollars left in my bank accounts, I frantically applied for jobs so that I would not end up penniless. Back when Facebook was still the thing, Dawn discovered the 1st (and to this day, the only) McGill Chemistry Career Fair hosted
by then Dean of Science, Prof. Martin Grant, at Thomson House on McTavish. An hour before the fair, Dawn and I were lounging in the McSWAY office on the 6th floor of the SSMU Building.
Relaxed at first, I refused to leave the comfort of the beach chair when it became time to leave for the event. I was nervous. What was a biochemist doing in a chemistry career fair? Would I find any appropriate opportunities? Had I even the qualifications? Never mind that, Dawn reminded me, there was free pizza and drinks, as she shooed me away and up the hastily re-paved McTavish. I obediently obliged. Good thing, too, because I had left with a happy belly and a bright future.
Maintenant que le déconfinement se déroule pas à pas, ma nouvelle aventure débutera bientôt. Five years later, I am once again faced with the same dilemma, with even more possibilities than before. Indeed, beyond the specialized knowledge I gained in imaging mass spectrometry, I have also developed invaluable life skills in time management, verbal and written communication, and teamwork. While at first it may seem my options narrowed, upon introspection, I believe my career prospects have widened. I was fortunate to not have signed up to work in a fire pit, as some PhD studies could be, though I did have my fair share of crises to manage. I am grateful to have trained under a passionate and insightful supervisor who provided the necessary guidance along the way. I am certainly thankful to the seniors before me who led the way and the juniors after me
who will continue our great work. I am also blessed to have had a constant beacon of support along the way.
Thank you, Pierre, for taking that leap of faith in a biochemistry major and nurturing him into an analytical chemist. Merci, Martin, de m’avoir guidé dès ma première journée au laboratoire tout en français, même si mon niveau de français était pourri. Thanks, Heath, for your constant help with my data analytical needs, even to this very day. Merci, Nidia et Elisabeth, pour tous ce que vous m’avez enseigné en MS. Merci, Carine, pour m’avoir introduit à un laboratoire de chimie organique et de me conseiller. Merci, Sibylle, pour ton amitié et de m’avoir beaucoup aidé pour le cours CHM 2971. Danke, Timon, for the talks over beer that has certainly alleviated some of the necessary stress. Thank you to Let’s Talk Science for keeping me inspired about science and giving the chance to develop my soft skills. Merci, Julie, Baptiste et Khalid, les trois stagiaires que j’ai eu la chance de diriger. Merci, Frédéric, pour avoir entrepris la maintenance du laboratoire quand je suis parti pour un stage. Je te souhaite le meilleur dans le nouvel espace au campus MIL avec Zari et Rachel. Thanks, Jackie, for the weekly check-ins that disciplined me while writing this thesis. Thanks, Liv, for the continued friendship and mentorship eight years and counting! 還有在台灣 的那些好友們,希望你們都能平安、快樂、發論文順利畢業。在此也要感謝我的父母親從
小到大不斷的陪伴還有嚴格的培養,我會繼續努力的!Thank you, Zach and Caleb, for
putting up with me for more than two decades. And of course, thank you, Dawn, for your unwavering support and relentless fun. I would not have made it this far without you and would love for you to be with me until the end. Merci aux travailleuses et travailleurs de la ligne de front. Finally, thank you to everyone else who I have forgotten or not named but have, one way or another, shaped me into who I am. Whatever the future holds, equipped with a PhD, I am more than prepared to meet these challenges thanks to each and every one of you.
1.1. What is Mass Spectrometry?
A little over a century ago, Sir Joseph J. Thomson, with the help of his assistant Francis W. Aston, developed a “positive ray method” that could “determine the masses of all the particles” of a cathode ray1. In this set-up, charged ions were sent traveling across a metal tube in the presence
of parallel electric and magnetic fields towards a photographic plate at the end of the tube. The ions followed parabolic trajectories and marked distinctive bands on specific regions of the photographic plate respective of their mass-to-charge ratio in this environment1. This rudimentary
instrument, widely recognized as the first mass spectrometer, provided the evidence for isotopes of neon and gave rise to the field of mass spectrometry (MS)1.
Since this seminal publication in 1913, new ionization methods pushed MS into scientific relevance. The introduction of electron impact (EI) in 1918 by Dempster and chemical ionization (CI) in 1966 by Munson and Field provided powerful and complementary methods to analyze and identify small organic compounds2-6. The combination of inductively coupled plasma (ICP) to MS
in 1980 by Houk et al. extended MS into the analysis of elemental and trace metals7, 8. Soon, the
arrival of “soft” ionization techniques, electrospray ionization (ESI) in 1984 from Yamashita and Fennand and matrix-assisted laser/desorption ionization (MALDI) in 1988 from Karas and Hillenkamp, opened MS to the world of biomedical research9-11. Continuous innovations in mass
analyzers further advanced the technical capabilities of MS. These include the double-focusing sector instruments such as the Nier-Johnson12, 13, the small and versatile quadrupole14 that is most
often configured as a triple quadrupole (QqQ)15, 16, the high mass resolving power
Fourier-transform ion cyclotron resonance (FT-ICR) ion traps17 and the orbitrap18, and of course, the ultra
high mass analyzer time-of-flight (TOF)19, 20. Consequently, MS has now become an inseparable
infections22, 23, regularly testing athletes for illegal doping24, meticulously revealing clues of our
past civilizations25, systematically elucidating complex mechanisms behind countless diseases26,
cautiously leading the fight against the current opioid crisis27, 28, and even continuously uncovering
answers about other planets in our solar system29.
1.1.1. The Anatomy of a Mass Spectrometer
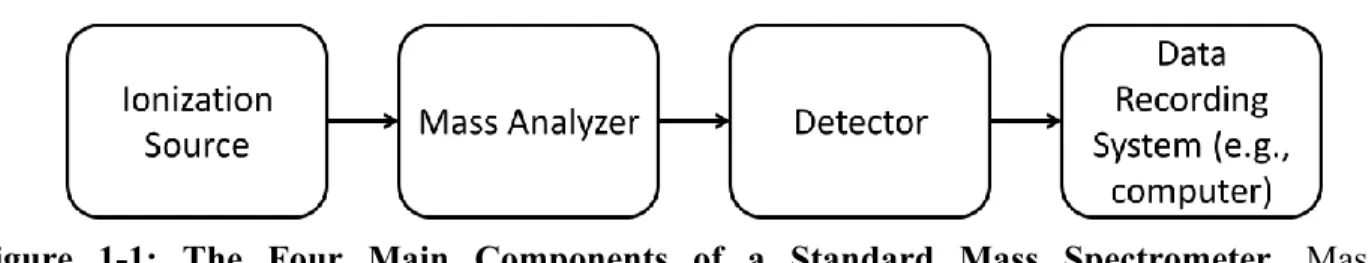
From the very first to the latest, all mass spectrometers contain these four essential main components: an ionization source, a mass analyzer, a detector and a data recording system (Figure 1-1). Samples are introduced either continuously or in pulses into the source where they undergo ionization as gas phase molecules. These charged analytes enter the mass analyzer and are separated based on their mass-to-charge ratio (m/z). Once separated, the ions are released towards the detector, which translates the charge induced or the current produced by the ion hitting its surface into a mass spectrum that is displayed through instrument specific software on a computer. These main components are usually physically distinct. However, some mass analyzers can also act as the detector, such as FT-ICRs, in which case the ions are not sacrificed during detection17.
Figure 1-1: The Four Main Components of a Standard Mass Spectrometer. Mass spectrometers are composed of four main components: an ionization source, a mass analyzer, a detector and a data recording system.
Typically, the analysis of complex samples is preceded by a separation technique before mass spectral analysis. Currently, the two most popular approaches are gas chromatography (GC) and liquid chromatography (LC). In GC, vaporized compounds are separated along a long column based on their interaction with the stationary phase, while in LC, compounds in a liquid mixture
are separated on a much shorter column based on their interaction with both the stationary and mobile phase. High-performance liquid chromatography (HPLC) and ultra-performance liquid chromatography (UPLC) are the most popular LC techniques owing to their efficiency in separating samples and the large selection of analytical columns that cover nearly all separation needs. When small quantities are analyzed, nano-LC30 and capillary electrophoresis (CE)31, which
separates ions based on their electrophoretic mobility under an applied electric field, are called upon. In cases where sample preseparation is insufficient or impossible, ion mobility spectrometry can provide the extra degree of separation post ionization. First described by McDaniel32, ion
mobility separates ions based on their drift velocity in the presence of an electric field rather than their m/z33. The vast possibilities have resulted in highly elaborate and arduous separation
techniques that often take much longer than the MS analysis itself. MALDI, in its simplest form, can analyze complex samples with minimal separation.
1.1.2. Matrix-Assisted Laser Desorption/Ionization (MALDI)
1.1.2.1. History of MALDILike other pulsed ionization techniques, laser desorption/ionization (LDI) is particularly useful for analyzing solid samples. Instead of applying a beam of neutral atoms in fast atom bombardment (FAB)34 or charged ions in secondary ion mass spectrometry (SIMS)35, LDI
employs high energy photons to irradiate and desorb a precise area of a solid sample to produce ions36. However, because of the strong laser energetics, LDI often leads to immediate
fragmentation, particularly of labile bonds in large molecules such as proteins, limiting the applicability of this technique to low mass biomolecules37, 38 and structural analysis39, 40. This
changed in 1987 when Tanaka et al. published their work in which lysozyme suspended in metal-filled glycerol was detected intact after desorption and ionization with a pulsed N2 laser41. This
initial report was quickly followed by the work of Karas and Hillenkamp that achieved the same results by firing an Nd:YaG laser at a dried mixture of the same enzyme co-crystallized with nicotinic acid10. While Tanaka received the Nobel Prize for this “soft ionization technique,” it was
Karas and Hillenkamp’s approach that the scientific community embraced and came to define as matrix-assisted laser desorption/ionization (MALDI). With the development of multiple matrices and reliable instrumentation, MALDI has moved beyond protein analysis into studying phospholipids42, 43, amino acids44, 45, polysaccharides46, 47, oligonucleotides48, 49, polymers50, 51 and
viruses52, 53. This method has even become a routine analysis for identifying bacterial infections22.
1.1.2.2. The Basics of MALDI
In general, MALDI requires the co-crystallization of the analyte and the matrix compound, which is achieved by adding the matrix to the analyte-containing sample in an excess of ~5000:1. The matrix is most often an organic molecule with strong absorbance at the laser wavelength, typically in the ultraviolet (UV) range. In many commercially available systems, such as the one used for all experimentation in this thesis, it is the frequency-tripled Neodymium-doped Yttrium Aluminum Garnet (Nd:YaG) laser at 355 nm which is used54. Multiple matrices have been
discovered for specific classes of analytes. For example, α-Cyano-4-hydroxycinnamic (CHCA) is most often employed for peptide analysis55, 2,5-dihydroxybenzoic acid (2,5-DHB) is common for
proteins56, phospholipids57 and small metabolites58, and sinapinic acid (SA) is the matrix of choice
for protein analysis59. Nonetheless, novel matrices and matrix mixtures, such as the 1,5
diaminonaphthalene (1,5-DAN) discovered in this lab for phospholipids60, the rationally-designed
4-Chloro-α-cyanocinnamic acid (CICCA) for improved peptide sensitivity61, and a CHCA and
2,5-DHB solution mixture for protein analysis62 are continually being pursued to broaden the scope of
MALDI in biological research. As such, matrix selection is a critical aspect of this technique. There are various approaches to preparing the MALDI sample. The original method is the
dried-droplet approach10, wherein the analyte and matrix solution are mixed before a microlitre
volume of this mixture is deposited onto the target plate. Other approaches, such as the thin-layer63
and the sandwich method64, require the sequential addition of the matrix solution and the analyte
solution onto the target plate. Numerous adaptations and variations of these approaches have been described in the literature63-67 with the aim to improve the matrix-analyte co-crystallization and
sample homogeneity.
Despite continuous efforts, the MALDI mechanism is not fully known. Multiple theories and pathways have been studied and explored regarding both ionization and desorption68-71. Generally,
the entire process is described in these following steps, as shown in Figure 1-2. First, the laser ablates the analyte-matrix mixture. This mixture contains both neutral analytes as well as
Figure 1-2: General MALDI Mechanism. 1) Laser ablates the analyte-matrix mixture containing neutral and precharged analytes. 2) The matrix absorbs and releases the bulk of the energy heat, leading to the sublimation of matrix molecules and the desorption of analytes and other impurities. 3) Desorbed molecules undergo proton exchange, most notably between matrix and analyte, to create ionized species. Some pre-charged analytes survive the desorption event and dissociate from their counterion to form charged analytes.
precharged analytes formed during sample preparation. The matrix molecules absorb most of this energy and release the bulk of it to the surrounding in the form of heat. This thermal expansion leads to the desorption of the matrix and analyte from the surface, creating a hot plume of gaseous molecules containing a mix of charged and neutral matrix molecules. The reactive matrix species undergo protonation or deprotonation events with analyte molecules, leading to their ionization. At the same time, some of the desorbed precharged analytes retain their charge after dissociating from their counterions, producing the “lucky survivors.” Experimental results have found evidence supporting both mechanisms, for example, that of Jaskolla and Karas 2011 which investigated the preferred mechanism as a consequence of laser fluency, the acidity of the analyte and the pH of the sample preparation solution 72. Finally, depending on the extraction voltage, either cations or anions
are propelled into the mass analyzer, typically a time-of-flight (TOF).
1.1.3. Time-of-Flight (TOF) Mass Analyzer
The concept of a linear time-of-flight (TOF) system was first described by Stephens in 1946 as “a pulsed mass spectrometer with mass dispersion” at the annual meeting of the American Physical Society at the Massachusetts Institute of Technology in the United States73. Soon after,
Cameron and Eggers (1948) managed to build such a system, dubbed the “Velocitron,” to study mercury gas74. However, this was not a true TOF because the ions were not introduced with equal
momentum. It was not until 1953 that Stephens himself introduced the TOF with an accelerator, albeit with a low mass resolution of twenty20. Since then, advancements in electronic circuitries,
innovations that counter the effects of energy spread75-77 have steadily improved the mass resolving
power of TOF analyzers to rival that of orbitraps78.
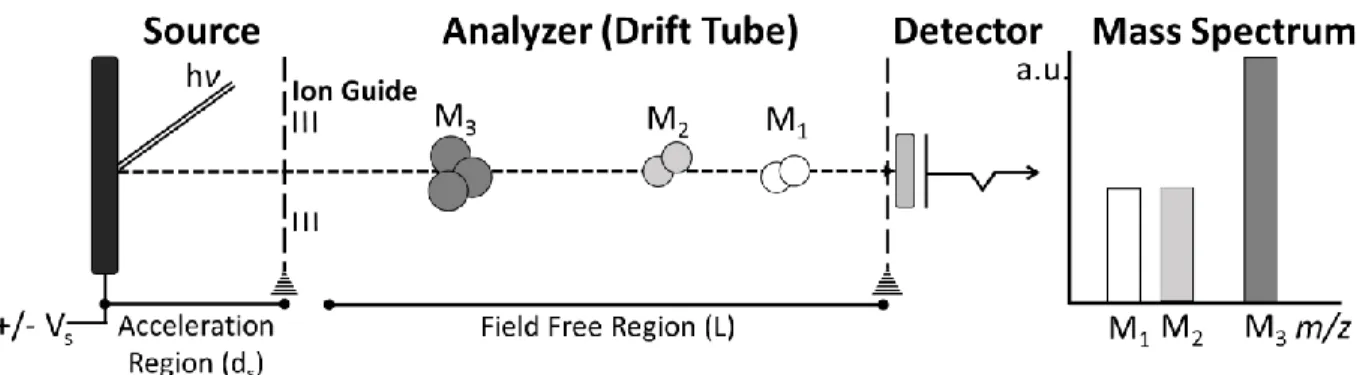
A TOF analyzer measures the amount of time ions take to travel across a high vacuum, field-free drift tube of a fixed length (L) post acceleration in an electric field (Vs/L). This measurement,
known as the time of flight (t), can be used to determine the m/z given the mathematical relationship described in Equation 1-1:
𝑚⁄ = (𝑧 2𝑒𝑉𝑠
𝐿2 ) 𝑡2
Equation 1-1: Relationship between m/z and Time (t) in a TOF Mass Analyzer. With the length of the flight tube (L), the elementary charge (e), and the electric field fixed, the time an ion spends in the TOF before reaching the detector reveals its m/z.
This equation dictates that ions of the same charge with higher mass will have a longer time-of-flight than those with a lower mass. Indeed, since ions experience the same initial acceleration voltage, they possess the same kinetic energy during their flight and therefore travel at a velocity that is inversely proportional to their mass.
The most simplistic kind of TOF analyzer is the linear TOF system, shown in Figure 1-3, composed of an accelerator, a metal flight tube, and a detector. Linear TOF systems offer certain advantages over other types of mass analyzers. For one, linear TOF systems have no theoretical mass range limit. Commercial systems are mostly limited by ion stability in the source and the choice of detector19, 79, 80. A meter-long flight tube under constant vacuum is characteristic of linear
Figure 1-3: Linear TOF MS System Schema. A linear TOF MS is composed of an accelerator embedded in the ion source, ion guides that lead the ion to the linear flight tube, and an ion detector at the other end of the flight tube.
TOF systems. A long flight path improves the mass resolution by elongating the flight time between ions of similar m/z. A high vacuum environment reduces peak broadening due to loss of kinetic energy or fragment ion formation upon collision with ambient gas molecules. However, there are practical limits to the flight tube length and the vacuum strength. Other approaches are needed to improve the mass resolution of TOF MS.
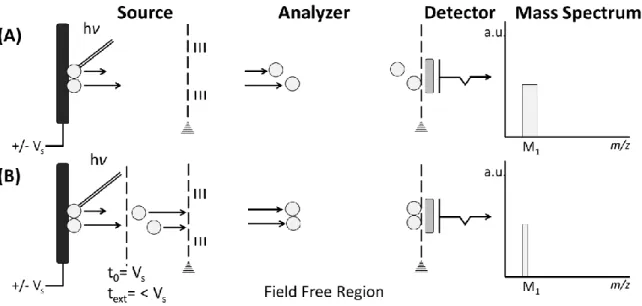
1.1.3.1. Improvements to TOF: Delayed Extraction (DE) and the Reflectron (rTOF) Two problems that plagued early TOF systems was the initial spatial distribution and energy spread of ions. These two problems are inherent in the MALDI process since not all analytes are positioned flat against the target plate and are further subject to different laser energy levels depending on the laser ablation pattern. Both issues lead to a greater distribution in initial velocity and therefore flight time, resulting in broader peaks and lower mass resolution. Thankfully, the
Figure 1-4: Delayed Extraction Schema. (A) With constant field extraction, ions of the same m/z but differing initial kinetic energy will arrive at the detector at slightly different times. (B) Delayed extraction corrects for the initial spatial distribution of ions of the same m/z by applying the acceleration voltage a few nanoseconds after the laser pulse. This results in the time focusing of the ions on the plane of the detector and improve mass resolution.
development of delayed extraction81 and the reflectron TOF77 have helped mitigate these issues.
Delayed extraction (DE) compensates for the initial spatial distribution among ions of the same m/z caused by the difference in their initial velocity82. As shown in Figure 1-4, instead of
applying the acceleration voltage immediately upon laser pulse, the electric field is switched on some nanoseconds later so that ions with higher initial kinetic are further away from the extraction plate and receive less energy, while those with lower kinetic energy receive more. The closer level of kinetic energy helps to center these ions in time, decrease peak width, leading to an increase in mass resolution. DE can be applied for both low mass83 and high mass molecules84.
The reflectron corrects for the difference in initial kinetic energy of ions (ε) of the same m/z through lengthening their flight time according to their kinetic energy. As seen in Figure 1-5, through a series of electrostatic mirrors, the reflectron deflects the ion beam and forces ions with a higher kinetic energy (and higher velocity) to penetrate more deeply into the electric field,
Figure 1-5: General Schema of reflectron TOF MS. The reflectron is composed of a series of electrostatic grids whose voltage (Vr) is higher than the source voltage (Vs). Specifically, the end
plate voltage is higher than the source voltage so that the ions will be ejected out of the reflectron in the opposite direction. This configuration provides ions with a greater initial kinetic energy (ε) a longer flight path, resulting in ions of the same m/z arriving simultaneously at the detector.
effectively allowing those with a lower kinetic energy to “catch up” when reaching the detector77.
This results in a decrease in peak width and consequently, an improvement in mass resolution, as shown in Figure 1-5. TOF analyzers with multiple reflectrons offer multiple instances of rectifying the initial kinetic energy spread. The most common is the W formation that contains two electrostatic grids at the end of each junction to guide the ions85, 86. However, more complex
geometries and flight paths have been developed to reach higher mass resolutions, such as the multi-reflecting TOF by Verechikov et al. that claimed 500k mass resolution at m/z 50087 and the
commercially available spiral TOF mass spectrometer that claimed 80k mass resolution at m/z 256488. These approaches are invariably compromised by the loss in sensitivity, since not all ions—
particularly those of high mass—are stable enough to survive the reflectron event. 1.1.3.2. TOF/TOF Tandem Mass Spectrometry (MS/MS)
Tandem mass spectrometry couples two mass analyzers within a single mass spectrometer to provide structural information on the target analyte ions. This is achieved by isolating the precursor ion in the first mass analyzer, inducing its fragmentation, and detecting the product ions using the second mass analyzer. Because ionized molecules tend to dissociate in characteristic ways based on the fragmentation technique and their chemical composition, the product ions provide information on the structure of the precursor ion. Scientists have taken advantage of this phenomenon to create MS/MS databases to better identify proteins89, 90, metabolites91 and other
compounds92, 93.
In most common situations, MS/MS is achieved inside a collision cell, during which a small amount of helium is introduced to induce fragmentation94, 95. In the MALDI-TOF/TOF system used
for all work presented in this thesis, however, no such cell exists. Rather, the TOF/TOF system relies on excess laser energy uptake from the precursor ion to generate metastable decomposition and induce post-source fragmentation, a timed ion selector that only allows these ions to pass
through for secondary acceleration and a secondary reflectron TOF for final separation. This set-up is known as the “LIFT” technique because of the “lift” in potential by 19 kV set-upon entering the LIFT device96 shown in Figure 1-6. This approach takes advantage of the phenomenon that
fragment ions produced post-source retain the same velocity as their parent ion, since the total kinetic energy is shared among these fragment ions in proportion to their mass. TOF/TOF MS is powerful for peptide sequencing and other large molecules (m/z ≤ 4000) but is less effective for small molecules, which are inherently more stable. This approach is also non-ideal for complex mixtures with compounds of similar m/z, since a large precursor ion mass window of approximately 4 Da is necessary to achieve substantial MS/MS results.
Sequential or multistage mass spectrometry, dubbed MSn, is an extension of tandem mass
spectrometry whereby the isolation-fragmentation cycle is performed “n” number of times before being sent to the detector. This technique is needed to obtain in-depth structural information on a specific region of a molecule, for example, the determination of double-bond positions of triacylglycerol (TAG)97. MSn is not possible with TOFs but can be realized on set-ups that can eject
Figure 1-6: LIFT-TOF/TOF Schema. In LIFT-TOF/TOF, an initial strong laser pulse leads to metastable formation post-source. The timed ion selector allows ions of a certain velocity in the first TOF to enter the LIFT cell, where the metastable fragment ions from the selected precursor ion undergo secondary acceleration before entering the second TOF for mass separation.
product ions for further fragmentation, such as sector instruments 98, quadrupole ion traps99 and
quadrupole FT-ICRs 100.
1.2. From MS to Imaging MS
Imaging MS (IMS) is a powerful technique for investigating the surface molecular profile of any sample, for example, a thin tissue section. As shown in Figure 1-7, to achieve this, the area Figure 1-7: General Overview of Imaging Mass Spectrometry. A) To begin, the selected measurement region is divided into a grid. B) A mass spectrum is acquired at each point, or pixel, along the grid as shown in Panel A. C) Once all mass spectra have been acquired, an average spectrum representing the entire analysis can be visualized in specialized software. D) Selecting an m/z signal of interest will generate the corresponding ion heat map of interest, giving insight into the spatial distribution of that signal. The sample here is a horizontal mouse brain cerebellum acquired in negative ion mode at 30 µm spatial resolution and 100 laser shots per pixel and 1,5-DAN as the matrix. The scale bar represents 1 mm.
to be analyzed, the measurement region, is divided into a grid of a fixed dimension. The instrument scans across the grid, sampling at each point, commonly referred to as pixels. The distance between each pixel defines the spatial resolution, though this is only true of pulsed ionization techniques. Once completed, the IMS dataset contains the relative abundance of the m/z signals at each pixel position. The spatial distribution of any m/z signal can be mapped out on a Cartesian coordinate plane where each pixel is represented by a coordinate and at each coordinate the intensity is represented by the appropriate colour schema. In short, IMS simply repeats the same analysis across a given area at a precise and regular spatial interval to provide ion heat maps of the species present on a surface. Currently, three major IMS approaches exist: secondary ion mass spectrometry (SIMS), MALDI and desorption electrospray ionization (DESI). SIMS achieves ionization through the bombardment of the sample surface with an ion beam101, while DESI sprays
the sample with a stream of electrically charged solvent that both desorbs and ionizes the sample102.
1.2.1. Imaging MS: From Proteomics to Lipidomics
The first IMS results were obtained as early as 1962 by Castaing and Slodzian on isotopic distribution of elements35. However, IMS as a biomolecular imaging tool was not fully realized
until the advent of MALDI, for reasons specified in previous sections. While the first MALDI IMS results could very well be that of salts on pine tree roots obtained with a laser microprobe mass analyzer (LAMMA) presented in 1994 at the 42nd Annual Meeting of the American Society of
Mass Spectrometry from Spengler103, 104, it was the IMS results of proteins and peptides from an
aggregate of human buccal mucosa from Caprioli et al. published in 1997 that spurred the era of MALDI IMS in biology105.
MALDI IMS applications in proteomic studies has since exploded. The technique has been applied to studying nearly all mammalian organs26, 106-109. Optimized sample preparation protocols
for manipulating fresh frozen110 as well as formalin-fixed paraffin embedded (FFPE) tissues111 also
emerged. On top of this, the ability to accomplish whole-body IMS on rat112, 113, obtain high
resolution IMS data with an FT system114, conduct bottom-up proteomics with tryptic digest111, 115,
trace drugs and their metabolites116, 117 and correlate the ion signals to distinct histological
features109, 118 further fueled the widespread adoption of this technique.
At the same time IMS made headways into proteomics, it also began to contribute to the nascent field of lipidomics. Much of this was driven by a growing awareness towards the importance of lipids in disease states and the power of MS119 and IMS120 in tracking and visualizing this
dysregulation. The earliest reports of lipid IMS were conducted by SIMS116, 121 in the early 2000s,
though these were mostly lipid fragments rather than intact molecules. While MALDI MS of lipids was already demonstrated in the 1995122, 123, more effort at that time was focused on resolving
isobars through ion mobility42, 124 and understanding ion suppression effects125 than IMS. It was
not until the arrival of fine matrix deposition approaches126 and other sample optimization
techniques60, 127 that pushed MALD-TOF IMS into the center of lipidomic studies. It is important
to note that around the same time, DESI arrived on the scene102. This ambient ionization technique
offers the ability to detect lipids and other small metabolites with minimal sample preparation and has been the driving technology behind real-time cancer diagnosis and grading128. However,
because of limitations in mass range and spatial resolution inherent in the technique129, DESI is
still not as popular as MALDI today.
1.2.2. MALDI Imaging Mass Spectrometry of Lipids
Lipids are small hydrophobic or amphiphilic molecules important in living organisms. Beyond maintaining the structural integrity of most cells130, they act as specialized signalling molecules131
metabolic disorders132, 133 to neurological diseases134, 135 and even cancer136, 137. Indeed, as of March
25, 2020, Lipid Maps, the most comprehensive MS lipid database, contained 43,645 unique lipid structures, nearly 50% of which were manually curated and confirmed (see in Table 1-1).
Table 1-1: Total Lipid Species in Lipid Maps by Category as of March 25, 2020. Nearly 45,000 species are included in this database, over 21,000 of which are curated. Curated species have been confirmed by the literature, while computationally generated ones are theoretically possible.
Lipid Category Curated Computationally Generated All
Fatty acyls 7582 1792 9374 Glycerolipids 229 7379 7608 Glycerophospholipids 1606 8312 9918 Sphingolipids 1262 3176 4438 Sterol lipids 2828 0 2828 Prenol lipids 1353 0 1353 Sacccharolipids 22 1294 1316 Polyketides 6810 0 6810 TOTAL 21692 21953 43645
Classified into eight categories based on their function and structure92, the largest of these
curated groups are the fatty acyls and polyketides with more than 6000 species each, followed by sterol lipids with nearly 3000 species,. While many of these classes have been investigated previously by MALDI IMS, this introduction will focus on four particular (sub)classes relevant to the thesis: (a) sterols, a class of sterol lipids, (b) fatty acids, a class of fatty acyls, (c) glycerophospholipids, also known as phospholipids, and (d) gangliosides, a subclass of sphingolipids.
1.2.2.1. MALDI IMS of Free Fatty Acids and Sterols
Fatty acids (FAs) are carboxylic acids with a hydrocarbon chain. Saturated FAs contain no double bonds, while those with at least one on the aliphatic tail are unsaturated. Within unsaturated FAs, those with only one double bond are monosaturated and those with more are polyunsaturated.
De novo FA synthesis occurs in the liver from excess carbohydrates138. The resulting FAs are stored
for future use as triacylglycerols (TAGs) or incorporated into other lipids, such as phospholipids and sphingolipids. Interestingly, FAs can be cleaved from TAGs and released as free fatty acids (FFAs) into the bloodstream to act as signalling molecules in regular physiological processes139.
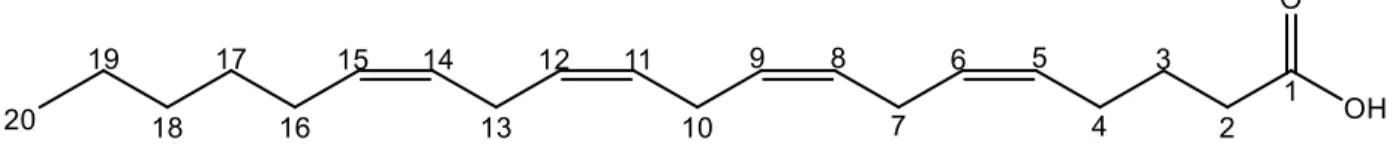
FAs are named based on the carbon chain length, the number of double bonds and each double-bond stereochemistry. For example, the fatty shown in Figure 1-8 can also be referred to as FA(20:4(5Z,8Z,11Z,14Z)) because it has 20 carbons and four cis unsaturations at the 5th, 8th, 11th
and 14th carbon position. Due to the difficulty of ascertaining the stereochemistry and the exact
position of the double-bond through standard MS and MSMS, in most cases, only the chain length and total number of double bonds are reported, so FA(20:4). When existing as FFAs, most are referenced by their conventional names rather than the prescribed nomenclature, for example, arachidonic acid (AA) rather than FA(20:4) or the IUPAC nomenclature (5Z,8Z,11Z,14Z)-5,8,11,14-Eicosatetraenoic acid.
Figure 1-8: An Example Fatty Acid. Fatty acids are defined by the length of their aliphatic tail, the number of double bonds and the stereochemistry. This FA is known as FA(20:4(5Z,8Z,11Z,14Z)) when bound to another structure and commonly referred to as arachidonic acid (AA) when free floating. The carbon number for this fatty acid is shown.
MALDI MS of FFAs were first conducted with meso-tetrakis(pentafluorophenyl)porphyrin (MTPP)140, a high molecular weight matrix with little background signal in the low mass range.
However, this method only worked for saturated FAs. Later, two highly basic matrices, 1,8-Bis(dimethylamino)naphthalene (DMAN)141 and 9-aminoacridine (9-AA)142, were demonstrated
to work for detecting FFAs in negative ion mode, the later of which has been employed in an IMS context143. More recently, 1,6-Diphenyl-1,3,5-hexatriene (DPH), a fluorescent probe, has been
discovered to be suitable for detecting FFAs and phospholipids with little matrix noise144. Another
avenue for IMS of FFAs avoids organic matrices altogether in favor of metals, particularly silver. This includes specialized silver nanoparticles spray-coated on tissue sections145 and sputter
deposition of a nano-layer of silver aggregates146. Because of silver’s preferential chelation to
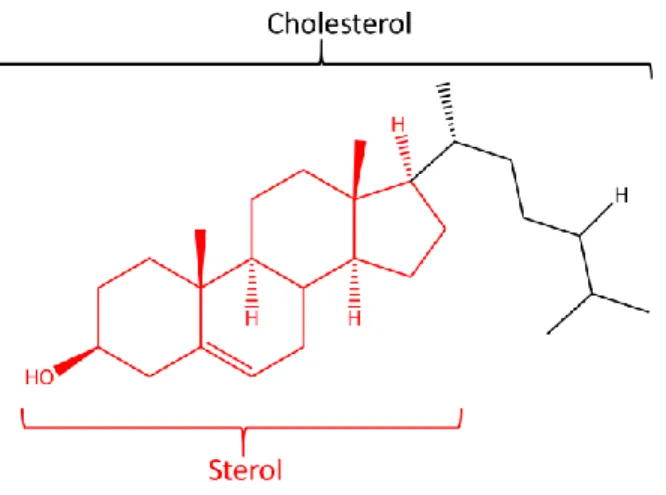
double bonds, this method also works spectacularly well for cholesterol, a sterol146. Sterols
represent a family of polycyclic compounds whose general structure is shown in Figure 1-9. A component of all eukaryotic cell membranes, cholesterol regulates the cell membrane fluidity130
and assist in lipid raft domain function and assembly147. It is an important component of the myelin
sheath, the reason for which 25% of all cholesterol in the human body is found in the brain148.Cholesterol is the simplest of all sterols. It can be transformed into a cholesterol ester with
the addition of a fatty acid, a reaction catalyzed by lecithin:cholesterol acyltransferase (LCAT)149,
and be transported in the blood as needed while bound to lipoproteins149. It is also a precursor for
steroid hormones150 and certain bile acids151. Thus, cholesterol homeostasis is crucial and its
dysregulation has been linked cardiovascular diseases such as atherosclerosis152 and stroke153, and
Figure 1-9: Structure of Cholesterol. Cholesterol is one of the main types of sterol, the polycyclic structure in red. Ubiquitous in animals, it is obtained from diet or synthesized de novo.
various types of cancer154.
The earliest IMS of cholesterol was obtained by SIMS on freeze-fractured membranes of liposomes155. In both SIMS and MALDI, however, cholesterol is most readily detected as a
dehydrated species119, 156, 157, making it impossible to differentiate between a true cholesterol and a
sterol fragment ion issued from a cholesterol ester. Silver adducts in both LDI and SIMS overcame this challenge as cholesterol is detected intact in its argentinated ion form146, 158. With MALDI,
however, should the sample be low in TAGs, it is also possible to detect cholesterol as a sodiated species after doping the samples with excess sodium159.
1.2.2.2. IMS of Phospholipids
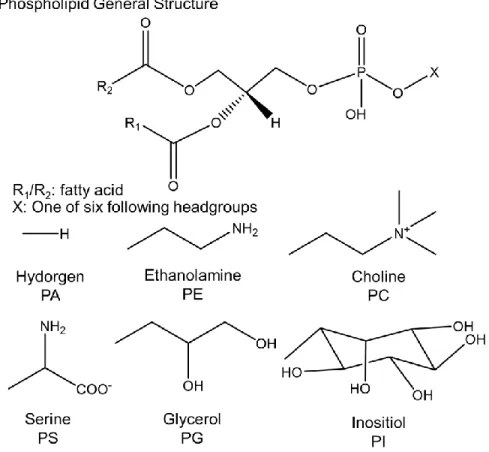
Phospholipids (PLs) are amphiphilic molecules composed of a hydrophobic diglyceride fatty acid tail and one of six possible polar head groups that determine their subclass. Phosphatidylcholines (PCs) represent the major constituents of the cell’s lipid bilayer130, 160 and is
therefore highly abundant in biological systems. The other subclasses, namely phosphoethanolamines (PEs), phosphatidylserines (PSs), phosphotidic acids (PAs), and phosphoinositides (PIs) can also be found on the cellular membrane and provide more specialized signalling functions161-163. Their structures are shown in Figure 1-10.
PLs were first detected by MALDI in 1995 by Harvey123 with 2,5-DHB. In this work, Harvey
investigated the ionization of all PL classes in both positive and negative ion mode. While this work demonstrated the ability to detect all PLs in positive ion mode, later work by Petković et al. revealed that in complex mixtures such as a cell extract, PCs dominate the positive spectra125. This
is of concern for IMS because the PLs cannot be readily separated prior to analysis except with ion mobility, which limits the acquisition speed and worsens the detection limit. Thankfully, the discovery of 9-AA for negative ion mode detection allowed for the detection of the remaining species, such as PIs, PAs and PSs, without ion suppression from PCs142. However, this meant that
two samples are needed to obtain the full PL profile, which pose technical and sometimes practical challenges for IMS experiments.
This problem was solved with the advent of dual-polarity matrices such as 1,5-DAN60
developed in our laboratory and more recently in a different group, luminol164. Beyond the obvious
benefit of only needing one matrix, it is also possible to conduct dual-polarity experiments on a single tissue section to obtain the global phospholipid profile. This can be achieved by artificially setting an offset in both the x and y dimension that is equivalent to half of the spatial resolution to avoid resampling the same tissue surface60, 165. In certain cases, it is also possible to conduct
dual-Figure 1-10: The Six Phospholipid Classes and Their Headgroups. Phospholipids share the same general structure shown and can have six different head groups: hydrogen (PA), ethanolamine (PE), choline (PC), serine (PS), glycerol (PG) and inositol (PI).
polarity IMS results without an offset by minimizing the number of laser shots per imaging coordinate and therefore conserving enough samples for subsequent analyses166. This approach can
attain a resolution as high as 10 µm, though this method has yet to be demonstrated by other researchers166.
PL confirmation by MS/MS are possible thanks to their characteristic fragmentation from their headgroup. Nearly all headgroups provide unique m/z values upon fragmentation either in positive or negative ion mode167. The remaining mass after removal of the headgroup, as well as the parent
ion mass, provide information on the DG. MS3 can provide further details on the DG to discern the
fatty acid tails while specific derivatization approaches can help identify the double-bond position168, 169. However, in situations where no information about the fatty acid can be derived, a
summed value representing the overall fatty acid length and double bond count is provided. For example, PC (34:2) is preferred over PC (18:1/16:1), since the former denotes a DG of a total of 34 carbons and two double bonds, rather than two FA, one of C18:1 and the other C16:1.
1.2.2.3. IMS of Phospholipids on Drosophila
MALDI IMS of PLs have been successfully conducted on a wide variety of samples beyond mammalian tissue. These include black rice seeds170, cotton seeds171, mosquitoes172 and
Drosophila173. Also referred to as the common fruit fly, Drosophila has, for more than a century,
revolutionized our understanding of biological development and the inheritance of genetic disorders174. Their high genetic resemblance with mammalian systems175, relative ease in inducing
and controlling genetic mutations176, and their short reproductive cycle177 have continued to attract
researchers to conduct important genetic and drug screening tests on them before advancing to more complex and expensive models178. MALDI IMS is a potential approach that can help provide
information on the drug localization and other metabolic changes in the fly organs.
example was that of Urban et al. in 2011 which investigated the phospholipid distribution of a dissected fly organ, namely the egg chamber, by MALDI IMS173. This was followed by two other
studies that revealed organ-specific distribution of phospholipids, fatty acids and other metabolites in the organism179, 180. These publications also investigated the embedding media and organic
washes to help with the cryosectioning of such a fragile organism179, 180. While no revolutionary
phospholipid species were revealed during their work, these feasibility studies remind researchers of the possibility to conduct IMS studies of fruit flies.
1.2.2.4. IMS of Gangliosides
Gangliosides are glycosphingolipids marked by one or more sialic acid residues attached to the galactose moiety of the sugar backbone181. Highly expressed in neural cells of the grey matter,
these signalling molecules are most abundant on the outer leaflet of the cellular membrane of the lipid raft domain182. All gangliosides are synthesized from lactosylceramide (LacCer) in a
step-wise manner through a series of enzymes into four different series183, as shown in Figure 1-11.
Gangliosides are named based on the number and position of sialic acid residues, the length of the sugar backbone, and, if known, the length of the fatty acid chains on the ceramide. GA, GM, GD, GT, GQ and GP represent zero to five sialic acid residues, respectively. This is followed by a number 1, 2 or 3, which signifies the length of the sugar backbone, where the smallest number represents the longest backbone. Positional isomers of sialic acid residues are indicated by a lower- case letter following the number, which generally fall within the series. The fatty acid chain nomenclature follows those of the FAs. As such, the ganglioside GD1a (d18:1/18:0) is a ganglioside of series a containing two sialic acid residues, a full sugar backbone, and a ceramide with a sphingosine and a fatty acid chain of 18. While it is generally accepted that ceramides are composed of a sphingosine and a fatty acid, in cases where no MS/MS data is present, the fatty acid information is condensed, for example, (d36:1) instead of (d18:1/18:0).
Unsurprisingly, IMS of gangliosides are mostly focused on the brain184, with studies revolving
around neurodegenerative diseases such as Alzheimer’s134 and Parkinson’s185 and traumatic events
such as stroke186, 187. Most are focused on the a- and b-series gangliosides, the most abundant in
this organ. Novel matrices188-191, derivatizations192, 193, high pressure systems194, 195 and ion
Figure 1-11: Ganglioside Synthesis Pathway. Gangliosides are synthesized from and degraded into LacCer with the help of specific enzymes for each addition or removal of a sugar moiety. The a and b series gangliosides are the most abundant in the brain and most widely studied in IMS.
mobility196-198 have also been proposed to lower the detection limit and increase the stability of
these molecules during analysis, some of which have been applied for IMS applications.
MS/MS determination of gangliosides is most certainly characterized by the sialic acid residue, which readily fragments in the MALDI experiment to provide a strong signal at m/z 290.1194. This
is followed by the sequential losses of the sugar backbone, leaving only the ceramide. In cases where multiple sialic acids are present, MS/MS data will reveal the sequential loss of these residues before fragmentation from the sugar backbone. Examples can be seen in Supplemental Information of Chapter 3.
1.2.3. Advantages and Drawbacks of MALDI IMS
IMS is a label-free technique capable of detecting hundreds of biomolecules in one single analysis. By comparison, immunohistochemistry (IHC) usually target one molecule of interest, while molecular fluorescent probes can at most provide results for three molecules of interest from the same tissue section199, 200. Although more recent techniques such as co-detection by indexing
(CODEX), a fluorescent multiplex immunohistochemistry, and imaging mass cytometry (IMC) have overcome this limitation, the former achieves high multiplexing through multiple staining cycles that provide images of three molecules each time, while the latter is limited to around the forty available rare metal elements201, 202. As such, the high abundance of analytes detected and the
untargeted nature of MALDI IMS continue to make it an ideal tool for biomarker discovery203, 204.
IMS is also uniquely positioned as the sole method that can provide localization of individual lipid species, such as PLs, GGs and TAGs. In the case of gangliosides, for example, the IHC antibody recognizes the oligosaccharide moiety, and thus cannot differentiate between the long chain and short chain version of the same ganglioside205. MALDI IMS also enabled the localization of drug
kHz laser technology and auto laser focus, MALDI IMS data acquisition has reduced significantly, capable of acquiring a coronal rat brain section at 50 µm spatial resolution in approximately 45 mins206. Continued advances in ion mobility coupled to IMS207, 208 also promises to revolutionize
the capabilities of this technique.
Of course, IMS has its shortcomings. High signal intensity in IMS is not directly correlated with its absolute abundance. Rather, species with greater ionization efficiencies will be more abundant and suppress other species present in the same local environment. This ion suppression effect also greatly diminishes the dynamic range, particularly for MALDI-TOF IMS where no analyte separation occurs209. The matrix-analyte crystals also play a critical role in influencing the
ionization event, sometimes leading to variability in signal intensity of the same species across one sample210. Because of these limitations, in most situations, IMS can only be appreciated as a
semi-quantitative approach. IMS also falls short of the spatial resolution attainable by fluorescence and IHC. IMS operates mostly at the micron level. While submicron MALDI IMS has been demonstrated211, the spatial resolution is limited by the laser focus size and the dramatic loss in
sensitivity due to the small irradiation surface. SIMS imaging can readily produce images at the nanometer scale212, but is highly limited in mass range. Nonetheless, advanced sample preparation
techniques have overcome some issues in preferential ionization, while technological advancements continue to push the limits of spatial resolution and improve overall dynamic range213.
1.2.4. MALDI IMS Sample Preparation
1.2.4.1. Thin Tissue SectionsA standard MALDI IMS experiment conducted on thin tissue sections can be divided into four parts: sample processing and sectioning, matrix deposition, data acquisition and data analysis,
as shown in Figure 1-12:
First, the sample is sectioned into micrometer thicknesses. This is conducted in a cryotome for fresh frozen samples, or a microtome for FFPE samples. The thickness depends greatly on the sample, though for mammalian tissues, it is generally between 10-20 µm for fresh frozen samples214 and ~5 µm for FFPE samples111. The sections are then typically mounted on indium-tin
oxide (ITO) conductive glass slides and left to desiccate at room temperature. After desiccation, a series of washes or sample preparation protocols may be required before matrix deposition. For example, FFPE samples need to be deparaffinated, rehydrated, antigen retrieved and enzymatically digested111, while a series of organic washes are necessary for high quality protein studies214. Some
washes have been proposed to improve the detection of certain phospholipids in negative ion mode and gangliosides215, though minimal sample preparation is suggested to minimize lipid
delocalization. Once the protocols are completed, a homogeneous layer of matrix is deposited onto Figure 1-12: MALDI IMS Workflow. 1) Tissue samples are sectioned and left to desiccate. This step can be followed by a series of washing protocols to enhance analyte signal. 2) Matrix is homogeneously deposited onto the section. Several matrix deposition approaches are available. 3) Samples are introduced into the instrument for data acquisition. 4) Data is visualized and analyzed on a computer using specialized software.