The Market for Reinsurance
43
0
0
Texte intégral
(2) CIRANO Le CIRANO est un organisme sans but lucratif constitué en vertu de la Loi des compagnies du Québec. Le financement de son infrastructure et de ses activités de recherche provient des cotisations de ses organisations-membres, d’une subvention d’infrastructure du Ministère du Développement économique et régional et de la Recherche, de même que des subventions et mandats obtenus par ses équipes de recherche. CIRANO is a private non-profit organization incorporated under the Québec Companies Act. Its infrastructure and research activities are funded through fees paid by member organizations, an infrastructure grant from the Ministère du Développement économique et régional et de la Recherche, and grants and research mandates obtained by its research teams. Les partenaires du CIRANO Partenaire majeur Ministère de l'Enseignement supérieur, de la Recherche, de la Science et de la Technologie Partenaires corporatifs Autorité des marchés financiers Banque de développement du Canada Banque du Canada Banque Laurentienne du Canada Banque Nationale du Canada Banque Scotia Bell Canada BMO Groupe financier Caisse de dépôt et placement du Québec Fédération des caisses Desjardins du Québec Financière Sun Life, Québec Gaz Métro Hydro-Québec Industrie Canada Investissements PSP Ministère des Finances du Québec Power Corporation du Canada Rio Tinto Alcan State Street Global Advisors Transat A.T. Ville de Montréal Partenaires universitaires École Polytechnique de Montréal HEC Montréal McGill University Université Concordia Université de Montréal Université de Sherbrooke Université du Québec Université du Québec à Montréal Université Laval Le CIRANO collabore avec de nombreux centres et chaires de recherche universitaires dont on peut consulter la liste sur son site web. Les cahiers de la série scientifique (CS) visent à rendre accessibles des résultats de recherche effectuée au CIRANO afin de susciter échanges et commentaires. Ces cahiers sont écrits dans le style des publications scientifiques. Les idées et les opinions émises sont sous l’unique responsabilité des auteurs et ne représentent pas nécessairement les positions du CIRANO ou de ses partenaires. This paper presents research carried out at CIRANO and aims at encouraging discussion and comment. The observations and viewpoints expressed are the sole responsibility of the authors. They do not necessarily represent positions of CIRANO or its partners.. ISSN 1198-8177. Partenaire financier.
(3) The Market for Reinsurance* M. Martin Boyer†, Théodora Dupont-Courtade‡. Résumé/Abstract Using a unique proprietary data set of primary insurers and reinsurers, we analyze the structure of the reinsurance market. The data set, which spans six years, contains quotes for different reinsurance layers, for different treaties, for different clients, and for different lines of business. There are in fact close to 20,000 quotes for close to 1,000 reinsurance treaties, 70% of which have more than one layer. This is the first study that documents the actual structure of the global reinsurance market using actual quotes, and not only the wining quote, for a large number of layers of a large number of reinsurance treaties. We find that reinsurance treaties have generally become more complex over the years. We also find an interesting linear pattern is the distribution of the quotes by line of insurance. Mots clés/Keywords : Reinsurance, reinsurance tranches, risk management, market structure. Codes JEL : G34, G22.. *. This research was sponsored by SSHRC-Canada. The continuing financial support of Cirano is also gratefully acknowledged. † CEFA Professor of Finance and Insurance and Cirano Fellow, Department of Finance, HEC Montréal (Université de Montréal). 3000, chemin de la Côte-Sainte-Catherine, Montréal QC, H3T 2A7 Canada; [email protected]. ‡ Paris School of Economics (Université Paris 1 Panthéon-Sorbonne) 106-112, boulevard de l’Hôpital, 75647, Paris cedex 13. [email protected].
(4) 1. Introduction. Put simply, the reinsurance market is the insurance market for insurance companies. But in contrast to the primary insurance market, contractual arrangements in the reinsurance market are less standardized, more global and involve larger amounts of risks insured per contract. With this transfer of risk comes, of course, a premium that the primary insurer must pay to have the option to pass those losses along to the reinsurers. The ”reinsurance industry”, whereby primary insurers transfer financial responsibility of portfolios of insured exposure to reinsurance firms that operate on a global scale, is in fact a multi-billion dollar industry in terms of premiums, and over trillion dollars in terms of loss exposure. The gross premiums written of reinsurance amounted to about 186 billion dollars in 2005, and grew to 215 billion dollars in 2010 despite the financial crisis, a growth of approximately 3% per year. The main reason why insurers purchase reinsurance protection, and thus remove the financial responsibility of bearing the risk they accepted to assume in the first place, is to free economic and risk capital that had to be put aside to eventually pay for losses that may arise. For many primary insurers this risk capital is often more efficiently used to induce an increase of their sales on the primary market than being kept in reserves to pay for future potential losses. Freeing economic and risk capital also allows the insurer to increase the quality of the service it gives to policyholders since managers spend less time worrying about capital adequacy and solvency challenges and more time focusing on making the policyholders’ experience more palatable. Reinsurance allows a primary insurer to reduce its probability of bankruptcy, which means that its policyholder rating and credit rating remain high, which at the same time reduces its cost of financing and increases the policyholders’ willingness-to-pay for this product since they will feel more certain that money will be there when they come to collect (see Zimmer et al., 2012). The economic importance of the reinsurance market transcends the pure insurer-to-reinsurer transaction. The health (or lack thereof) of the reinsurance market has non trivial repercussions on the primary market where individuals and firms seek to find a financial entity to which they would like to put the losses they are exposed to. A case in point is that Berger et al. (1992), Born and Viscusi (2006) and Meier and Outreville (2006) have argued that shocks to the reinsurance market have a direct impact on the availability and pricing of primary insurance contracts. Furthermore, as we stated earlier, the reinsurance market is a way for primary insurers to raise capital at a lower cost than having to access capital markets directly (see Powell and Sommer, 2007; Mayers and Smith, 1990) which offers a potential for a reduction in the premiums on the primary market. Being global in design and economic contribution, and being populated by only financially sophisticated players,. 3.
(5) one could argue that the reinsurance market is one of the most competitive financial markets in the world. Despite the economic, social and political importance of the reinsurance market that may appear quite removed from the policyholder’s perspective, the reinsurance market remains relatively complex and opaque in its structure, operations and competitiveness (Cummins and Trainar, 2009). This opacity is surprising given the number and the size of the transactions that occur annually, as well as the maturity of this market that is centuries old (According to the Society of Actuaries, the first contract dates to 1370 in Genoa, whereas the term itself appeared in 1658 in Germany). In contrast, Credit Default Swaps, which can be almost considered like insurance contracts since it pays out in the event of default by an obligor, are relatively young financial products with a lot of information already available. One of the possible reasons why the reinsurance market is so opaque is that it is essentially an over-the-counter financial market where transactions do not occur in the public eye. This means, amongst other things, that transactions are governed by many intangible features, such as the reputation of the players and their capital adequacy for the type of risk for which reinsurance is saught, that are important to the insitutions that are part of the transaction but are hardly quantifiable. It is therefore not obvious that a primary insurer will reinsure with the reinsurer that quotes the lowest price, inasmuch as it is not automatic for a policyholder to go with the insurance company that quotes the lowest price. In other words, it is very possible that the counter party risk in the insurance/reinsurance relationship is so large that participants want to know and make sure that the reinsurer will be there financially in case their capital is needed. Another reason that could explain the opacity of the reinsurance market is that the underlying risks are very much different from one primary insurer to the next, and from one market to the next. This means that even if two reinsurance programs share the same name for two primary insurers (or even for the same insurer, but in different geographical areas or in different time periods), the portfolio of risks are not necessarily the same. Consequently a reinsurer, that is interested in covering the losses of a given portfolio of loss exposures, needs to asses the actual risk (i.e., the distribution of losses in the region for which the reinsurer is financially responsible) that such a program entails. In a sense, reinsurance contracts are more like collateralized debt obligations than credit default swaps. The goal of this paper is to examine and analyze the reinsurance market in order to decrease its opacity and to increase our understanding of its determinant features. To do so, we were given access to an unique and proprietary dataset that allows us to examine and analyze the structure of the global reinsurance market. The data set spans six years (2004 through 2010) and contains the. 4.
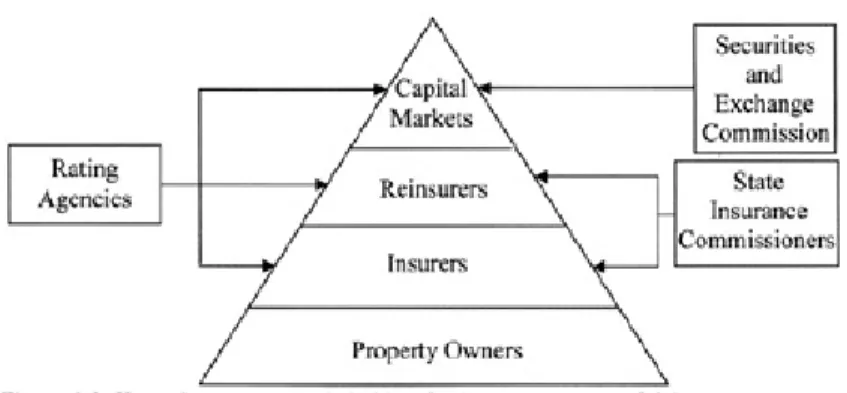
(6) quotes for different reinsurance layers, for different treaties, for different clients, and for different lines of business. To our knowledge, this is the first study that documents the actual structure of the global reinsurance market using real quotes for reinsurance treaty layers, in contrast to other studies on the reinsurance market that use only the winning quote or, as Froot (2001) say: ”that apply actual reinsurance transaction data” (p. 534). The proprietary dataset, which we generously obtained from an important reinsurance market participant, has been anonymized to remove all possibilities of identifying the source of the information and the names of the market players. The next section of the paper reviews the main contributions to the reinsurance market literature. Section 3 presents a primer on the reinsurance market to highlights its economic importance and the special terminology that is used by participants in that market. Section 4 describes the data and presents some examples of reinsurance treaties. We analyze and discuss particular features of the reinsurance market in Section 5. In particular, we present chosen reinsurance contract structures, and we propose a study of the specific determinants of the reinsurance premiums. Finally, we conclude in Section 6 by offering avenues of possible future research on the global reinsurance market that could be done with the original proprietary dataset the we have.. 2. Literature. 2.1. The market for reinsurance and its characteristics. The reinsurance market is complex and global in its structure. It also shows specificities that transcend any insurer-to-reinsurer relationship or single transaction. Compared to other over-the counter financial markets, the reinsurance market is particularly opaque, which has led Cummins and Trainar (2009) to judge this market difficult to examine and to study appropriately a fortiori. The foundations of reinsurance include the transfer, the diversification and the pooling of risks. In this sense, reinsurance decisions can be seen as a combination of three decision making processes: risk sharing, risk management, and financial structure. Reinsurance contracts allow for the transferring of risks that insurers cannot or do not want to bear to more global actors. These contracts are based on the balance sheets of insurers, since reinsurance is a way for insurers to reduce the amount of capital they hold and to therefore increase their underwriting capacity. Insurers and Reinsurers can also use financial markets as risk transfer tool (see figure 1). In this sense, and because of its ability to reach to the capital pool of global financial markets, the (re)insurance industry is well positioned to absorb large losses (Cummins et al., 2002). This is an essential feature of any insurance market when one is preoccupied by the well-being of policyholders. Moreover, capital adequacy of the insurance industry (that is, having. 5.
(7) Figure 1: Key private sector stakeholders in the management of risk Source: Grossi and Kunreuther (2005). enough capital to pay for the policyholders’ losses) is one of the most important concerns of public policymakers and insurance regulators. Irrespective of the reinsurance ability to access the global financial market, underwriting expertise remains the most central feature of any insurance transaction, be it the insurer’s ability to assess a policyholder’s risk type, or a reinsurers ability to assess a primary insurer’s portfolio of risks. As the need for correctly assessing the risks involved is essential when dealing with reinsurance treaties, one is confronted with the Arrow (1971) question of the insurability. Put succinctly, and using the definition in Grossi and Kunreuther (2005), we can define a risk as insurable if it can be identified and quantified, even if both can only by partially done. Moreover, risk identification and quantification must lead to the setting of an insurance premium. An underwriter’s challenge when dealing with complicated risks is that a significant level of uncertainty regarding the occurrence and level of future losses exists. This challenge is obviously much more important in the case of catastrophic events (Kunreuther and Michel-Kerjan, 2009), thus making an underwriter’s job of risk assessment even more difficult. As a consequence, and also because the insurance/reinsurance market is incomplete by construction, reinsurers must include a risk premium in their price schedule, just as investment bankers must include a risk premium when valuing financial derivatives when the underlying security is not traded (see Stentoft, 2004). Finally, the insurer’s ceded premiums need to be accepted by the reinsurer in order for a market to exist (Shimpi, 1997). Reinsurers possess a high technical expertise on risk assessment, which allows them to see through the opacity of insurers’ book of business. They are able to analyze the risks insurers are willing to transfer in order to set a premium. It can be comparable with an audit of underwritten risks as well as an audit of the quality of the insurers’ risk management strategy. This expertise occurs because of long and often repeated relationships between the reinsurer and the primary. 6.
(8) insurer, even if multiple-year contracts are unusual in this market (see Jean-Baptiste and Santomero, 2000, and Boyer and Gobert, 2008). It naturally follows that reputation and trust amongst the participants are factors that are essential for the reinsurance market to function properly. That is perhaps one of the reasons why Plantin (2005) refers to reinsurers as ”insiders”, since because they have more information about the risks than outside investors. One last important aspect of the close relationship between a primary insurer and its reinsurer is that investors may see the presence of a reinsurer as a source of capital and protection as a positive signal as to the quality of the primary insurer’s underwriting and management ability. The reason why the presence of a reinsurer may be seen as positive signal is that reinsurers have an implicit monitoring role of the primary insurer’s activities. This monitoring role reduces informational problems that could exist either for the primary insurer internally, or with respect to outside investors and potential policyholders (Jean-Baptiste and Santomero, 2000; Doherty and Smetters, 2002; Plantin, 2005). In that sense, the presence of a reinsurer could be compared to the monitoring role of credit rating agencies. Based on their experience, expertise and extensive presence on the global insurance market, reinsurers are able to provide risk management advise to primary insurers. Also, and because they are directly involved with the risks they accept, reinsurers have a direct monetary incentive to design efficient contracts. For example, a branch that is increasingly difficult to reinsure could indicates a structural problem of the insurer.. 2.2. Reinsurance: from risk sharing to risk management decisions. The economic role and purpose of reinsurance can be studied along two important theoretical frameworks. The first one refers to the seminal work of Borch (1962), who considers reinsurance as a risk sharing decision among risk-averse agents. Borch (1962) uses an expected utility theory and a game theoretic approach to analyze the Pareto optimal amount of reinsurance. He predicts that each reinsurer should hold a proportional share of the market portfolio of reinsurance contracts; a concept similar to that of the Capital asset pricing model of Sharpe (1964) and Lintner (1965). This means that losses will be correlated amongst reinsurers. Following Borch’s theorem, Doherty and Smetters (2005) and Zhang and Siu (2009) have made further advances in order to include behaviors such as ambiguity aversion and moral hazard in the optimal reinsurance portfolio decision process. Unfortunately, predictions associated with the risk sharing approach do not seem to match very well with actual reinsurance decisions (see Froot, 2001). We can therefore conclude that as much as risk sharing is a very appealing reason for the existence of a reinsurance market, it is in no way sufficient to explain the primary insurers’ decision to reinsure their exposure. The second theoretical framework along which the role of reinsurance has been studied by. 7.
(9) insurance economists is to consider reinsurance as a corporate risk management tool. The seminal paper of Mayers and Smith (1990) studies the determinants of reinsurance purchases by property and casualty insurance companies. They equate the demand for reinsurance to the demand for risk management by any non-financial firm. They show that the ownership structure matters in the reinsurance decisions so that more ownership concentrated firms purchase more reinsurance. Furthermore, insurer size and default risk is highly correlated with the demand for reinsurance. Less diversified firms across lines-of business or geographically are found to purchase less reinsurance, which contradicts the theoretical result of Borch (1962). The fact that geographic and business concentration reduces the demand for reinsurance can, however, be explained by the technical expertise and the monitoring role that reinsurers play in the economy (Plantin, 2005). To cover all possible insurance claims (Merton and Perold, 1993), an insurance company’s balance sheet is composed of both internal risk capital (such as equity and bond investors) and external risk capital (such as reinsurance contracts). Given that Zanjani (2002) has shown that capital costs are an important component of reinsurance pricing, it follows that the benefits of reinsurance depend on the relative costs of each type of risk capital. Culp and O’Donnell (2009) explain that the external risk capital is often less expensive than internal one, even if it does not look like so, in the sense that it provides insurance companies with cash to cover policy claims ex ante and it is more transparent. Powell and Sommer (2007) propose that the opposite is more likely to be true because of the important presence of information asymmetry and agency costs in the insurer’s main area of operations. Information asymmetries are indeed important considerations when looking at insurance arrangements. Agency theory brings to light problems of moral hazard and adverse selection that are studied a lot in the insurance and reinsurance markets (Cummins and Tennyson, 1996; Chiappori and Salani´e, 2000; Abbring et al., 2003; Dionne et al., 2004; Doherty and Smetters, 2005). According to Fazzari et al. (1988), the cost of capital depends on the amount of asymmetry between providers and users of capital. Having a long run relationship with a reinsurer can make the reinsurance premiums decrease. These long run relationships do not need to be codified in multiple year contracts, but can result from repeated contracts over the years. In this way, the information is revealed over time and, after a number of trades, the reinsurance contract gets closer to the optimum (Jean Baptiste and Santomero, 2000; Boyer and Gobert, 2008). Insurers, and reinsurers for the great majority of them, use financial markets in order to raise capital. According to Sommer (1992) and Mayers and Smith (1990), reinsurance is less costly than capital markets. However, securitization can be considered as a complement to reinsurance according to Cummins and Trainar (2008). Indeed, Cat Bonds is an interesting tool that hedge catastrophic risks in decreasing default risk of reinsurers (replaced by basis risk), moral hazard, and. 8.
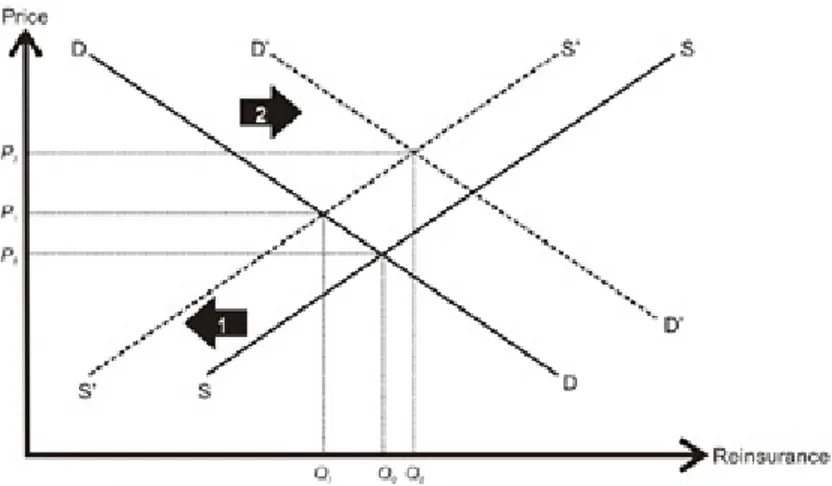
(10) reinsurance prices (Lee and Yu, 2007). However it has not been very successful in the industry. The regulatory requirements stating a capacity level for insurance companies do not include securitization in the insurer’ balance sheet, which explains the relatively low attractiveness of Cat Bonds for insurers (Han and Lai, 1997). Securitization and reinsurance do not have the same economic function: The securitization appears as an intermediation tool, while reinsurance is better explained as warehousing of risk too (Cummins et al, 2008; Cummins and Trainar, 2009). In particular, Cummins et al. (2008) examination of the determinants of reinsurance offers new explanation to the findings of Froot (2001) whereby reinsurance premiums appear much higher than their actuarially fair price. The results in Cummins et al. (2008) suggest that reinsurance premiums are not only explained by the underwritten risk, but also by the amount of capital needed and by informational problems (i.e., the agency costs) that plague the insurer/reinsurer relationship. Furthermore, insurers that have less expertise are willing to pay higher premium in order to gain access to the reinsurers’ technical expertise. And although it is found that reinsurance is indeed quite costly for insurers, it still remains a very useful devise since it reduces the primary insurer’s loss ratio volatility, and it increases their underwriting capacity. This means that purchasing a appropriate amount of reinsurance diminishes the default risk of the primary insurers since it protects them against extreme events. That is possibly why Garven and Lamm-Tennant (2003) found that insurers with high financial leverage demand more reinsurance. Another challenge that primary insurers face is with respect to the credit risk of the reinsurer. Indeed, insurers should want to diversify their protection against extreme events across reinsurers in order to mutualize the default risk of the reinsurers. The implication of such a need for high credit-worthy reinsurers is that insolvency-averse (i.e., risk-averse) primary insurers are willing to pay a higher premium for a contract that is underwritten by a low default-risk reinsurer (Sommer, 1996). Reinsurers diversify their risks by reinsuring risks from all over the world and from different lines of business, which Cummins and Trainar (2009) attribute to the fact that reinsurance is optimal when dealing with independent and uncorrelated risks. The law of large numbers does not hold, however, for extreme and correlated events like natural catastrophes. For extreme events, the cost of capital can become very expensive and the reinsurance premium very high (see for instance Ibragimov et al., 2009, Ibragimov and Walden, 2007, and Boyer and Nyce, 2012). This means that insurance securitization (see Cummins and Trainar, 2009, and Albertini and Barrieu, 2009) is needed to transfer correlated high-consequences events. Lane (2000) states that both reinsurance premiums and Cat Bond prices should be related to credit prices (like corporate bonds) because these assets contain the assessment of the frequency and the severity of risks. With the recent financial crisis, reinsurance premiums increased and insurance capacity de-. 9.
(11) Figure 2: Reinsurance pricind and the credit crisis Source: Culp and O’Donnell (2009). creased drastically (Culp and O’Donnell, 2009). As for the liability crisis of the mid-1980s (Berger et al., 1992), one can see the recent trends in reinsurance prices and capacity as the result of a large negative shock on reinsurance supply and of a positive shock on reinsurance demand (see figure 2). This is similar of what is observed after a large claim event. The difference in the recent credit crisis is that it became also a financial system confidence crisis in which reinsurers became reluctant to offer capital and affect their reputation of reinsuring primary insurers that were on the brink of bankruptcy (and thus perhaps betting for resurrection by accepting to insurer riskier clients). And as the cost to reinsure increased during the confidence crisis, reinsurance premiums rose. The trickled down impact to the primary insurance market was a increase in premiums either because the primary insurers had to pay more for their reinsurance protection, or because the primary insurer could not find any reinsurer willing to accept its business, thus raising the primary insurer’s cost of bearing risk. Berger et al. (1992), Born and Viscusi (2006) and Meier and Outreville (2006) present convincing evidence that shocks to the reinsurance market can have a direct impact on the availability and pricing of primary insurance contracts. In a similar fashion, Myers and Majluf (1984) argue that suboptimal reinsurance coverage can lead to higher premiums for the consumers.. 2.3. Tranching and Pooling in Reinsurance. As highlighted in Boyer and Nyce (2012), reinsurance contracts are often subdivided into tranches that allow reinsurers to obtain an exposure whereby the maximum possible loss is well-defined. That is one of the reasons why non proportional reinsurance contracts are the most common type of contracts between an insurer and a reinsurer. This means that reinsurance contracts are sold 10.
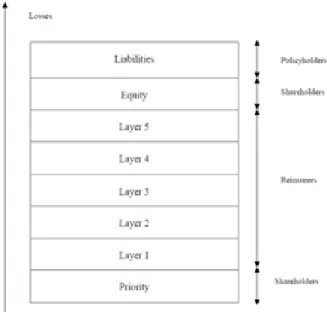
(12) in layers, also know as tranches (Hurlimann, 2003; Plantin, 2003; Ladoucette and Teugels, 2006). Furthermore, most prudential regulations reduce the reinsurance purchases from the minimum capital requirement (Plantin, 2005). Tranches of reinsurance contracts can be considered as financial agreements akin to tranches of collateralized debt obligations (CDO). The similarities between CDO tranches and reinsurance tranches was made clear in Plantin (2003) who analyzed the tranching of reinsurance in comparison to CDO layers. CDO tranches are split into several tranches with specific seniorities (from rated notes to un-rated notes, also called the equity tranche or the toxic waste tranche). Buyers of CDO can have various level of risk sophistication (i.e. their ability to assess the credit risk of the obligors varies) and various willingness to be exposed to credit risk. It appears that more risk-sophisticated institutions buy tranches with low seniority because they are better able to assess properly the risk involved, so that more senior tranches are either retained by the CDO originator or purchased by more risk averse or less sophisticated institutions. The reason why Plantin (2003) is able to draw an intelligent comparison between tranching in reinsurance and in CDO is that primary insurers, like CDO originators, sell their claims in layers to reinsurers on the reinsurance market. The layering of reinsurance contracts (see figure 3) is designed so that the primary insurer bears the first losses up to a retention (first priority level), which plays the same role as the equity tranche in CDO. This first retention level is structured similarly to a deductible in order to reduce transaction costs and the cost associated with moral hazard. Reinsurers assume the risk of the superior layers, as represented as Layers 1 through Layer 5 in figure 3. Once all layers have been exhausted, it is the turn of the insurer’s shareholders and to assume the excess losses up to the total value of the firm’s equity. If the losses are larger than the sum of all the reinsured layers, and of the primary insurer’s capital, then the remaining losses will be borne by the policyholders themselves since the insurer will be in a state of technical bankruptcy. As an alternative to letting the policyholders assume losses in those higher tranches, local, national and supranational governments can decide to step in as the reinsurer of last resort (see Kessler, 2008; Michel-Kerjan and Wise, 2012; and Boyer and Nyce, 2013). Because of their long-time expertise, experience and worldwide risk mutualization, more sophisticated reinsurers have typically accepted to bare the risk of losses in higher layers. According to Plantin (2005), tranching is a way to appeal at the same time to sophisticated and informed investors, and to comfort unsophisticated and uninformed ones (see also Gorton and Pennacchi, 1990; and Boot and Thakor, 1993). This then raises the question of why and when should tranching be present. According to Axelson (1999, 2007), the pooling of assets is efficient if there are a large number. 11.
(13) Figure 3: Non proportional reinsurance Source: Plantin (2003). of individual assets compared to the number of potential investors so that each investor is then responsible for a proportion of all losses. This reduces the potential for adverse selection problems. On the opposite, if the number of potential investors is large, then tranching is optimal. According to De Marzo (2005), tranching is efficient if the issuer (i.e., the primary insurer in the insurance/reinsurance market) has superior information about the value of its assets (i.e., the pool of risks). Furthermore, if the risks are not highly correlated, using layers allows for the diversification of risk at the same time as it preserves the information structure. If the issuer cannot precisely assess their risks, however, pooling prevents the better informed investors (in our case the reinsurers) from selecting the best layers. The consequence of this dynamic is that the equilibrium between pooling and/or tranching depends essentially on the distribution of private information in the market and on the difference in the different players’ information. Moreover, if tranching is done properly, Brennan et al. (2009) have shown that tranching can create marketing gains, and that these gains increase in the number of tranches. A case in point is the study of Cuchra and Jenkinson (2005). They analyzed the number of tranches in European bond secutities and found that assets with high information asymmetry tend to have more tranches with different ratings. No doubt that an important level of information asymmetry exists and that each actor of the reinsurance market uses its own risk assessment model in order either to determine the minimum reinsurance premium against which a reinsurer is willing to assume the risk, or to determine the. 12.
(14) maximum reinsurance premium that the primary insurer is willing to pay to get rid of the liability. Models differ from reinsurer to reinsurer. They depend amongst other things on the pool of risk that the reinsurer is already responsible for and on the reinsurer’s proprietary underwriting technology. This heterogeneity across insurers can, of course, lead to very heterogeneous prices. The situation that is observed on the resinsurance market is not much different than the situation on the mortgagebacked securities auction market. Bernardo and Cornell (1997) find highly variable bids on the mortgage-backed securities auctions market as the winning bid exceeds the median bid by an average of over 17%. The transposition of the results found in capital makets to the reinsurance industry is not trivial. Nevertheless, Biffis and Blake (2010) examine the securitization and tranching of longevity risks under asymmetric information using a signaling model. In a model where insurers and reinsurers are expert in assessing the risk whereas regular investors are uninformed they show that retention levels and the securitization of risks allow to reduce the impact of asymmetric information (see also Cowley and Cummins, 2005). One can then presume that there are important benefits to tranching and pooling, which means that the basic structure of the reinsurance market should reflect these specificities.. 3. A primer on the reinsurance market. The global reinsurance is populated by important players that are large financial institutions. That is perhaps the most important specificity of that market. There is also a vocabulary that is specific to the reinsurance market that has not translated to capital markets for any number of reasons. A case in point is the fact that the contract between a primary insurance company and a reinsurer is called a reinsurance treaty. This treaty is purchased by a primary insurer (also called the ceding company) to a specialist reinsurance company or to another insurance company. The type of reinsurance contract is also specific to the type of risk that the primary insurer is trying to reinsurer. For instance, property and casualty reinsurance contracts generally take the form of excess-of-loss treaty. In such a contract the reinsurer is responsible for losses that are in excess of some amount (called the priority) up until some other amount (called the limit). A reinsurance layer is therefore defined as a limit exceeding a priority (written ”limit XS priority”). Of course, and following the previous discussion, a reinsurance treaty can have several layers on top of each other, as well as layers that are parallel to each other (see Boyer and Nyce, 2012, for an industrial organisation model of the reinsurance market). In terms of notation, an ”excess of loss” treaty will take the form of L XS P . This means that the potential liability for the reinsurer has the following function : M in[M ax(x − P ; 0); L]. 13.
(15) Financiers will recognize this payoff function as a bull spread on underlying security x, in which the derivative instrument pays off when x ∈ [P, P + L]. One may then say that reinsurer is ”short the bull spread” since it needs to pay out an amount equal to x − P if the underlyins security is worth more than P , up to a maximum of L. As we know, being short a bull spread is similar to having sold a call option with a strike price P , and purchasing a call option with strike price P + L. In the reinsurance market, the terms used are slightly different than in the financial derivatives market. We will then have • x is the loss associated with an unfortunate event (similar to the concept of loss given defaut in fixed income security analysis), • P is the priority, • L is the limit; • L + P is the ceiling of the treaty. The reinsurer intervenes if the event’s loss is superior to P . The reinsurer then indemnifies the primary insurer for all losses greater than P, subject to a deductible equal to P. The maximum the reinsurer can be liable for is L. Thus, the term L XS P means that the reinsurer pays no more than L on the part of the cost that exceeds P . If the total cost of an event exceeds L + P , then it is no longer that reinsurer’s responsibility, as the liability falls back to the primary insurer, unless of course the primary insurer found another reinsurer to cover the losses greater than L + P . ’s will be responsible for the exceeding losses1 . In practice, a reinsurance treaty is split into different layers. For example, a treaty 200 XS 20 can be split into four layers: 10 XS 20, 20 XS 30, 100 XS 50 and 70 XS 150. Seperating the total liability into distinct tranches increases the attractiveness of the entire contract since it allows each reinsurer to choose the degree of volatility and exposure to the primary insurer’s book of business it wants. It also reduces each reinsurer’s risk since they are only responsible for that part of the loss that is within the layer they purchased. By bidding more or less for every layer, the reinsurer can find itself with a level of risk that is commensurated with what it wants. Similar to financial securities, the highest layers are the most ”uncertain” layers since they concern the distribution tails, akin to the fact that the more out-of-the-money are the options, the more volatile is their price before maturity. The lowest layers2 are more often hit. The price should then decrease over 1 For the insurer, the payoff is akin to having purchased a call option with exercise price P on the losses due to the event, and selling a call option with exercise price L + P on the same losses. 2 The lowest layers are usually use to smooth the loss ratio, while the highest layers prevent the large losses of extreme events.. 14.
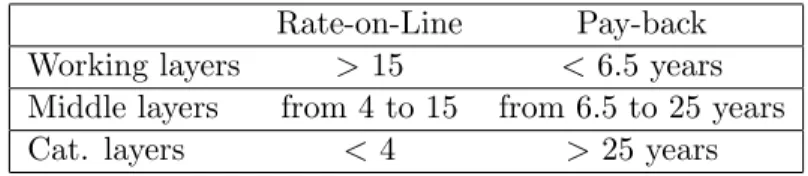
(16) the layers, but be more volatile. Two indicators are generally used to characterize the cost of a reinsurance layer: The rate-online (RoL) and the pay-back. RoL =. Reinsurance P remium Limit. =. 1 P ayBack. Each indicator’s role is to define a measure per unit of risk assumed by the reinsurer. In the case of the rate-on-line, we have a measure of the premium that the reinsurer receives per unit of risk it is assuming. The PayBack is an amortization period, which we can see as the number of years of premium that a reinsurer must collect to finance the payment of the entire layer (or the reinsurer’s payment capacity). The layers can be classified according to their RoL and their P ayBack (see the Table 1 below). Working layers are the ones, with high rate-on-line and quick amortization (i.e., it takes only 6 years to accumulate enough premiums to guarantee the capacity of that layer) and are intended to be very often used - thus the term used: Working layers. Catatrophic (Cat.) layers on the other hand are rarely used or affected by losses since they are designed to cover against unfrequent catastrophic events. Using the P ayBack measure, we can say that a catastrophe is designed as such if a loss occurs less frequently than once every 25 years.. Working layers Middle layers Cat. layers. Rate-on-Line > 15 from 4 to 15 <4. Pay-back < 6.5 years from 6.5 to 25 years > 25 years. Table 1: Classification according to the Rate-on-Line and Pay-Back An insurance company willing to buy reinsurance can request quotes from different reinsurers for each layer of the reinsurance treaty. In the great majority of cases, those requests are made through an intermediary called a reinsurance broker. Unlike investors in the securitization market who can be almost any type of institution or individual seeking a particular exposure to the risk that is being securitized, the reinsurance market mostly includes specialist firms whose whole purpose is to sell protection to primary insurers for their portfolio of exposures. The opacity of the insurance market (meaning that not everything is known by all participants regarding the potential loss that insurers may suffer), requires that reinsurers have a specific knowledge of the types of risks they are willing to underwrite and assume. Reinsurers will sometimes be in a better position than the primary insurance in the sense that reinsurers often understand better the qualitative and quantitative nature of the risk that the insurer has accepted to underwrite and assume. This is especially true in the case of highly technical risks. 15.
(17) There are typically two types of excess of loss reinsurance treaties; either the treaties are risk based or they are event based. The reason why these two contract types co-exist is that they offer the reinsurer and the insurer some flexibility with respect to the exposure that one wants to acquire, and the other to divest. 1. Treaty by risk: The exposure is linked to a possible disaster to a single risk (or contract) of the insurer’s portfolio. The risk is usually associated with a single policy, a single insured or a single umbrella insurance policy. 2. Treaty by event: The exposure is connected to the emergence of an event (natural catastrophes, technological accident,...), affecting several risks that are known to be partially correlated, such as several policies in a given geographical area, or several policies for a given age group. In that case the reinsurer is exposed to an accumulation of disasters.3 The type of risk that is being insured also plays an important role since not all lines of business (the term ”line of insurance” is also often used to identify the lines of business in which an insurer is involved) have the same statistical distribution. This means that it is of prime importance to distinguish in any data set what lines of insurance are being ceded and reinsured. Lines of business that require more technical and knowledge will be more expensive to reinsure than so that not all lines of business can be compared directly. Moreover, the events that can affect lines of insurance are different depending on the risk insured. In terms of reinsurance pricing, several methods are used by players in the reinsurance market. The main pricing methods are known as: Experience pricing, Probability pricing, and Exposure pricing, and can be presented as follows: • The pricing on experience (burning cost) takes into account the past claim of the portfolio over several years, that are discounted to fit the current exposure. • The probability pricing consists in determining a frequency-severity model and running simulations. • The pricing on exposure uses the information available on the portfolio and the exposure to estimate the part of the bonus returning to the reinsurer. Finally, an important characteristic of most reinsurance treaties is the reinsurers’s annual maximum capital commitment, irrespective of the number of events that may plague a given treaty on 3. There also exists treaty by conflagration, more difficult to appraise, we will not analyze it here.. 16.
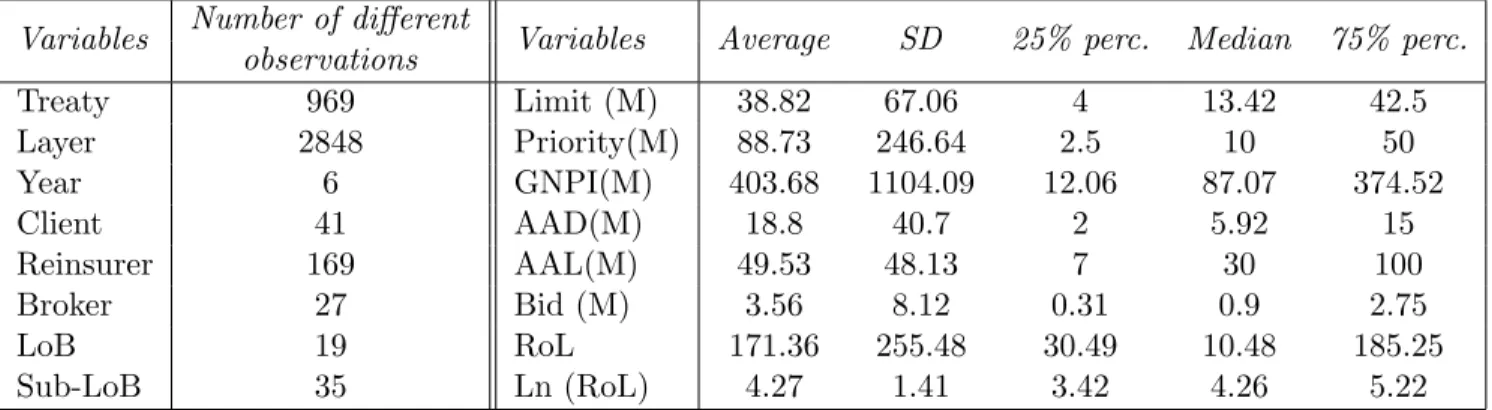
(18) a given risk and exposure. In practice, this total commitment is expressed in multiple of the limit for a single event or exposure and is called the number of recoveries. Thus, a treaty ”20 XS 10” with two recoveries implies that the annual maximum commitment of the reinsurers is limited to 60 million. The premium initially paid by the insurer only corresponds to a commitment equal to one limit. As events happen and use up the limit, the insurer has the option of paying an additional premium, called a reinstatement premium, in order to have the reinsurance contract reinstated to cover losses due to any new event that the primary insurer remains exposed to for the same portfolio of risks.. 4. Data source, collection and description. 4.1. Data description. The proprietary data set4 that we obtained graciously includes a reasonable number of primary insurance companies as well a large number of reinsurance companies. The entries in the data set presents the quotes that different reinsurers made for different layers of a large number of reinsurance treaties for the years 2005 through 2010. The data set contains 19,614 entries over these six years, for 969 different treaties that have on average 2.94 layers. The data includes 41 different primary insurers (which we shall call clients hereinafter) that seek to reinsure exposure in 28 different countries or regions. Of the 41 primary insurers that reported seeking reinsurance at any point in time, only 23 (56%) were doing so in 2005, and 38 (93%) in 2010. The data tells us that the number of primary insurers seeking reinsurance increased steadily through the years. The data should not suffer from any survivorship bias since the annual data include the information on the players that were in the market at the indicated time. On the supply side, the data reports the presence of 169 reinsurance companies that do business in almost all continents. The data set also provides us with the reinsurance broker that arranged specific transactions on tranches or on the entire treaty, although over 80% of the observations seem to have been arranged directly between the primary insurer and the reinsurer. There are 27 different named reinsurance brokers. The data set separates exposure into 19 lines of insurance, that are divided into a total of 35 sub-lines. We also have access to the duration of the contracts. Although contract duration ranges from a month to three years, over 95% of the treaties have a duration of exactly one year. The importance of the line of business is also reported in the great majority of cases under 4 As previously stated, entries in the data set were anonymized by the authors to remove all possibilities of identifying the source of the information. As a consequence, the named of the primary insurers and of the reinsurers have been removed and replaced by codes P101 through P141 for the primary insurers, and R1001 through R1169 for the reinsurers. Furthermore, all currency units were translated into euros using the exchange rate at year end to anonymize further the data.. 17.
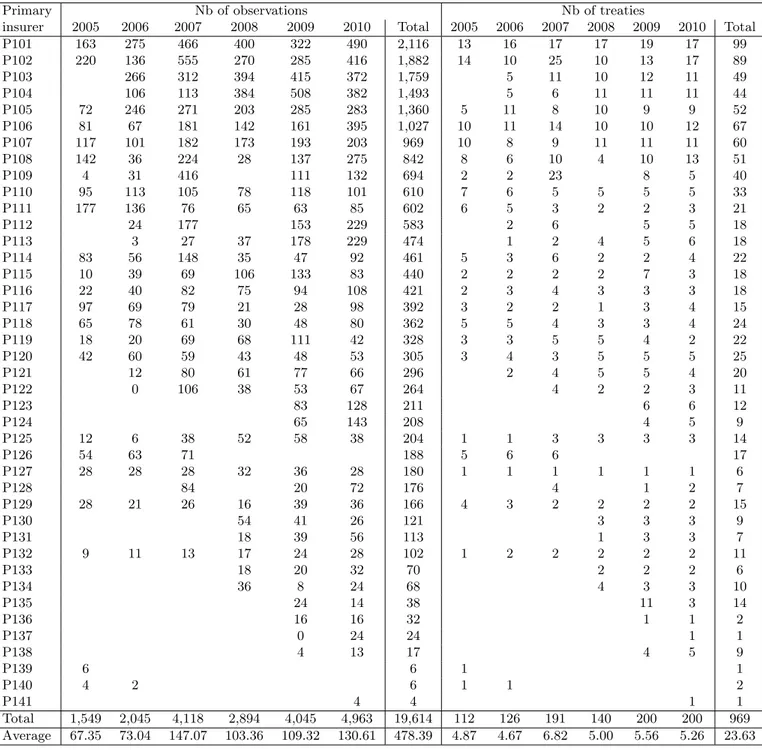
(19) the name ”gross net premium income” (or GNPI). This GNPI is important to know since many reinsurers provide their bid for a given tranche based on a proportion of the GNPI. Finally, we have information on some special clauses and riders that are attached to the different layers, such as the annual aggregate deductible, which is the minimum annual loss before the reinsurer’s liability kicks in, the annual aggregate limit, which is the cap on the overall annual liability that a reinsurer may be responsible for, and the reinstatement premiums and the number of possible recoveries that will reinstate the reinsurer’s liability limit of the excess-of-loss treaty after the layer’s coverage has been exhausted because of an event covered by the reinsurance contract. In our data set, for each layer, the primary insurers contacted on average 9 reinsurers in order to ask them for a quote, and received an average of 6 responses. The response of the reinsurer can be a refusal to bear the risk the primary insurer is trying to reinsure (in this case, the reinsurer’s quote is 0), or a positive quote reflecting the reinsurer’s willingness to reinsure the layer. It also happens that a reinsurer was contacted, but did not provide any answer. In that case, mostly because the reinsurer did not wish to have further information on the layer for which reinsurance is saught, there is no quote. The quote can be a flat price (16% of the observations), or a rate of the GNPI (84% of the observations). We can deduce what is the rate-on-line - that is, the reinsurance premium divided by the reinsurance layer’s limit or width - for each layer no matter whether the quote is a flat rate or proportional to the GNPI. This allows us to have a relatively comparable measure of the price per unit of coverage across the different layers. The only valuable information that we do not have concerns the winning bid for a given layer. Furthermore, from anecdotal evidence while talking to the provider of the proprietary data, we cannot even presume that the lowest bid is the winning bid since there are other considerations in accepting to reinsure with an entity, such as its creditworthiness and the primary insurer’s exposure to one particular reinsurer (see Table 2 for a summary of the main variables of the data set). [INSERT Table 2 ABOUT HERE] As stated previously, the data set is rich enough to allow us to examine how the reinsurance market works, at least more so than any other academic study in the past. We can also study what are the determinants of the reinsurance bids made by the reinsurers, and how the demand and supply for reinsurance have evolved over the years. The data set also gives us a lot of material to examine price distribution across layers and across lines of insurance. From Table 3 (all tables can be found in the Appendix), we note a large concentration of our observations amongst a relatively small number of primary insurers. Indeed, six primary insurers account for 49% of all the observations in the dataset, and 41% of the treaties. We can observe 18.
(20) some evolution over the years. There has been a consequent increase in the number of reinsurance treaties and layers in 2007, with the double of observations. Conversely, the reinsurance market has drastically shrunk in 2008, the number of treaties and the number of layers within each treaty have respectively decreased of 36% and 20%. The reinsurance market has risen again in 2009 and 2010. [INSERT Table 3 ABOUT HERE] Table 4 shows the distribution of the observations per layers. It is interesting to observe that 28% of the reinsurance treaties in our data set have a single layer. Put another way, 271 out of the 969 treaties in our data set do not have tranches. Moreover 83% of the observations are bids or requests for bids for treaties that have four layers or less, so that only 17% of reinsurance treaties are divided into five or more layers or tranches. This means that 55% have more than one and less than four reisnurance tranches. On average, a reinsurance treaty has 3 layers and provides 20 observations (bids or requests for bids). Furthermore, the composition of the treaties have changed over time. Reinsurance treaties are more complex in 2010 than they were in 2005 and 2006, for the same type of insured risk and the same size of the contract. [INSERT Table 4 ABOUT HERE] The data set reports the treaties’ lines of insurance. Clearly different insurance lines behave differently so that a reinsurance agreement on a portfolio of motor exposures is not expected to have the same price or rate-on-line as a reinsurance contract that cover property catastrophic risks. We see in Table 5 that 80% of the treaties (and 87% of the observations) are associated with only seven lines of business. It therefore seems that primary insurers are more likely to reinsure risks associated with natural hazards, property damage, general liability, accidents, motor, transports and maritime exposures. Reinsurance contracts that are structured around natural event catastrophes are the ones that report the largest number of layers with 4.10 layers on average. They are also the most numerous types of reinsurance treaties in the data set, with property damage treaties coming in as a very close second (and the second largest number of layers, with an average of 3.41 layers per reinsurance treaty). The treaties on the other lines of business have on average 1.81 layers. [INSERT Table 5 ABOUT HERE] Finally, the observations in the data set are also quite well distributed geographically. Approximately one-third of all observations are associated with activities occuring in the primary insurer’s home market, one third are associated with activities occuring in the primary insurer’s near abroad 19.
(21) market and one-third are associated with activities that involve one of the primary insurers’ foreign subsidiaries in the rest of the world.. 4.2. Examples of reinsurance treaties. Reinsurance contracts are very client specific so that different clients (i.e., primary insurers) are looking for different types of reinsurance structure depending on the line of business they are seeking to reinsure.5 We provide in the following three tables examples of reinsurance treaties for a given primary insurer with, for each reinsurance layer and year, the limit in excess of the priority, the recovery clause (if any), the number of bids saught as observations, the number of reinsurers involved, and the number of positive quoted bids. Furthermore, for the subset of reinsurers that offered positive quotations, the tables also report the average log of the rate-on-line, the average bid, and the dispersion of the reinsurance .These reinsurance treaties are a property damage treaty (Table 6), a automobile risk treaty (Table 7) and a natural event catastrophe risk treaty (Table 8) [INSERT Table 6 ABOUT HERE] [INSERT Table 7 ABOUT HERE] [INSERT Table 8 ABOUT HERE] We introduce and compare these three different treaties from different primary insurers with different lines of business to highlight the structural differences that can emerge in different reinsurance treaties, as wel as the differences in time for the same type of risk reinsured by the same primary insurer. It gives us also an idea of the richness of the data that we were fortunate to obtain. Evolution of the contract structures. We see in the three reinsurance treaty tables (i.e., Tables. 6, 7 and 8) a clear evolution of reinsurance contract structure in time. For instance, the structure of the property damage reinsurance treaty (Table 6) did not change for the first 5 years in the data set, keeping five layers that have the same priority and limit year after year. Even the recovery conditions remained the same for those five years. The size of the reinsurance contract changed, however, as can be seen from the increase in the GNPI. This can be due to the number of individual contracts that are included in the primary insurer’s book of business, or merely due to changes in the market value of the insured portfolio. The number of reinsurers that were asked to offer a quote varied by close to 50% over the first five years, although the number of insurers that actually offered 5. We need to pay attention to compare what is comparable over the years. It is not exactly panel data due to the structure changes of the treaties.. 20.
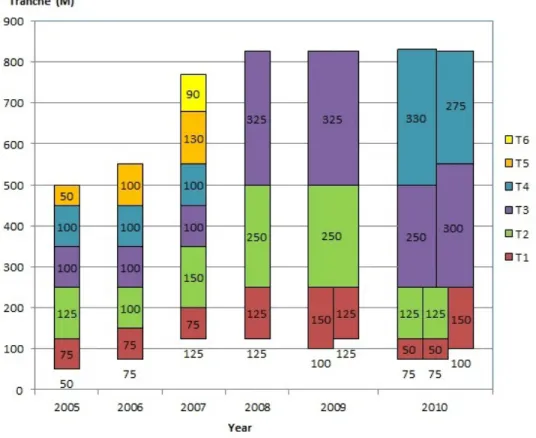
(22) a strictly positive bid for a given tranche remained relatively steady over the years. We observe in 2010, however, that the same reinsurance treaty (i.e., the same primary insurer for the same line of business and sub-line of business) becomes a bit more flexible. Although the reinsurance treaty keeps the five layer structure that was present in the years 2005-2009, we see that layers 1, 3 and 4 are split in two or three different parallel layers. Although the parallel layers look similar, they usually take into account different risks or have different exclusions (for example, earthquake can be divided into ground-shaking and fire-following), or they include different geographic regions (for example, a high risk sub-region versus a low-risk sub-region), or provide different reinsurance clauses (such as different priorities, limits or recovery clauses). In the case of the current property damage contract, the parallel layers differ with respect to the clauses (in particular the recovery clauses). Similarly, only minor changes affected the first layer of the automobile reinsurance treaty (Table 7) over the first 5 years. In the last year, the first layer split into two parallel layers with different priority levels and limit, at the same time as layers 2 and 3 are merged into a large single layer. It it the natural event catastrophe reinsurance treaty (Table 8) that changed its structure the most over the year, and the most often. Figure 4 provides a more visual description of how dynamic the catastrophe reinsurance treaty changed over the years for the same primary insurer. In particular, we see changes in the number of layers, in the total amount of risk being reinsured, and in the size of the tranches. We also see in the later years changes in the structure of the parallel tranches. This means that over the six years of the data, the total capacity saught from the reinsurance industry in excess of the initial priority increased. It was 450 XS 50 millions in 2005 versus 755 XS 75 millions in 2010. The priority raised and the limit became wider. In 2008, the number of layers in the treaty fell from 6 to 3 layers, at the same time as the number of positive quotes offered by reinsurers was very low even though the number of reinsurers that was contacted was approximately the same as in the previous years. In 2009, the first layer was split into two parallel layers. In 2010, the treaty changed radically and became even more complex, with three working layers ending at the same 250 million total priority cum limit mark, and then having two senior parallel tranches that do not offer the save total capacity in the end. In these three examples, we can see a growing complexity of the reinsurance treaty between 2005 and 2010. It is interesting to see that the financial crisis of 2008 does not seem to have had much impact on the structure of there reinsurance market, except perhaps for the case of the natural event catastrophe reinsurance treaty where the contract structure in 2008 (and the number of bidding reinsurers) is radically different than in the surrounding years. But even in this case, it. 21.
(23) Figure 4: Evolution of the Cat treaty over the years Note: This figure displays the evolution of the Excess of Loss Catastrophe treaty across the years, as described in Table 8.. is not obvious that the cause of the change in the number of bids is due to the crisis rather than the change in the number of tranches. Perhaps the reduction in the number of tranches is due to the financial crisis, but it is not obvious why that would be, or even why that would so only in the case of the catastrophe reinsurance treaty. Bidders and bids for three treaties. We can observe in the three previous tables that each. primary insurer seeking to reinsurer the risk they are exposed to contacted several reinsurers for each layers in order to have a vision of the supply side of the market. Although it is usual to contact the same reinsurer for all the layers of the proposed reinsurance treaty, this is not always the case as some reinsurers are specialized in one type of layer (working, mezzanine or senior). On average, 86% of the contacted reinsurers have responded by saying they were interested in having more information about the layer that the primary insurer is willing to cede. Of these interested. 22.
(24) reinsurers, 70% were willing to reinsure the layer at some price. In the first two years, more than 85% of the responses were positive. In the last four years, this rate falls to 60%. The fact that a reinsurer does not respond at all means either that he did not see the request, or that he is not interested to do business with the primary insurer in that year for that line of business, or for that layer of the reinsurance treaty, at whatever price. On average, over the six years of the data, approximately 60% of the contracted reinsurers were willing to reinsure a given tranche for a given price for these three specific reinsurance treaties. A reinsurer can refuse to bid for a risk because, for instance, he may have already used up all his risk-capital or capacity for this type of risk. This is different from a bid of zero that is essentially the result of studying the portfolio of risks that the primary insurer is trying to reinsure and then deciding that the portfolio does not provide the reinsurer enough information for him to bid on the tranche. This means that a reinsurer who refuses to bid after he received the information from the primary insurer provides is a more interpretable signal about the riskiness of a portfolio of risk than the mere fact that the reisurer was contacted but did not care to even study the cedent insurer’s proposal. Refusing to bid after obtaining the information means that the reinsurer either thinks that the primary insurer’s portfolio of risks is too risky for him, or because the risk does not match his diversification policy. Looking at the reinsurance premiums, we can analyze the distribution of the bids in each layer, and how they evolve over the years.6 Firstly, we observe that that average rate-on-line decrease at the seniority of the layer increases. Interestingly also is that fact that the average bid also seems to decrease as a function of the seniority of the layer even though the layers are generally larger as they become more senior. We see that the average bids (and a fortiori the average rate-on-line) reaches its lowest level for a given treaty for a given year in most senior layers, thus suggesting that the risks that these senior tranches are ever used is very low. For instance, in the 2005 property damage reinsurance treaty of Table 6, layer 5 has an average log of the rate-on-line of 3.48, which translates into an average P ayBack of approximately 29 (meaning that the average reinsurer believes that losses in excess of 75 million dollars are likely to happen once every 29 years). In contrast, layer 3 has an average log of the rate-on-line of 4.96, which translates into an average P ayBack of approximately 6 years (meaning that the average reinsurer believes that losses in excess of 30 million dollars are likely to happen once every 6 years). In 2009, the same two layers have lower rate-on-lines and higher payback. This either means that the market’s competitiveness has increased with the years or that, for some reasons, it is now believed that the risk of an important losse falling on the primary insurer has decreased. It is interesting to see that it is in the year of 6. Add a discussion on the type of reinsurer (major local, major world, specialized, new).. 23.
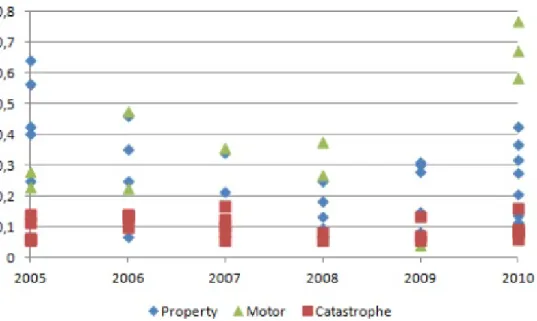
(25) Figure 5: Evolution of the standard deviation normalized by the bid of each reinsurance treaty Note: This figure displays the distribution by year of the standard deviation of each reinsurance treaty layers normalized by the average bid for the tranche; the graph excludes standard deviation values of zero and normalized standard deviations greater than 1.. the financial crisis of 2008 where, for all the non-working tranches (i.e., for the tranches 3-5), the average bid is the lowest of all the years 2005-2009. The second interesting bid feature that can be seen in Table 6 is that the the dispersion of the bid, as measured by the standard deviation of the bids, seems to generally decrease with the seniority of the tranche. But this reduction in dispersion may be only due the fact that bids on average decrease in tranche seniority. When we normalize the standard deviation of the bids by the average bid (column labeled Sharpe). we see that the normalized dispersion of bids is distributed more or less homogeneously across the tranches with no discernible pattern within a given line of business. What is more interesting when looking across lines of business is that the normalized standard deviation of the bids seems the be the lowest for the most important natural hazard catastrophic reinsurance treaty. This result seems to say that there either is a higher level of coordination among reinsurance for high end losses (suggesting that the conclusion of Doherty and Smith, 1993, and Froot, 2001, about the lack of competition at the high end is problematic) or that these events are better understood by market players since the amount of moral hazard and adverse selection in the natural hazard catastrophic reinsurance market may be low. The lack of competition does not seem to hold following further scrutiny since there does not seem to be less 24.
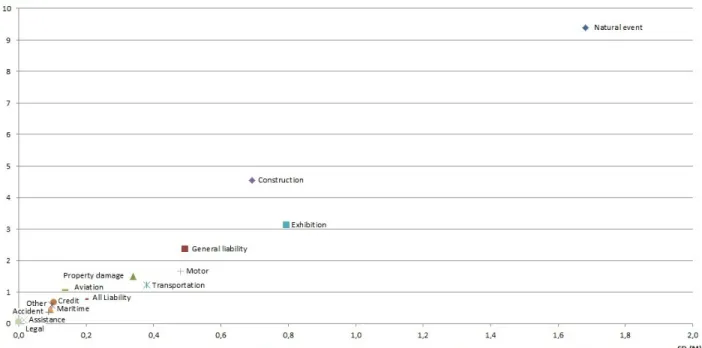
(26) Figure 6: Line-of-Business according to their bid and dispersion Note: For each line of business, this figure presents the standard deviation of all the bids as a function of the average bid for the entire line, all years and all layers included.. reinsurers bidding for catastrophic tranches than for the other types of reinsurance treaties. Figure 5 provides a more visual depiction of how the normalized standard deviation of bids is distributed for the three reinsurance treaties that we examined more closely across years. We clearly see that the natural hazard catastrophe reinsurance treaty is the one that has, across the years, the lowest standard deviation normalized by the average bid of the three contracts. When we look at the entire data set, by line of business, we find an interesting pattern that may be due purely to randomness, but that is still interesting nonetheless. Figure 6 shows the dispersion of the lines of business according to their average premium and premium dispersion. As expected, we notice that the different LoB do not behave in the same way. Looking at the 7 biggest LoB (which embrace 87% of the observation), the rate-on-line, the mean premium and the premium’s dispersion are higher than for the other lines of business.. 25.
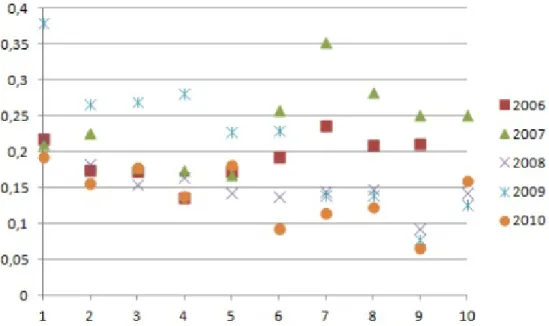
(27) 5. Analysis and Discussion. 5.1. Market and contract structure. We examine here whether the operating of the reinsurance market and the structure of the reinsurance treaties have evolved over time. As previously seen in the data description and the examples, the structure of the reinsurance treaties seems to have became more complex over time, with more layers and more parallel composition of layers. Nevertheless, even though contracts are becoming more complex and intricate, there seems to be a emerging pattern in the data in terms of the rate-on-line for each tranche and the Taking into account the whole data set, Tables 9, 10 and 11 report respectively the average reinsurance premium in millions, the average of the log of the rate-on-line (per thousand units of coverage), and the dispersion of the bids as a function of the layer as measured by the standard deviation. Looking at the rate-on-line of the different tranches, we note that, apart from layers 1 and 2, all other layers have, on average, the same rate-on-line. This phenomenon is not due to the aggregation of the data across years since the same pattern is observed in each year. Figure 7 shows for those most common layers above the working layer 1, that the standard deviations of the bids normalized by the average bid, is quite compact in a given year. This suggest that reinsurers share some common evaluation techniques when examining the different tranches of a reinsurance treaty. [INSERT Table 9 ABOUT HERE] [INSERT Table 10 ABOUT HERE] [INSERT Table 11 ABOUT HERE] Another interesting phenomenon that we observe with the data is presented in the following Figure 8 that presents the normalized standard deviation of bids for all layers, and for contract years 2006-2010. It is interesting to see that in for the higher layers (i.e., layers 7 through 10) the standard deviation of bids, normalized by the average bid, is greater in the years prior to the financial crisis. Of course not too much can be deducted from this since we are aggregating all layers, no matter what the line of business or the sub-line of business is, but it is interesting nonetheless to see such a pattern. On average, it seems that 0.20 is a good focal point to think of as the ”normal” ratio of the standard deviation of the bids to the average of the bids.. 26.
(28) Figure 7: Normalize dispersion of bids by layer and by year; selected layers 2 through 6. Figure 8: Ratio of the standard deviation of the bid to the average of the bid Note: For each calendar year and for all tranches of reinsurance treaty, this figure presents the ratio of the standard deviation of the reinsurer bid to the average of the reinsurer bid.. 27.
(29) 5.2. Pricing and tranching. The last section of our analysis relates to the determinants of the reinsurance prices (or quotes) that are proposed by reinsurers in the data set. We will look at both the reinsurance premium per se as well as the rate-on-line in order to analyze how the prices evolve with the layers, the limit and the dispersion of the premium. Table 12 reports the regressions results that are, essentially, the same whether we are interested in the quote bid, or the implied quote rate-on-line of each bid. Although not shown in Table 12, 71% of the premium is explained by only 4 variables: the limit (+), the priority (-), the layer (-), and the premium’s dispersion (+). The last four variables only add 7% to the regression’s goodness of fit. As we see in the regression, the reinsurance premium increases with the limit and decreases with the priority. This is to be expected because a reinsurer who accepts to reinsure a larger layer is exposed to a larger potential risk, on the one hand, and a reinsurer who has a lower level of loss before his capital becomes ”fair game” is more likely to have to pay, and therefore the premium should increase. It is interesting to see that the higher is the layer (meaning that there are many reinsurers between the primary insurer and the layer), then the lower is the premium. This suggests that subdividing into many layers may actually reduce the reinsurance cost to the primary insurer. Surprisingly, however, the greater is the number of bids, the higher is the premium. Finally it seems that the premium increases, which suggests that more uncertain layers (i.e., layers where the reinsurers are more variable expectations with respect to the loss) command a higher premium, ceteris paribus. [INSERT Table 12 ABOUT HERE] Table 12 also reports the regression results when using the log of the rate-on-line7 as the dependent variable.Although the goodness-of-fit is lower than in the bid regression (44% versus 78%), the economic significance of the explanatory variables is as strong in the two regressions. We find that the greater is the limit, the lower is the RoL. This is to be expected. Interestingly, the higher is the priority, the greater is the rate-on-line, but the higher is the layer, the lower is the RoL. This contrasts with the bid regression where the priority and the layer had the same impact on the bid, whereas in the ROL regression, the sign of the two variables are opposite. The dispersion of the bids and the number of bids seem to be positively correlated with the ROL, as they both were with the bids themselves. 7. We use here the logarithm of the rate-on-line in order to have smoother results.. 28.
(30) 6. Conclusion. 7. References 1. Abbring, J.H., J. Pinquet and P.-A. Chiappori (2003). Moral hazard and dynamic insurance data. Journal of the European Economic Association 1(4): 767-820. 2. Akerlof, A.A. (1970). The Market for ”Lemons”: Quality Uncertainty and the Market Mechanism. The Quarterly Journal of Economics, 84(3): 488-500. 3. Albertini, L. and P. Barrieu (2009). The Handbook of Insurance-Linked Securities (New York, John Wiley & Sons), 398 pages. 4. Arrow, K.J. (1971). Insurance, Risk and Resource Allocation. Essays in the Theory of Risk-Bearing, 134-143. 5. Berger, L, J.D. Cummins and S. Tennyson (1992). Reinsurance and the Liability Insurance Crisis. Journal of Risk and Uncertainty, 5: 253-72. 6. Bernard, C. and W. Tian (2009). Optimal Reinsurance Arrangements under Tail Risk Measures. Journal of Risk and Insurance, 76:709-725. 7. Bernardo, A.E. and B. Cornell (1997). The Valuation of Complex Derivatives by Major Investment Firms: Empirical Evidence. The Journal of Finance, 52(2): 785-798. 8. Biffis, E. and D. Blake (2010). Securitizing and tranching longevity exposures. Insurance: Mathematics and Economics, 46(1): 186-197. 9. Boot, A. W.A. and A.V. Thakor (1993). Security Design. Journal of Finance, 48(4): 1349-78.. 10. Borch, K. (1962). Equilibrium in a Reinsurance Market. Econometrica, 30:424-444. 11. Born, P. and W.K. Viscusi (2006). The catastrophic effects of natural disasters on insurance markets. Journal of Risk and Uncertainty 33:55–72. 12. Boyer, M.M. and K. Gobert (2008). Dynamic Prevention in Short Term Insurance Contracts. Journal of Risk and Insurance, 75: 289-312. 13. Boyer, M. M. (2011), Sustaining a Long Term Relationship Using Short Term Reinsurance Contracts. Working paper. 14. Browne, M. and R.E. Hoyt (2000). The Demand for Flood Insurance: Empirical Evidence. Journal of Risk and Uncertainty, 20: 291-. 15. Chiappori, P.-A. and B. Salani´e (2000). Testing for Asymmetric Information in Insurance Markets. The Journal of Political Economy, 108(1): 56-78. 16. Cole C., P. Maroney, K. McCullough, J. Newman and C. Nyce (2009). A Review of the Development of Residual Market Mechanisms in Florida. Journal of Insurance Regulation, 27: 55-80. 17. Cole C., D. MacPherson, P. Maroney, K. McCullough and C. Nyce (2011). The Use of Postloss Financing of Catastrophic Risk. Risk Management and Insurance Review, 14: 265-298. 18. Cowley, A. and J. D. Cummins (2005). Securitization of life insurance assets and liabilities. The Journal of Risk and Insurance, 72(2): 193-226. 29.
(31) 19. Cuchra, M.F. and T. Jenkinson (2005). Security Design in the Real World: Why are Securitization Issues Tranched?. EFA 2005 Moscow Meetings Paper. 20. Culp, C.L. and K.J. O’Donnell (2009). Catastrophe reinsurance and risk capital in the wake of the credit crisis. The Journal of Risk Finance, 10(5): 430-459. 21. Cummins, J. D., G. Dionne, R. Gagne and A. Nouira (2008). The Costs and Benefits of Reinsurance. Working paper. 22. Cummins, J.D., N.A. Doherty and A. Lo (2002). Can Insurers Pay for the Big One? Measuring the Capacity of the Insurance Market to Respond to Catastrophic Losses. Journal of Banking and Finance, 26:557-583. 23. Cummins, J.D., Lewis, C.M., Phillips, R.D. (1999). Pricing excess of loss reinsurance contracts against catastrophic loss”, in K. Froot (Ed.), The Financing of Catastrophe Risk. The University of Chicago Press, Chicago. 24. Cummins, J.D. and S. Tennyson (1996). Moral hazard in insurance claiming: Evidence from automobile insurance. Journal of Risk and Uncertainty, 12(1): 29-50. 25. Cummins, J.D. and P. Trainar (2009). Securitization, Insurance, and Reinsurance. Journal of Risk and Insurance, 76:463-492. 26. Cummins, J.D. and M.A. Weiss (2009). Convergence of Insurance and Financial Markets: Hybrid and Securitized Risk Transfer Solutions. Journal of Risk and Insurance, 76:493-545. 27. Dionne, G., P. C. Michaud and M. Dahchour (2004). Separating Moral Hazard from Adverse Selection in Automobile Insurance: Longitudinal Evidence from France. Working paper. 28. Doherty, N.A. (1997). Corporate Insurance: Competition from Capital Markets and Financial Institutions. Assurances, 65: 63-94. 29. Doherty, N.A. and S.M. Tinic (1981). Reinsurance under Conditions of Capital Market Equilibrium: A Note. Journal of Finance, 36: 949-953. 30. Doherty, N.A. and K. Smetters (2005). Moral Hazard in Reinsurance Markets. Journal of Risk and Insurance, 72(3): 375-391. 31. Doherty, N.A. and C.W. Smith Jr. (1993). Corporate Insurance Strategy: The Case of British Petroleum. Journal of Applied Corporate Finance, 6(3): 4-15. 32. Fazzari, S., R.G. Hubbard and B.C. Petersen (1988). Financing Constraints and Corporate Investment. Brooking Papers on Economic Activity, 1988(1): 141-195. 33. Froot, K.A. (2001). The Market for Catastrophe Risk: A Clinical Examination. Journal of Financial Economics, 60:529-571. 34. Froot, K.A. (2007). Risk Management, Capital Budgeting, and Capital Structure Policy for Insurers and Reinsurers. Journal of Risk and Insurance, 74: 273-299. 35. Froot, K.A. and P.G.J. O’Connell (1999). The pricing of US catastrophe reinsurance, in K. Froot (Ed.), The Financing of Catastrophe Risk. The University of Chicago Press, Chicago, pp. 195–227. 36. Froot, K.A. and P.G.J. O’Connell (2008). On the pricing of intermediated risks: Theory and application to catastrophe reinsurance. Journal of Banking and Finance, 32:69–85. 30.
Figure
+7
Documents relatifs
The complexity of the task, which is determined by the student's preparedness scale at the level of probability of the correct answer P ( ) 0. So the complexity of
We compute in particular the second order derivative of the functional and use it to exclude smooth points of positive curvature for the problem with volume constraint.. The
Effets civils (art. Mais seule l’incorporation parfaite p rod uit complète assim i lation.. L’incorporation parfaite déploie son plein effet : l’incor poré est
L’archive ouverte pluridisciplinaire HAL, est destinée au dépôt et à la diffusion de documents scientifiques de niveau recherche, publiés ou non, émanant des
Applying the gênerai approach presented in [8], we are able to détermine the exact asymptotical behaviour of the average length of the shortest prefix which has to be read in order
of Lyndon words having v right standard fator is a rational
Knuth [5] shows ( n 5/3 ) for the average-case of p = 2 passes and Yao [14] derives an expression for the average case for p = 3 that does not give a direct bound but was used by
The proof uses the second order derivative of the average distance functional F, which itself rely on the second derivative of the distance function along smooth vector fields
