Centre de Recherche en économie de l’Environnement, de l’Agroalimentaire, des Transports et de l’Énergie
Center for Research on the economics of the Environment, Agri-food, Transports and Energy
_______________________
Randrianarisoa: PhD Student in Economics, Airport Research Chair and CREATE, Department of Economics, Université Laval, Pavillon J.-A.-DeSève, 1025 avenue des Sciences-Humaines, Québec (Québec) Canada G1V 0A6
manitra.randrianarisoa.1@ulaval.ca
Bolduc: Professor at the Department of Economics, Université Laval and CREATE Choo: British Columbia Institute of Technology
Oum: Professor at University of British Columbia
Yan: Associate Professor (with tenure) at School of Economic Sciences, Washington State University
Les cahiers de recherche du CREATE ne font pas l’objet d’un processus d’évaluation par les pairs/CREATE working papers do not undergo a peer review process.
ISSN 1927-5544
Effects of Corruption on Efficiency of the European
Airports
Laingo M. Randrianarisoa
Denis Bolduc
Yap Yin Choo
Tae H. Oum
Jia Yan
Cahier de recherche/Working Paper 2015-1
Abstract: The effect of corruption on airport productive efficiency is analyzed using an
unbalanced panel data of major European airports from 2003 to 2009. We first compute the
residual (or net) variable factor productivity using the multilateral index number method and
then apply robust cluster random effects model in order to evaluate the importance of
corruption. We find strong evidence that corruption has negative impacts on airport operating
efficiency; and the effects depend on the ownership form of the airport. The results suggest that
airports under mixed public-private ownership with private majority achieve lower levels of
efficiency when located in more corrupt countries. They even operate less efficiently than fully
and/or majority government owned airports in high corruption environment. We control for
economic regulation, competition level and other airports’ characteristics. Our empirical results
survive several robustness checks including different control variables, three alternative
corruption measures: International Country Risk Guide (ICRG) corruption index, Corruption
Perception Index (CPI) and Control of Corruption Index (CCI). The empirical findings have
important policy implications for management and ownership structuring of airports operating
in countries that suffer from higher levels of corruption.
Keywords: Corruption effects, European airport operating efficiency, Residual (or net) variable
factor productivity, Ownership form, Random effects model
JEL Classification: L93, R40, H00
Highlights
We analyze the effect of corruption on operating efficiency of European airports
Corruption has negative impact on airport operating efficiency
Airports under mixed public-private ownership with private majority achieve lower levels
of efficiency when located in more corrupt countries
Airports under mixed public-private ownership with private majority operate less
efficiently than fully and/or majority government owned airports in high corruption
environment
1. Introduction
This paper investigates the relationship between airport efficiency and corruption in Europe. The determinants of airport efficiency have been largely analyzed in the literature. Studies found that ownership forms (Oum, Adler and Yu, 2006; Georges Assaf and Gillen, 2012; Adler and Liebert, 2014), the level of competition (Chi-Lok and Zhang, 2009; Malighetti et al. 2009), economic regulation (Georges Assaf and Gillen, 2012; Adler and Liebert, 2014) and institutional arrangements (Oum, Yan and Yu, 2008), among others, affect the performance and productivity of airports. The impacts of corruption on airport cost efficiency have received limited attention.
To our knowledge, the study by Yan and Oum (2014) appears to be the only one that investigates the effects of corruption on productivity and input allocation of airports. Using the case of major commercial US airports, their findings reveal that corruption negatively influences airport productivity: in more corrupt environments airports become less productive and tend to use more contracting-out to replace in-house labor. Nonetheless, their empirical analyses are limited to the US airports, which have limited forms of governance. US airports are owned and operated either by a branch of government (mostly municipal or metropolitan government) or through an airport or port authority set up by government. In this study, we extend the analysis of Yan and Oum (2014) to include different forms of airport management and ownership, including mixed public-private ownership with private minority, mixed public-private ownership with private majority and fully private ownership.
In recent years, the private-sector participation in airport management and/or ownership has become a worldwide trend. Starting from the seven major airports in UK including Heathrow, Gatwick and Stansted airports in 1987, many airports in Europe are fully or partially privatized and/or in the process of being privatized.6 The main goal of airport privatization is to allow for easier access to private sector financing and investment, and to improve operating efficiency (Oum, Adler and Yu, 2006). We argue that privatized airports operating in corrupt environments may not achieve higher levels of efficiency because the incentives for managers to pursue efficiency goals are lower. Furthermore, private sector managers have more autonomy to change the allocation of inputs compared with bureaucrats, then they may focus on deriving personal benefits.
Our research is motivated by the literature on the effects of corruption on firm performance, and the empirical findings of Yan and Oum (2014)7 and Dal Bò and Rossi (2007)8 on the negative correlation between corrupt environments and firm productivity. Corruption, which is defined as the misuse of public resources for private gains (Svensson, 2005) is a major source of economic inefficiency, as it diverts scarce resources from their most productive use. Furthermore, corruption is found to divert firms’ managerial efforts from productive activities to rent-seeking activities including political connection building(Fisman, 2001; Svensson, 2003; Clarke and Xu, 2004; Khwaja and Mian, 2005; Dal Bò and Rossi, 2007; Cai, Fang and Xu, 2011). This study attempts to contribute to both the literature on the influence of corruption on economic performance at the micro level and the literature on the efficiency of airports.
We use airports located in Europe to investigate our research question. The corruption levels of European organizations are relatively lower compared with the rest of the world; however evidence show that corruption remains a major concern in the European countries. Empirical findings of Hessami (2014)
6 For example, majority stakes in Copenhagen Kastrup, Vienna International, and Rome's Leonardo Da Vinci Airports have
been sold to private owners.
7 Yan and Oum (2014) argue that in corrupt environments, bureaucrats have no strong incentives to pursue mandated tasks,
leading to a loss of productivity for publicly owned airports.
8 Dal Bò and Rossi (2007) argue that corrupt countries are strongly associated with more inefficient firms (public and private)
1 suggest that corruption in the broad sense of use of government office for private benefit is an issue in OECD countries and is not limited to low-income countries. Furthermore, the OECD (2014) reports that bribes are not just a problem for developing world: bribes are being paid to officials from countries at all stages of economic development. The report also reveals that bribes are usually paid to win public contracts from western organizations and most bribe payers and takers are from wealthy countries.
The airport industry in Europe is not free from corruption scandals; for instance, the New York
Times reported that a $183 million airport project in Spain has become a symbol of the “wasteful spending
that has sunk Spain deep into the recession and the banking crisis”.9 Corruption was also exposed in the reconstruction of Terminal 2 at Germany’s Frankfurt Airport in 1996.10 More recently in 2014, bribery scandals hit the airport of Berlin Brandenburg (BER); bribes were suspected to have been paid by firms wanting to secure airport contracts.11
We use an unbalanced panel data set consisting of 47 major airports from 27 European countries during the 2003-2009 period to empirically investigate the impacts of corruption on operating efficiency. Our main corruption measure is the country-level International Country Risk Guide (ICRG) corruption index.12 The residual (or net) variable factor productivity purchased from the Air Transport Research Society (ATRS) is used as measure of airport operating efficiency. We find that corruption lowers airport managerial efficiency; and the impacts depend on the airport ownership form. Our results confirm the previous findings that privately owned airports, including majority and fully private ownership, are generally more efficient than majority and/or fully government owned airports. However, privately owned airports operate less efficiently than their publicly owned counterparts in high corruption environment. We control for the form of regulation prevalent across European airports, levels of competition, airport characteristics, and potential shocks that may affect airport efficiency during the 2003-2009 period. Our empirical results withstand several robustness checks including different control variables, three alternative corruption measures: International Country Risk Guide (ICRG) corruption index, Corruption Perception Index (CPI) and Control of Corruption Index (CCI) and change in the ownership categories.
The remainder of this paper is organized as follows: Section 2 summarizes the literature on corruption and airport efficiency. Section 3 presents the methodology for computing airport efficiency and assessing the impacts of corruption on the efficiency. Data sets are described in Section 4 and Section 5 defines the variables used in the analysis. The empirical results are presented in Section 6, followed by some robustness checks in Section 7. Finally, conclusions are given in section 8.
2. Literature Review
Corruption influences economic performance at both macro and micro levels. The impacts of corruption on economic performance at the macro level are considered in Schleifer and Vishny (1993), Mauro (1995), Ades and Di Tella (1999), Wei (2000), Habib and Zurawicki (2002) and Sanyal and Samanta (2008). These studies reveal that corruption negatively affects investment and economic growth.
9 The management of the airport of Castellón has been questioned since the airport has not received a single scheduled flight
since its inauguration in 2011. See The New York Times (July 19, 2012): “In Spain, a symbol of ruin at an airport to Nowhere”
10 See The Financial Times (July 2, 1996): “German Airport Corruption Probe Deepens: Five Jailed and 20 Companies under
Investigation” and Reuters Business Report (September 25, 1996): “German corruption wave prompts action”, reported in Rose-Ackerman (1999).
11 For more information, see The Local: Germany’s news in English (May 28, 2014): “Bribery probe hits Berlin's scandal
airport”.
12 Similar as in Dal Bò and Rossi (2007), we use the ICRG corruption index as our main measure of corruption. The index
possesses the advantages of transitivity compared with other indices including World Bank corruption index and/or Transparency International corruption index.
2 With respect to the effect of corruption on firm-level performance, Murphy, Shleifer and Vishny (1991, 1993) show that corruption generates social losses because it props up inefficient firms and drives the allocation of talent, technology and capital away from the socially most productive uses. Dal Bó and Rossi (2007) investigate the role of corruption among the determinants of the efficiency of electricity distribution firms. Their theoretical model states that corruption increases the factor requirements of firms, as it diverts managerial effort away from factor coordination. They empirically find that more corruption in the country is strongly associated with more inefficient firms, and the magnitude of the effects of corruption is considerable. Fisman and Svensson (2007) empirically find that firm growth is negatively correlated to both rate of taxation and bribery. Their results reveal that corruption delays the development process to a much greater extent than taxation. Wren-Lewis (2013) confirms these findings, but argues that the participation of an independent regulatory agency reduces the correlation between corruption and efficiency.
For the aviation industry, Yan and Oum (2014) theoretically investigate the effects of local government corruption on the cost of providing public goods, and find that the impact of corruption is contingent on the governance structure and institutional arrangements of airports. Based on US commercial airports, they empirically confirm their theoretical predictions that corruption lowers airport productivity and increases the ratio of non-labor variable input to labor input of airports. The differences in the effects of corruption between airport authorities and airports managed by local government are due to the internal organization structure such as decision-making and managers’ autonomy to allocate resources. As result, governance restructuring, which consists of transferring airport management from a local government to an airport authority may not necessarily lead to efficiency gains in corrupt environments.
Yan and Oum (2014) limit their analysis to the US commercial airports. The US airports are subject to specific governance structure; they are mostly owned, managed and operated by local governments either as government branches or via airport authorities. Since the first privatization of British Airports Authority in 1987, airport governance restructuring has proliferated elsewhere in the world. The goal of our paper is to extend and confirm the findings of Yan and Oum (2014) to include other forms of ownership and governance. Airports in Europe are chosen to test the impact of corruption on efficiency of fully and partially privatized airports.
Literature on airport efficiency identifies three different performance and productivity analysis methods for airports. These approaches include productivity Index Number method, Data Envelopment Analysis (DEA) and Stochastic Frontier Analysis (SFA). The multilateral index number method, the consistency of which with neoclassical theory of the firm first established by Caves, Christensen and Diewert (1982), uses total factor productivity (TFP) as measure of efficiency. TFP is defined as the ratio of output index to input index, and is easy to compute if firms use single inputs to provide single outputs. However, airports utilize multiple inputs such as labor, capital, and other resources to produce multiple services for both airlines and passengers. Similar as in Oum, Adler and Yu (2006) and Obeng, Assar and Benjamin (1992), the multilateral index number method proposed by Caves, Christensen, and Diewert (1982) can be used to aggregate inputs and outputs.13 In the past, many studies including Hooper and Hensher (1997), Nyshadham and Rao (2000) have used TFP approach to evaluate airport performance.
Data envelopment analysis (DEA) is a non-parametric frontier method firstly proposed by Charnes, Cooper and Rhodes (1978). Based on linear programming method, DEA evaluates efficiency scores for firms (or Decision Marking Units) relative to an efficiency frontier, which is formed by enveloping the data on the frontier. While DEA assumes the continuity and convexity of the production
13 TFP assumes that firms are under constant returns to scale and are allocatively efficient. However, TFP requires input and
3 possibility set, it allows for using physical measures of capital inputs such as terminal size, number and/or length of runway as approximation of capital inputs.14 Some applications of DEA to the aviation industry can be found in Gillen and Lall (1997), Adler and Berechman (2001), Martı́n-Cejas (2002), Abbott and Wu (2002), Pels, Nijkamp and Rietveld (2001, 2003) and Barros and Sampaio (2004).
Stochastic Frontier Analysis (SFA) is a parametric approach that uses regression equation to assess efficiency. Firstly developed by Aigner, Amemiya and Poirier (1976) and Meeusen and Van den Broeck (1977), SFA explains output as a function of inputs and a stochastic disturbance, which consists of two parts: a stochastic inefficiency and a traditional “noise term”. For the case of estimating production (cost) function the former is always negative (positive). Similar to DEA, SFA assumes the continuity and convexity of the production possibility set. SFA further assumes a particular form of inefficiency distribution and involves a specification of frontier function, which enables it to conduct hypothesis tests and distinguish the sources of efficiency growth. Tsionas (2003), Pestana Barros (2009), Assaf (2009, 2010), Marques and Barros (2010), Brissimis, Delis and Tsionas (2010) and Suzuki et al. (2010) are among the many SFA applications. Liebert and Niemeier (2010) provide an interesting review of all three approaches. The TFP approach is chosen for the purposes of this study.
3. Methodology
To investigate the effect of corruption on airport efficiency, a two-stage procedure is used. The first stage considers the multilateral index number approach to evaluate the residual (or net) variable factor productivity (rvfp) — our measure of airport operating efficiency. The second stage specifies a regression analysis that explains airport efficiency as a linear function of corruption index and a set of business environmental factors.
3.1 Residual (or net) variable factor productivity (rvfp)
The residual (or net) variable factor productivity (rvfp) computed by Air Transport Research Society (ATRS, 2011) is used as measure of airport true managerial efficiency.
To obtain the residual (or net) variable factor productivity (rvfp), we first compute the variable factor productivity (vfp) index, which is defined as the ratio of aggregate outputs to aggregate inputs. Since airports utilize multiple inputs to produce multiple outputs, we apply the multilateral index number method, devised by Caves, Christensen and Diewert (1982) to aggregate the inputs and outputs.
The number of aircraft movements (ATMs), passenger volumes and non-aeronautical revenues are considered to aggregate outputs.15 It is noteworthy that demand for non-aeronautical services is closely related and complementary to that for aeronautical services (Oum, Adler and Yu, 2006). Moreover, the non-aeronautical revenues account for a large and increasing portion of airport revenues.16 Thus, we need to include non-aeronautical revenues among aggregate outputs in order to circumvent serious bias in measuring airport operating efficiency.
With respect to inputs, airports utilize multiple resources including labor input, purchased goods and materials, and purchased services (outsourcing and contracting out) to produce multiple services for airlines and passengers. Labor input is defined as the full-time equivalent number of employees directly
14 One important drawback of DEA method is the lack of transitivity
15 Air cargo services are generally handled by airlines, third-party cargo handling companies and others, which lease space
and facilities from airports. Air cargo services are not considered as a separate output in this research, as airports derive a very small percentage of their income from direct service related to air cargo
16 On average, the non-aeronautical activities including concessions, car parking, and numerous other services account for
4 paid for by the airport operators. The outsourced services for goods, services, and materials purchased directly by an airport are combined with all other inputs to form a so-called “soft-cost input”. We note that our efficiency measure does not consider capital inputs. It is almost impossible to assess capital inputs and expenditures accurately on a comparable basis. Besides, capital costs are usually quasi-fixed during a long-term period while the vfp accounts for a short and/or medium term period.
The residual (or net) variable factor productivity (rvfp) is obtained by using a regression analysis, which consists of removing the effects of factors that cannot be controlled by airport managers at least in the short to medium term from the vfp index. These factors include the percentage of international passengers, cargo share, capacity constraint, average aircraft size, airport size and different macroeconomic shocks. The residual of the variable factor productivity index is deemed as more accurate for this research.
3.2 Econometric model
In the econometric section, we estimate a model that explains airport efficiency, measured by the residual (or net) variable factor productivity (rvfp) as a linear function of a set of potential business environmental variables. These variables include the country-level corruption index of the airport (CI), the airport’s ownership form (OF), an interaction between ownership and corruption, and a set of control variables (X). When the data structure is a sample of airports observed over several time periods (a panel dataset), the regression equation reads:
𝑟𝑣𝑓𝑝 !" = 𝛼 + 𝜆 𝐶𝐼!"+ 𝑶𝑭′!"𝛽 + (𝐶𝐼 !∗ 𝑶𝑭′!") 𝛾 + 𝑿′!"𝛿 + 𝜀!" (eq.1)
where rvfpit represents the residual (or net) variable factor productivity of airport i at time t. 𝐶𝐼!" corresponds to the country-level corruption index (CI) of airport i at time t and 𝑶𝑭′!" the ownership form.
We include an interation between the corruption index and ownership form, (𝐶𝐼!"∗ 𝑶𝑭!!") to capture the
effects of corruption under different types of ownership. 𝑿′𝒊𝒕 denotes a set of control variables that
potentially affect airport efficiency in addition to corruption, including the form of economic regulation that is prevalent across Europe, the level of competition across gateways and within the catchment area, whether the airport is used as airline hub and/or international gateway, whether the airport belongs to a group from a managerial perspective, and gross domestic product (GDP) per capita. Another set of controls including indicators of institutional quality variables, a proxy of openness to trade and a measure of the importance of government in the economy are added to test the robustness of our results.17 Ɛ
it refers
to an independent and identically distributed error term over the airport i and time t dimensions; 𝛼 is the regression’s intercept. The parameters 𝜆, 𝛽, 𝛾, 𝛿 represent the marginal effects of the explanatory variables. Given the panel structure of the equation, we estimate both pooled Ordinary Least Squares (OLS) and airport/time-specific random effects (RE) models. The pooled OLS model assumes common intercepts and slopes across airports and periods, and it produces consistent estimates when the data are poolable. 18 The random effects (RE) model assumes the intercept 𝛼 as being a random component. When appropriate, the RE estimator is usually better at capturing the individual and time heterogeneity and it can strongly improve the fit as compared to the pooled OLS model. Our econometric analysis also applies statistical tests that check the violation of fundamental hypotheses of the standard regression model
17 These variables are largely recognized in the literature as having a strong relationship with corruption.
18 Checking the poolability assumption requires a sample size that allows running individual time-series regressions or
cross-sectional yearly regressions, see Hsiao (1986, Chapter 2). In our case, the lack of degrees of freedom prevented us to perform individual time-series regressions.
5 (heteroscedasticity, autocorrelation and cross-sectional dependencies), which alters inference. We apply the required corrections when needed. Other tests are also conducted to compare the competing models and select the most appropriate one from a statistical viewpoint.
4. Data description
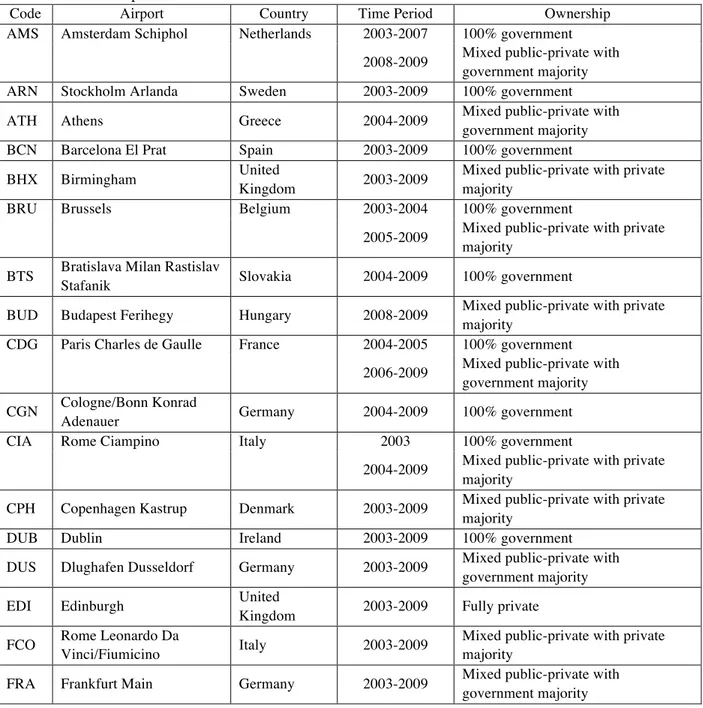
We compile data from 47 airports located in 27 European countries during the 2003-2009 period. The airport data comes from various sources including the International Civil Aviation Organization (ICAO), Airport Council International (ACI), International Air Transport Association (IATA) and airport annual reports. Some of the data was obtained directly from the airports. Table 1 lists the airports included in the sample as well as the form of ownership that governs each airport during the 2003-2009 period.
Table 1: List of airports
Code Airport Country Time Period Ownership
AMS Amsterdam Schiphol Netherlands 2003-2007 100% government
2008-2009 Mixed public-private with
government majority
ARN Stockholm Arlanda Sweden 2003-2009 100% government
ATH Athens Greece 2004-2009 Mixed public-private with
government majority
BCN Barcelona El Prat Spain 2003-2009 100% government
BHX Birmingham United
Kingdom 2003-2009
Mixed public-private with private majority
BRU Brussels Belgium 2003-2004 100% government
2005-2009 Mixed public-private with private
majority BTS Bratislava Milan Rastislav
Stafanik Slovakia 2004-2009 100% government
BUD Budapest Ferihegy Hungary 2008-2009 Mixed public-private with private
majority
CDG Paris Charles de Gaulle France 2004-2005 100% government
2006-2009 Mixed public-private with
government majority CGN Cologne/Bonn Konrad
Adenauer Germany 2004-2009 100% government
CIA Rome Ciampino Italy 2003 100% government
2004-2009 Mixed public-private with private
majority
CPH Copenhagen Kastrup Denmark 2003-2009 Mixed public-private with private
majority
DUB Dublin Ireland 2003-2009 100% government
DUS Dlughafen Dusseldorf Germany 2003-2009 Mixed public-private with
government majority
EDI Edinburgh United
Kingdom 2003-2009 Fully private
FCO Rome Leonardo Da
Vinci/Fiumicino Italy 2003-2009
Mixed public-private with private majority
FRA Frankfurt Main Germany 2003-2009 Mixed public-private with
6
GVA Geneva Cointrin Switzerland 2003-2009 100% government
HAJ Hannover-Langenhagen Germany 2009 Mixed public-private with
government majority
HAM Hamburg Germany 2003-2009 Mixed public-private with
government majority
HEL Helsinki Vantaa Finland 2003-2009 100% government
IST Istanbul Ataturk Turkey 2009 Mixed public-private with private
majority
KEF Keflavik Iceland 2007, 2009 100% government
LGW London Gatwick United
Kingdom 2003-2009 Fully private
LHR Heathrow United
Kingdom 2003-2009 Fully private
LIS Lisbon Portela Portugal 2003-2009 100% government
LJU Ljubljana Slovenia 2007-2009 Mixed public-private with
government majority
LTN London Luton United
Kingdom 2009
Mixed public-private with private majority
MAD Madrid Barajas Spain 2003-2009 100% government
MAN Manchester United
Kingdom 2003-2009 100% government
MLA Malta Malta 2003-2009 Mixed public-private with private
majority
MUC Munchen Germany 2005-2009 100% government
NAP Naples Italy 2009 Mixed public-private with private
majority
NCE Nice Cote d'Azur France 2009 100% government
ORY
Paris Orly France 2004-2005 100% government
2006-2009 Mixed public-private with
government majority
OSL Oslo Norway 2003-2009 100% government
PRG Prague Czech
Republic 2003-2007 100% government
RIX Riga Latvia 2004-2009 100% government
SOF Sofia Bulgaria 2004-2009 100% government
STN Stansted United
Kingdom 2003-2009 Fully private
SZG Salzburg Austria 2009 100% government
TLL Tallinn Estonia 2003,
2006-2009 100% government
TRN Turin Italy 2009 Mixed public-private with
government majority
TXL Berlin Tegel Germany 2007-2009 100% government
VIE Vienna Austria 2003-2009 Mixed public-private with
government majority WA
W Warsaw Frederic Chopin Poland 2003-2009 100% government
ZRH Zurich Switzerland 2003-2009 Mixed public-private with
7
Notes: Mixed public-private ownership with private majority indicates that private companies hold more than 50% of stakes. Mixed public-private ownership with government majority indicates that government holds more than 50% of stakes. 100% government is also called public corporation.
Among the sample of 47 airports during the 2003-2009 period, 5 were fully private, 7 were owned and/or operated by mixed public-private enterprises with private majority, 9 were owned and/or operated by mixed public-private enterprises with government majority, and 21 were owned and/or operated or by 100% government (or public corporations).
Five airports including Amsterdam Schiphol (AMS), Brussels (BRU), Rome Ciampino (CIA), Paris Charles de Gaulle (CDG) and Paris Orly (ORY) have experienced ownership and management restructuring during the period of concern. These airports were traditionally fully owned, managed and operated by governments. The majority of stakes of Rome Ciampino and Brussels airports were sold to private sector interests in 2004 and 2005, respectively. The management and ownership of Paris Charles de Gaulle, Paris Orly and Amsterdam Schiphol airports were transferred to mixed private-public enterprises with government majority in 2006, 2006 and 2008, respectively.
5. Description of variables
5.1 Variables in the efficiency analysis
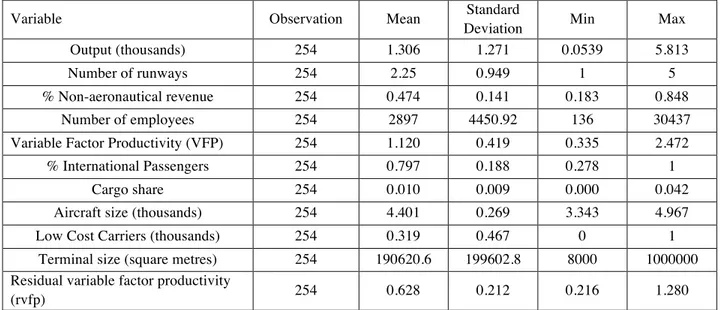
Details on the variables used for the efficiency analysis are summarized in Table 2. The output variables include the number of aircraft movements (ATMs), passenger volumes and non-aeronautical revenues. As for input variables, labor input, purchased goods and materials and purchased services (outsourcing and contracting out) are considered.
Table 2: Descriptive statistics of the variables used in the airport efficiency analysis
Variable Observation Mean Standard
Deviation Min Max
Output (thousands) 254 1.306 1.271 0.0539 5.813
Number of runways 254 2.25 0.949 1 5
% Non-aeronautical revenue 254 0.474 0.141 0.183 0.848
Number of employees 254 2897 4450.92 136 30437
Variable Factor Productivity (VFP) 254 1.120 0.419 0.335 2.472
% International Passengers 254 0.797 0.188 0.278 1
Cargo share 254 0.010 0.009 0.000 0.042
Aircraft size (thousands) 254 4.401 0.269 3.343 4.967
Low Cost Carriers (thousands) 254 0.319 0.467 0 1
Terminal size (square metres) 254 190620.6 199602.8 8000 1000000
Residual variable factor productivity
(rvfp) 254 0.628 0.212 0.216 1.280
Source: ATRS global airport performance benchmarking reports (2003- 2009). Units of measurement are in brackets.
5.2 Variables in the econometric analysis 5.2.1 Measures of corruption
8 Corruption, our main variable of interest, is defined as the misuse of public office for private gain (Svensson, 2005). We consider three indices of corruption drawn from three different sources: the corruption index computed by International Country Risk Guide (ICRG), Corruption Perception Index (CPI) provided by Transparency International and the Control of Corruption Index (CCI) delivered by the World Bank.19 All three indices are survey-based.
The ICRG corruption index captures the likelihood and the expectations that government officials will demand special payment in the form of "bribes connected with import and export licenses, exchange controls, tax assessment, police protection, or loans". Drawn from indicators assembled by panels of international experts, it evaluates corruption mainly within the political system. ICRG corruption index allows for comparison across countries and over time, therefore it is particularly well suited to our main objective. Besides, the ICRG corruption index is widely used in the economics literature (see for example, Knack and Keefer (1995), Dal Bò and Rossi (2007)). The original index ranges between zero (highly corrupt) and six (highly clean); so a higher corruption index corresponds to a less corrupt country.
Both CPI and CCI are composite indices. While CPI looks at corruption in the public sector, CCI considers corruption in both public and private sectors. CPI corresponds to the average of ratings reported by a number of perception-based sources and business surveys20 carried out by a variety of independent and reputable institutions. However, CCI is drawn from a large set of data sources including a diverse variety of survey institutes, think tanks, and non-governmental and international organizations. Contrary to ICRG corruption index, CCI and CPI lack “transitivity”. Their country rankings can change substantially as one adds or drops one or more countries from the sample.21 The original CPI scores countries on a scale from zero (highly corrupt) to ten (highly clean) while the original CCI scores range from -2.5 (highly clean) to 2.5 (highly corrupt).
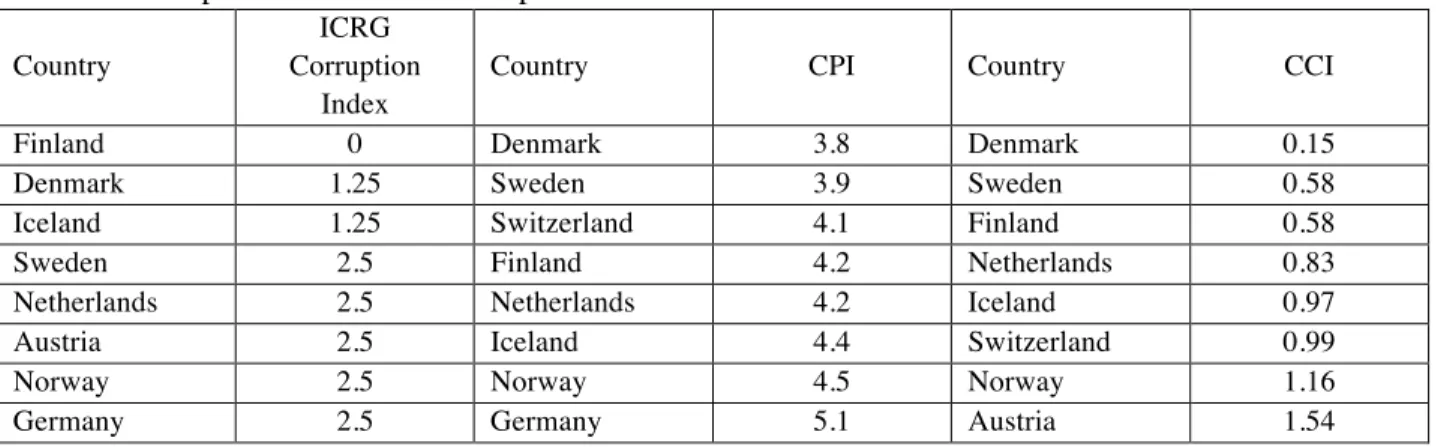
Since it is not meaningful to compare original scores generated by each source, the corruption scores are rescaled between 0 and 10 by setting the value for the most corrupt country at 10 and the least corrupt country at 0. Table 3 compares the three alternative corruption indices in 2009.
Table 3: Corruption Indices of the sample of countries - 2009
Country
ICRG Corruption
Index
Country CPI Country CCI
Finland 0 Denmark 3.8 Denmark 0.15
Denmark 1.25 Sweden 3.9 Sweden 0.58
Iceland 1.25 Switzerland 4.1 Finland 0.58
Sweden 2.5 Finland 4.2 Netherlands 0.83
Netherlands 2.5 Netherlands 4.2 Iceland 0.97
Austria 2.5 Iceland 4.4 Switzerland 0.99
Norway 2.5 Norway 4.5 Norway 1.16
Germany 2.5 Germany 5.1 Austria 1.54
19 This analysis focuses on country-level corruption. The subjective indices, which are derived from fully convincing
methodology, provide satisfactory country coverage during the 2003-2009 time period. In addition, the corruption perception surveys are relatively well suited to compare countries in terms of corruption because the sources all aim at measuring the degree of corruption, using identical methodology. Mauro (1995), Svensson (2006) discussed the validity and precision of subjective corruption indices.
20 The surveys include questions relative to the misuse of public power for private benefits such as bribery by public officials,
kickbacks in public procurement, embezzlement of public funds.
21 For more details on the methodology used by World Bank and Transparency International to compute CCI and CPI scores,
readers can refer to http://www.worldbank.org and http://www.transparency.org. We note that Transparency International has improved its methodologies to compute CPI index since 2012 in order to allow for comparison over times.
9
France 2.5 Ireland 5.1 Ireland 1.63
Belgium 2.5 Austria 5.2 Germany 1.71
Switzerland 3.75 United Kingdom 5.4 United Kingdom 2.03
United Kingdom 5 Belgium 6 Belgium 2.24
Portugal 5 France 6.2 France 2.31
Spain 5 Estonia 6.5 Portugal 3.00
Ireland 6.25 Slovenia 6.5 Slovenia 3.01
Malta 6.25 Spain 7 Spain 3.09
Estonia 7.5 Portugal 7.3 Estonia 3.25
Hungary 7.5 Malta 7.9 Latvia 3.29
Slovenia 7.5 Hungary 8 Malta 3.29
Poland 8.75 Poland 8.1 Poland 4.26
Italy 8.75 Latvia 8.6 Hungary 4.39
Slovakia 8.75 Slovakia 8.6 Slovakia 4.58
Turkey 8.75 Turkey 8.7 Turkey 4.94
Bulgaria 10 Italy 8.8 Greece 5.01
Greece 10 Bulgaria 9.3 Italy 5.14
Latvia 10 Greece 9.3 Bulgaria 5.54
Notes: ICRG Corruption Index is the International Country Risk Guide’s corruption indicator (average over 12 months). CPI is the Corruption Perception Index computed Transparency International and CCI compute the Control of Corruption Index by the World Bank. ICRG, CPI and CCI scores are rescaled so that each index ranges between 0 and 10, with a higher score indicating higher corruption and a lower score indicating lower corruption.
The country rankings and corruption scores are compared across the three sources. Regardless of the methodology used, Finland, Denmark, Sweden, the Netherlands and Iceland are the cleanest countries in our sample whereas Bulgaria, Greece, Italy, Turkey and Slovakia are the most corrupt countries. The country rankings in the top and bottom ranges of the scores are quite robust with respect to the methodology. By contrast, the country rankings in the middle ranges including Italy, Ireland and Poland rankings are more sensitive to the source used. Nonetheless, the three corruption indices are highly correlated with each other.22 The correlation between CCI and CPI is the highest, indicating that both indices yield rather similar country rankings.
5.2.2 Ownership form
The applied literature has established the influence of the ownership form on airports’ operating efficiency. We explore this finding for European airports by including the ownership form of airport i at time t in the model. We observe 4 types of ownership in our sample of airports including (1) fully private ownership (2) mixed public-private ownership with private majority (above 50%) (3) mixed public-private ownership with government majority (above 50%) (4) 100% government or public corporation ownership. However, due to the limited data, we combine fully private ownership and mixed public-private ownership with private majority.23 Thus, we categorize ownership forms according to: (1) mixed public-private ownership with public-private majority (including fully public-private) (2) mixed public-public-private ownership with government majority (above 50%) (3) 100% government or public corporation ownership. Ownership forms are modeled with the help of dummy variables. We denote mixed public-private ownership with
22 The correlation coefficients between ICRG index and CPI, ICRG index and CCI and CCI and CPI are 0.8803, 0.8875,
0.9662, respectively.
23 Seven of our sampled airports are owned and operated by mixed enterprises with private majority (50%) and five are fully
10 private majority as the reference category. We further enquire whether corruption has an effect that potentially depends on the ownership form by including interaction terms between corruption and ownership dummy variables.
5.2.3 Economic regulation and competition
Previous research has found that competition and economic regulation, individually or jointly affect airport efficiency (Chi-Lok, Yuen and Zhang, 2009; Assaf and Gillen, 2012; Malighetti et al., 2009; Adler and Liebert, 2014). Regarding economic regulation, airports in Europe are traditionally subject to rate of return or cost-based regulation. More recently there has been a trend towards implementing a form of incentive regulation — the price-cap regulation — when airports are privatized or semi-privatized (Gillen, Niemeier and Madrid, 2006). Both cost-based and price cap regulations can be set under a single or dual till regime. Following Adler and Liebert (2014), we classify the forms of airport economic regulation according to (1) no ex-ante regulation (2) single-till cost-plus regulation (3) dual-till cost-plus regulation (4) single-till price-cap regulation (5) dual-till price-cap regulation (6) charges set by airports (single and dual till).
The proxy of airport competition is defined in line with Adler and Liebert (2014). The variable is based on the number of commercial airports with at least 150 000 passengers per annum within a catchment area of 100 km around the airport. Two levels of competition are considered: strong and weak. An airport is assumed to be facing weak competition at the regional level if there is no more than one additional airport within the catchment area, and strong competition if there are at least two additional airports within the catchment area. In addition, a hub airport that serves as a regional or international gateway is classified as facing strong competition, regardless of its local catchment area. Due to the lack of information, we are not able to account for different product diversification strategies such as low cost carrier traffic. As Adler and Liebert (2014) pointed out, this measure of competition only indicates an upper level of likely competition across airports.
5.2.4 Airport characteristics
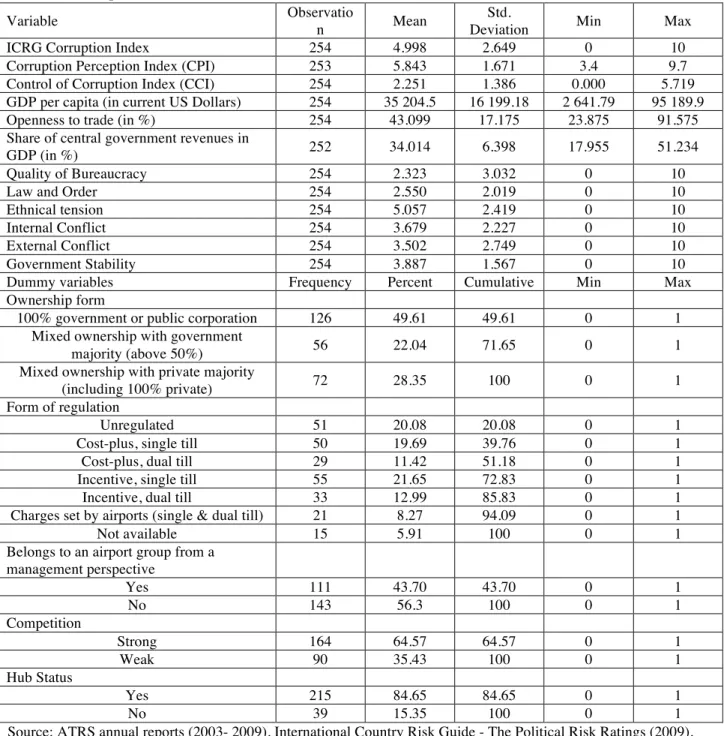
We include a set of control variables that capture the major characteristics of our sample of airports. These variables consist of the status of the airport as a hub and/or international gateway24, whether the airport belongs to a group from a managerial perspective, and the gross domestic product (GDP) per capita. The controls are included in the model with the help of dummy variables. GDP per capita would capture time and country-specific macroeconomic factors such as productivity shocks. Details on variables used in the econometric analysis are summarized in Table 1 in the Annex.
6. Empirical results
The first part consists of a discussion on airport efficiency results. In the second part, we analyze the impacts of corruption and other factors on the airport operating efficiency.
6.1 Estimates from the efficiency analysis
24 Hub airports may possess advantages in terms of efficiency because of their size and location, therefore we include a
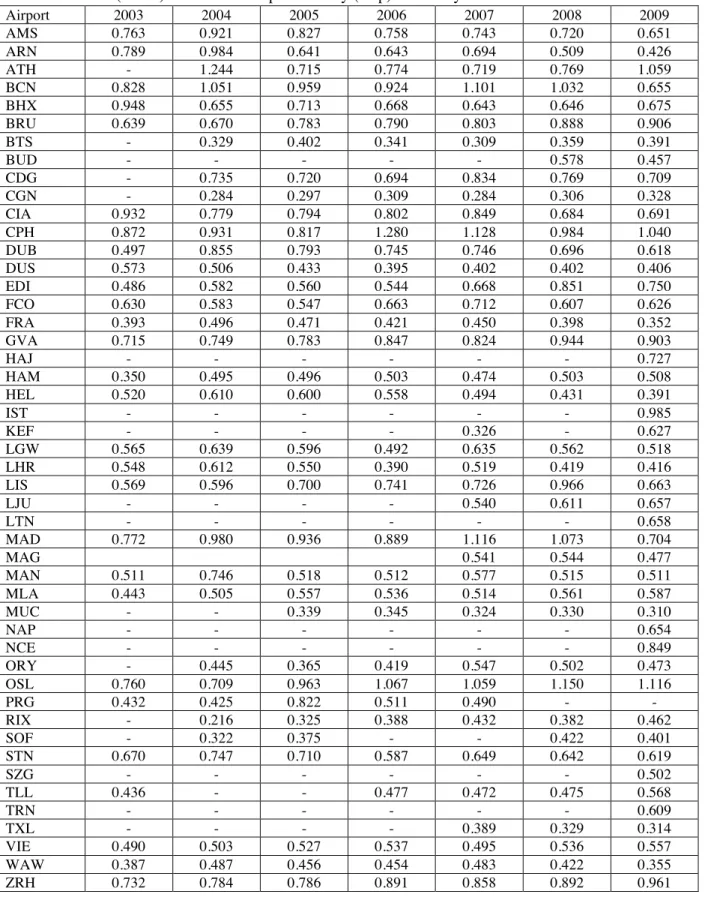
11 This study uses the residual (or net) variable factor productivity as a measure of airport operating efficiency. Efficiency scores of the sample of airports are listed in Table 4.
Table 4: Residual (or net) variable factor productivity (rvfp) efficiency scores
Airport 2003 2004 2005 2006 2007 2008 2009 AMS 0.763 0.921 0.827 0.758 0.743 0.720 0.651 ARN 0.789 0.984 0.641 0.643 0.694 0.509 0.426 ATH - 1.244 0.715 0.774 0.719 0.769 1.059 BCN 0.828 1.051 0.959 0.924 1.101 1.032 0.655 BHX 0.948 0.655 0.713 0.668 0.643 0.646 0.675 BRU 0.639 0.670 0.783 0.790 0.803 0.888 0.906 BTS - 0.329 0.402 0.341 0.309 0.359 0.391 BUD - - - 0.578 0.457 CDG - 0.735 0.720 0.694 0.834 0.769 0.709 CGN - 0.284 0.297 0.309 0.284 0.306 0.328 CIA 0.932 0.779 0.794 0.802 0.849 0.684 0.691 CPH 0.872 0.931 0.817 1.280 1.128 0.984 1.040 DUB 0.497 0.855 0.793 0.745 0.746 0.696 0.618 DUS 0.573 0.506 0.433 0.395 0.402 0.402 0.406 EDI 0.486 0.582 0.560 0.544 0.668 0.851 0.750 FCO 0.630 0.583 0.547 0.663 0.712 0.607 0.626 FRA 0.393 0.496 0.471 0.421 0.450 0.398 0.352 GVA 0.715 0.749 0.783 0.847 0.824 0.944 0.903 HAJ - - - 0.727 HAM 0.350 0.495 0.496 0.503 0.474 0.503 0.508 HEL 0.520 0.610 0.600 0.558 0.494 0.431 0.391 IST - - - 0.985 KEF - - - - 0.326 - 0.627 LGW 0.565 0.639 0.596 0.492 0.635 0.562 0.518 LHR 0.548 0.612 0.550 0.390 0.519 0.419 0.416 LIS 0.569 0.596 0.700 0.741 0.726 0.966 0.663 LJU - - - - 0.540 0.611 0.657 LTN - - - 0.658 MAD 0.772 0.980 0.936 0.889 1.116 1.073 0.704 MAG 0.541 0.544 0.477 MAN 0.511 0.746 0.518 0.512 0.577 0.515 0.511 MLA 0.443 0.505 0.557 0.536 0.514 0.561 0.587 MUC - - 0.339 0.345 0.324 0.330 0.310 NAP - - - 0.654 NCE - - - 0.849 ORY - 0.445 0.365 0.419 0.547 0.502 0.473 OSL 0.760 0.709 0.963 1.067 1.059 1.150 1.116 PRG 0.432 0.425 0.822 0.511 0.490 - - RIX - 0.216 0.325 0.388 0.432 0.382 0.462 SOF - 0.322 0.375 - - 0.422 0.401 STN 0.670 0.747 0.710 0.587 0.649 0.642 0.619 SZG - - - 0.502 TLL 0.436 - - 0.477 0.472 0.475 0.568 TRN - - - 0.609 TXL - - - - 0.389 0.329 0.314 VIE 0.490 0.503 0.527 0.537 0.495 0.536 0.557 WAW 0.387 0.487 0.456 0.454 0.483 0.422 0.355 ZRH 0.732 0.784 0.786 0.891 0.858 0.892 0.961
12
Notes: "-" indicates that the rvfp score of the airport for that year is not available in the dataset.
The scores vary from 0.216 (the least efficient) to 1.28 (the most efficient). The average efficiency score goes from 0.616 in 2003 to 0.613 in 2009, with around 42% of all airports categorized as relatively efficient.
Except for Brussels airport (BRU), none of the airports in the sample consistently improved their efficiency over time. Between 2003 and 2009, Brussels increased its score from 0.639 to 0.906. The private sector participation in the management and ownership of Brussels airport in 2005 may contribute to consistently maintain its improvement in terms of efficiency.
Amsterdam (AMS), Dublin (DUB), Stockholm (ARN) and Helsinki (HEL) airports enhanced their efficiencies between 2003 and 2004, but consistently exhibit an efficiency decrease between 2004 and 2009. By contrast, Paris Charles de Gaulle (CDG), Rome Fiumicino (FCO), Gatwick (LGW), Manchester (MAN), Paris Orly (ORY), Stansted (STN), Vienna (VIE) and Warsaw (WAW) airports appear to have relatively constant efficiency scores between 2003 and 2009. For some airports including Amsterdam, Paris Charles de Gaulle and Paris Orly, the minor participation of private sectors in the airport management and ownership does not necessarily lead to efficiency gains.
Copenhagen airport (CPH) is found as the most efficient airport among the sample of European airports between 2003 and 2009, with an average operating efficiency of 1.007. The top performers during the 2003-2009 period include Istanbul (IST), Oslo (OSL), Barcelona (BCN) and Madrid (MAD), with average efficiency scores of 0.985, 0975, 0.936 and 0.924, respectively. The airports of Cologne-Bonn (CGN), Munich (MUC), Berlin (TXL), Bratislava (BTS), Riga (RIX) and Sofia (SOF), by contrast, appear to be the least relatively efficient airports in the sample, with average scores less than 0.4. Cologne-Bonn suffers from excess airside capacities despite the extensive cargo operations resulting from its position as the European hub for Germanwings, FedEx Express and UPS Airlines (Adler and Liebert, 2014).
6.2 Econometric results
Statistical tests show that the Random Effect (RE) model is the most appropriate, and its Pooled OLS counterpart delivers similar results without providing efficiency gains in the estimates. 25 We notice in Table 5 that the RE model explains a much higher share of the total variance of the dependent variable (R
Squared) than the pooled OLS regression, and its Adjusted R Squared is much larger as well. Therefore,
the RE model is superior in terms of within-sample goodness-of-fit. The Fisher tests accept the absence of time-fixed effects in both pooled OLS and RE models, indicating that no common significant shocks have affected the efficiency of European airports during the period of scrutiny.26
We report the estimation results from the pooled OLS model in column (2) of Table 5 and the ones from the RE model in column (3). The estimation results from the RE model are used as the basis for our analysis. Given that both models display strong heteroscedasticity and autocorrelation in the residuals, robust standard errors are stated in parenthesis.27
Table 5: Estimation results using pooled OLS and Random Effects (RE) models
25 The Lagrangian Multiplier test for random effects displays a statistic of Fisher value of 161.32 and associated p-value of
0.000, indicating that Random effects model is preferred to Pooled OLS.
26 The statistics of Fisher (and their associated p-value) for Pooled OLS and RE models are 1.58 (0.174) and 6.91(0.329),
respectively indicating that we cannot reject the null hypothesis that year effects are insignificant.
13
Dependent variable: residual (or net)
variable factor productivity (rvfp) Pooled OLS Random Effects (RE)
Corruption Index (ICRG Index) -0.046*** -0.041***
(0.017) (0.018)
Ownership form Base: Mixed public-private ownership with private majority
Government majority (above 50%) -0.318*** -0.332***
(0.116) (0.098)
Public corporation (100%
government) -0.230** -0.254**
(0.111) (0.101)
Ownership form*Corruption Index
(ICRG Index) Base: Mixed public-private ownership with private majority * ICRG Index
Government majority* ICRG Index 0.064*** 0.048**
(0.023) (0.019)
Public corporation* ICRG Index 0.015 0.028
(0.018) (0.020)
Regulation Base: No ex-ante regulation
Cost-plus, single till 0.188** 0.136
(0.080) (0.092)
Cost-plus, dual till -0.093 -0.003
(0.084) (0.079)
Incentive, single till -0.040 -0.043
(0.057) (0.060)
Incentive, dual till -0.128* -0.097
(0.069) (0.069)
Charges set by airports (single &
dual till) 0.130 0.076
(0.080) (0.089)
Competition Base: Weak competition
Strong -0.177*** -0.097
(0.050) (0.060)
Status as a hub and/or international
gateway 0.082 0.039
(0.052) (0.060)
Airport group management dummy 0.064 0.045
(0.054) (0.051) GDP per capita 0.002** 0.002* (0.001) (0.001) Intercept 0.865*** 0.823*** (0.111) (0.128) R-Square 0.384 0.820 Adjusted R-Square 0.345 0.772 Number of observation 254 254
Notes: "***", "**", "*" denote statistical significance at the 1%, 5%, 10% levels, respectively. Robust standard error associated to each coefficient is stated in parenthesis. We dropped "mixed public-private ownership with private majority (including fully private)" dummy, "the interaction between mixed public-private ownership with private majority and corruption index", "no ex-ante regulation dummy" and "weak competition dummy" in all regressions to avoid multicollinearity.
14 First, we notice that the partial effects of the main variables of interest — corruption, ownership and the interaction terms between corruption and ownership — are highly significant in the RE model and that the signs and magnitudes remain rather robust in the pooled OLS model. Given that the influence of corruption on airport operating efficiency depends on the ownership form, we ran a regression of rvfp on the corruption index, the ownership dummies and the business environmental factors without including the interaction terms in the regression. We found no significant effects of corruption on rvfp.28 This stresses the importance of accounting for the interactions to uncover the effect of corruption on airport efficiency.
As shown in Table 5, the impact of corruption on airports’ efficiency is negative, and its effect is significant at the 1% level in both RE and pooled OLS specifications. This result suggests that corruption has a negative impact on airport efficiency under mixed public-private ownership with private majority (the default ownership category). Privately owned airports located in less corrupt countries operate more efficiently than the ones situated in more corrupt countries. An increase in one point29 in the corruption index decreases the residual (or net) variable factor productivity of 0.04 units. This negative influence of corruption on efficiency is consistent with previous literature in other sectors (see for example Dal Bò and Rossi (2007)). Indeed, corruption is found to lower productivity through a diversion of managerial efforts away from running productive activities. In a high corruption environment, airport managers would have more incentives to use bribes when they channel resources to establish lobbies and connections. Then, poor governance and culture of cronyism in highly corrupt countries spur managers of privately owned airports to focus less on airport productivity objectives, leading eventually to lower airport efficiency.
The effects of corruption on mixed public-private ownership with government majority and 100% government ownership are obtained by summing the estimated coefficient of the corruption index to the estimated coefficients’ vector of the interaction terms (i.e., 𝜆 + 𝛾 if we refer to eq.1). For each ownership category, the impact is significant if the sum is statistically different from zero. In the RE specification, mixed ownership with government majority displays a sum of 0.007, whereas fully public ownership exhibits a sum of -0.013. In both cases, the Fisher test30 concludes that the sum is not significantly different from zero at the required cutoffs. Corruption has no effects on the efficiency of both publicly owned airports.
In a high corruption environment, privately owned airports appear to operate less efficiently than publicly owned airports. This finding lines up with the work of Yan and Oum (2014) with respect to the autonomy of airport managers in allocating inputs. Yan and Oum (2014) argue that local tax revenues can fund the operations of a government-owned airport, and that the funding source restricts the airport’s flexibility to change inputs allocation. 31 By contrast, managers of privately owned airports have enough managerial autonomy to allocate inputs, so they can either pursue cost efficiency objectives or divert resources to their personal benefits. Therefore, managers of privately owned airports have more freedom to pursue personal goals via changing the allocation of inputs than those of publicly owned airports when corruption is high.
With respect to the ownership form, the estimation results reveal that privately owned airports generally provide higher efficiency scores than publicly owned airports. The effect of each ownership category is derived from the sum of the estimated coefficient of the ownership dummy and its interaction
28 We do not report here the estimation results for the sake of parsimony.
29 We need to be careful in the interpretation of these results. As pointed out by Mauro (1995), when using perception indexes,
it is not clear if the difference between the corruption grade of one and two is the same as between 4 and 5.
30 The Fisher statistics (and their p-values) for mixed ownership with government majority and 100% public ownership are
1.60 (0.206) and 0.58 (0.446), respectively. In both cases, the null hypothesis cannot be rejected, suggesting that the sum of the coefficients is equal to zero. Corruption has no effects on efficiency of both types of ownership.
15 with corruption index, (i.e. 𝛽 + 𝛾 if we refer to eq. 1). The sums for mixed public-private ownership with government majority and 100% government ownership are -0.284 and -0.227, respectively. The Fisher tests32 confirm the negative and highly significant coefficients for both majority and fully public ownership. These results suggest that publicly owned airports are less efficient than privately owned airports in a highly clean environment, in line with the findings of Oum, Adler and Yu (2006) and Oum, Yan and Yu (2008). Allowing the private sectors to hold a majority stake in the airport management and ownership would improve operating efficiency in a low corruption society. As such, a change from 100% government ownership to mixed public-private ownership with private majority would lead to an efficiency gain of 0.274. 33
The level of local and gateway competition appears to have no specific impact on airport efficiency, in line with Adler and Liebert (2014). This result may be explained by the approach used to define the level of competition. Chi-Lok and Zhang (2009) stressed that airports serve many different markets including long and short distance, transshipment, and origin-destination markets. However, we are not able to consider these different markets due to the lack of information. We thus may have ignored product diversification strategies.
The coefficients of the form of regulation dummies vary across models but are not always statistically significant. In the pooled OLS specification, airports subject to cost-plus regulation with single till appear to be more statistically efficient than unregulated airports, while the ones subject to incentive regulation with dual till seem to be statistically less efficient. The RE model delivers different estimation results — none of the dummies are statistically significant — indicating that there is no difference between regulated and unregulated airports in terms of operating efficiency. Though some studies including Assaf and Gillen (2012), Adler and Liebert (2014) have emphasized the importance of accounting for the interaction between ownership, regulation and competition to explain airport operating efficiency, our study is limited to the analysis of the effects of corruption. Thus, we may have ignored the interaction between ownership, competition and regulation.34
The status as hub and/or international gateway of the airport is not statistically significant in both Pooled OLS and RE models. This provides some indication that most of the hubs in our sample do not possess size and location advantages. We also find no significant impact of multi-airport management on airport efficiency, suggesting that airports included in our sample may not exploit economies of scale and learning effects when they operate with multiple units in the same region. Our findings do not support the argument by Malighetti, Martini, Paleari and Redondi (2009).
At each stage of the estimation, we include time effects in the model, but the time effects were formally rejected in all cases. We note that the residual (or net) variable factor productivity already accounts for time effects.35 Therefore, different shocks that potentially affect airport efficiency including the 9/11 terrorist attacks or the 2008 financial crisis should be captured by the rvfp index.36 The coefficient
32 The Fisher statistics (and their p-values) for mixed ownership with government majority and 100% public ownership are
12.11 (0.0005) and 7.42 (0.006), respectively. These statistics confirm the rejection of the null hypothesis, indicating that the sum of the coefficients is different from zero. Both types of ownership have significant impacts on airport efficiency.
33 The efficiency gain from privatization is obtained by using a regression of rvfp on ownership form dummies and other
explanatory variables, and setting the “100% government” ownership as the reference category. Thus, the effect of a change in the ownership from 100% government to mixed public-private ownership with private majority on rvfp is explained by the estimated coefficient of the mixed ownership with private majority.
34 This study focuses on the effects of corruption on airport operating efficiency. Competition, regulation and ownership
variables are included in the model as control variables.
35 In computing the rvfp index, we exclude factors that are beyond managerial control including year dummies.
36 As result of the terror attacks, security requirements were legally altered in Europe, requiring substantial investments on the
16 of GDP per capita is positive and always statistically significant at the 10% level, suggesting that airports operating in more developed countries are more efficient in general.
7. Robustness checks
7.1 Using additional sets of control variables
In order to ensure the robustness of our results, we extend the controls in the 𝑋!" matrix of our equation
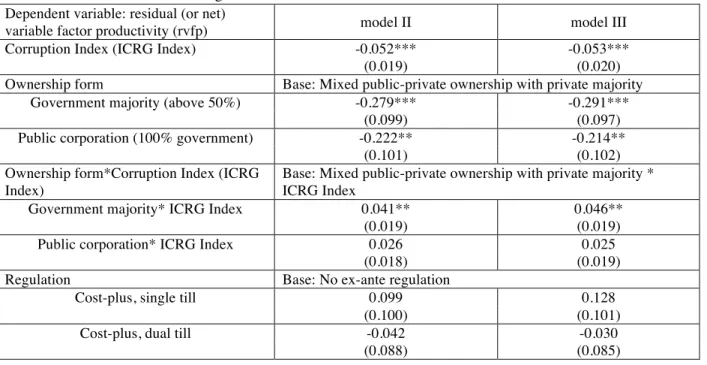
(eq.1) to add country-specific institutional quality variables. This model is dubbed model II in Table 6. Lambsdorff (2003) emphasizes that corruption includes many different types of behavior, and decomposing it into governance-related subcomponents can identify the channels through which it affects productivity. Mauro (1995) argues that the efficiency of institutions is relevant for any firm operating in the country of interest, since they are assessed independently of macroeconomic variables. Therefore, we include government stability, quality of bureaucracy, internal and external conflict and law and order as indicators of institutional quality variables. 37 In model III of Table 6, another set of controls is added to
model II: a proxy of openness to trade (share of imports in GDP) and a measure of the importance of
government in the economy (share of central government revenues in GDP). The latter regressors are largely recognized in the literature as having a strong relationship with corruption. 38 Table 6 shows the estimation results using random effects specification. Robust standard errors are in parenthesis.39
Table 6: Estimation results using additional control variables
Dependent variable: residual (or net)
variable factor productivity (rvfp) model II model III
Corruption Index (ICRG Index) -0.052*** -0.053***
(0.019) (0.020)
Ownership form Base: Mixed public-private ownership with private majority
Government majority (above 50%) -0.279*** -0.291***
(0.099) (0.097)
Public corporation (100% government) -0.222** -0.214**
(0.101) (0.102)
Ownership form*Corruption Index (ICRG Index)
Base: Mixed public-private ownership with private majority * ICRG Index
Government majority* ICRG Index 0.041** 0.046**
(0.019) (0.019)
Public corporation* ICRG Index 0.026 0.025
(0.018) (0.019)
Regulation Base: No ex-ante regulation
Cost-plus, single till 0.099 0.128
(0.100) (0.101)
Cost-plus, dual till -0.042 -0.030
(0.088) (0.085)
37 We follow the definitions proposed by ICRG to specify the institutional quality variables. Bureaucratic quality signals the
independence of administration from political pressure, the use of established mechanisms for recruiting and training, and the strength and expertise of government services. Government stability defines the government's ability to carry out its declared program(s) and its ability to stay in office. Law evaluates the strength and impartiality of the legal system while the Order scores the popular observance of the law. Ethnic tension considers the degree of tension within a country attributable to racial, nationality, or language divisions. Internal conflict evaluates political violence in the country and its actual or potential impact on governance whereas external conflict scores the risk to the incumbent government from foreign action, ranging from non-violent external pressure to violent external pressure.
38 See for example Mauro (1995), Dal Bò and Rossi (2007)
39 Since all models display strong heteroscedasticity and autocorrelation in the residuals, we employ cluster-robust standard
17
Incentive, single till -0.084 -0.048
(0.074) (0.070)
Incentive, dual till -0.135* -0.117
(0.076) (0.075)
Charges set by airports (single & dual till) -0.024 0.036
(0.106) (0.094)
Competition Base: Weak competition
Strong -0.150** -0.126*
(0.074) (0.073)
Status as a hub and/or international
gateway 0.091 0.060
(0.065) (0.064)
Airport group management dummy 0.025 0.021
(0.062) (0.062)
GDP per capita 0.002 0.002
(0.001) (0.001)
Institutional quality variables
Quality of Bureaucracy 0.008 0.008
(0.009) (0.008)
Law and Order 0.016 0.013
(0.022) (0.022) Ethnic tension -0.003 -0.005 (0.010) (0.010) Internal conflict 0.009 0.011 (0.010) (0.011) External conflict 0.009 0.012 (0.011) (0.010) Government Stability 0.003 0.003 (0.005) (0.005) Openness to trade - -0.002 (0.001)
Share of central government revenues - 0.005
(0.005)
Intercept 0.699*** 0.792***
(0.225) (0.139)
Number of observations 252 254
Notes: "***", "**", "*" denote statistical significance at the 1%, 5%, 10% levels, respectively. Robust standard error associated to each coefficient is stated in parenthesis. We dropped "mixed public-private ownership with private majority (including fully private)" dummy, "the interaction between mixed public-private ownership with private majority and corruption index", "no ex-ante regulation dummy" and "weak competition dummy" in all regressions to avoid multicollinearity.
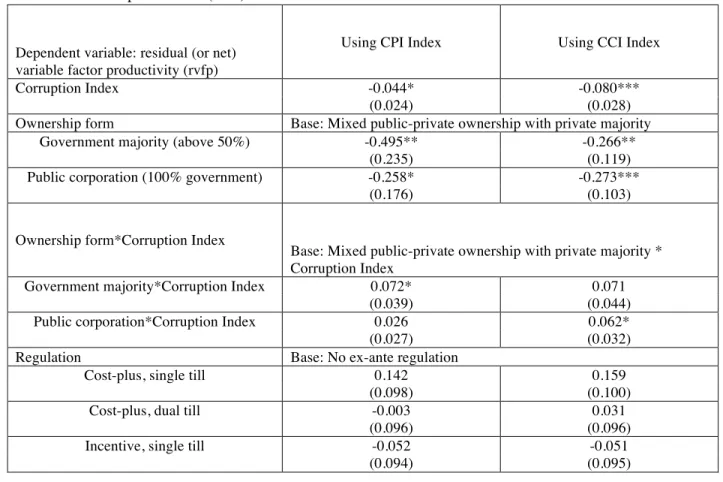
The former results remain valid whatever the control variables, and in almost all extended models, the corruption impact on airport efficiency remains negative and significant at the 1% significance level. The negative coefficients of mixed public-private ownership with government majority and 100% government ownership confirm that privately owned airports are the most efficient in the absence of corruption. The interaction term between corruption index and mixed ownership with government majority keeps its positive and significant impact at the 5% level in both extended models. However, the statistical tests indicate that the overall effects of corruption on publicly owned airports including 100% and majority government owned airports remain insignificant.
The effects of the form of regulation, competition level, hub status and airport group management dummies remain statistically insignificant. GDP per capita does not appear to have significant impacts.