1
Assessing potential impacts of shale gas development on shallow
1aquifers through upward fluid migration: A multi-disciplinary
2approach applied to the Utica Shale in Eastern Canada
34
Rivard, C.1*, Bordeleau, G.1, Lavoie, D. 1, Lefebvre, R. 2, Ladevèze, P. 1,2, Duchesne, M.J.
5
1, Séjourné, S.3, Crow, H. 4, Pinet, N. 1, Brake, V. 1, Bouchedda, A.2, Gloaguen, E. 2, Ahad,
6
J.M.E. 1, Malet, X. 1, Aznar, J.C. 2, Malo, M. 2
7
8
1 Geological Survey of Canada, Natural Resources Canada, 490 rue de la Couronne, Québec, 9
Québec, G1K 9A9, Canada 10
2 Institut national de la recherche scientifique – Centre Eau Terre Environnement, 490 rue de la 11
Couronne, Québec, Québec, G1K 9A9, Canada 12
3 Enki GéoSolutions Inc., Montréal, Québec, H2V 4K7, Canada
13
4 Geological Survey of Canada, Natural Resources Canada, 601 Booth Street, Ottawa, Ontario,
14
K1A 0E8, Canada 15
16
* Correspond author: christine.rivard@canada.ca 17
18 19 20
2 Abstract
21
Potential impacts of shale gas development on shallow aquifers has raised concerns, 22
especially regarding groundwater contamination. The intermediate zone separating 23
shallow aquifers from shale gas reservoirs plays a critical role in aquifer vulnerability to 24
fluid upflow, but the assessment of such vulnerability is challenging due to the general 25
paucity of data in this intermediate zone. The ultimate goal of the project reported here was 26
to develop a holistic multi-geoscience methodology to assess potential impacts of 27
unconventional hydrocarbon development on fresh-water aquifers related to upward 28
migration through natural pathways. The study area is located in the St. Lawrence 29
Lowlands (southern Quebec, Canada), where limited oil and gas exploration and no shale 30
gas production have taken place. A large set of data was collected over a ~500 km2 area 31
near a horizontal shale gas exploration well completed and fracked into the Utica Shale at 32
a depth of 2 km. To investigate the intermediate zone integrity, this project integrated 33
research results from multiple sources in order to obtain a better understanding of the 34
system hydrodynamics, including geology, hydrogeology, deep and shallow geophysics, 35
soil, rock and groundwater geochemistry, and geomechanics. The combined interpretation 36
of the multi-disciplinary dataset demonstrates that there is no evidence of, and a very 37
limited potential for, upward fluid migration from the Utica Shale reservoir to the shallow 38
aquifer. Microbial and thermogenic methane in groundwater of this region appear to come 39
from the shallow, organic-rich, fractured sedimentary rocks making up the regional aquifer. 40
Nonetheless, diluted brines present in a few shallow wells close to and downstream of a 41
normal fault revealed that some upward groundwater migration occurs, but only over a few 42
hundred meters from the surface based on the isotopic signature of methane. The 43
3 methodology developed should help support regulations related to shale gas development 44
aiming to protect groundwater. 45
Keywords: shale gas, intermediate zone, aquifer vulnerability, upward fluid migration 46 47 1 Introduction 48 49 1.1 Context 50 51
The current pace of economic development is placing increasing demands on the 52
exploitation of natural resources such as unconventional hydrocarbons, minerals and 53
geothermal energy. These deep subsurface industrial activities are complex and may have 54
significant environmental impacts, notably on freshwater aquifers used for water supply. 55
So far, shallow aquifer vulnerability related to activities carried out at great depths 56
(including hydraulic fracturing) has been the object of a limited number of studies, mainly 57
because 1) the possibility of upward fluid migration through natural preferential pathways 58
is perceived by some as being highly improbable and is still the object of an ongoing 59
scientific debate (Vengosh et al., 2014; Birdsell et al., 2015; Lefebvre, 2017) and 2) very 60
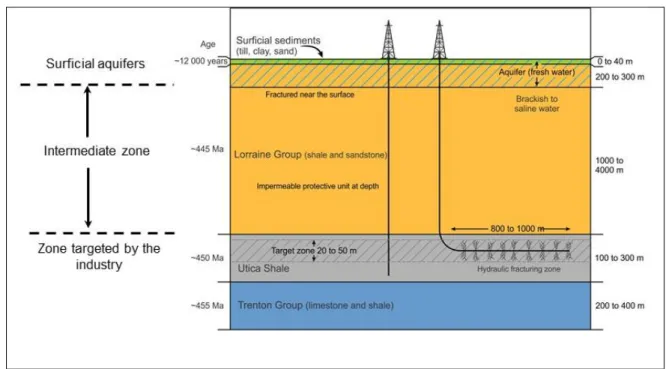
little information is available on the intermediate zone, located below shallow aquifers and 61
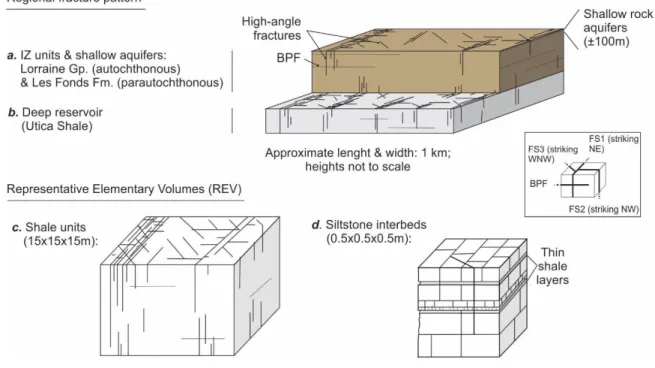
above the zone targeted by the hydrocarbon industry (see Figure 1). It is, however, 62
generally accepted that a natural connection between shallow and deep formations may be 63
possible if large-scale permeable discontinuities (such as fault zones) are present across 64
4 this intermediate zone, constituting preferential migration pathways (Gassiat et al., 2013; 65
Kissinger et al., 2013; Vengosh et al., 2014; Raynauld et al., 2016; Lefebvre, 2017). The 66
expression of vertical fluid migration is difficult to directly visualize in continental settings. 67
However, in marine environments, pockmarks and venting hydrocarbons in the water 68
column are commonly observed and represent useful indicators of active upward fluid 69
migration (Pinet et al., 2008). 70
One of the major societal concerns regarding the development of deep-seated 71
unconventional oil and gas is the risk of shallow groundwater contamination due to upward 72
migration of post-fracturing flowback fluids and hydrocarbons from deep geological 73
formations (Vengosh et al., 2014; Vidic et al., 2013; BAPE 2014; CCA 2014; EPA 2016). 74
This concern is even stronger in regions where aquifers represent the main water supply 75
and where hydrocarbon development has not yet taken place (Raynauld et al., 2016). As a 76
result, these perceived environmental issues have sometimes led to moratoria on hydraulic 77
fracturing, such as in eastern Canada and northeastern USA, while in other areas (mostly 78
where oil and gas production has been on-going for decades), concerns and regulatory 79
efforts focussed on how to minimize or mitigate impacts (Esterhuyse, 2017). 80
A number of studies have been conducted to examine the potential for fluid migration from 81
deep unconventional reservoirs to surficial freshwater aquifers. Although leakage from 82
faulty casings appears to be the main mechanism by which gas could migrate from depth 83
(Dusseault and Jackson; 2014; Nowamooz et al., 2014; Soeder et al., 2014; Ryan et al., 84
2015; Sherwood et al., 2016; Lefebvre, 2017), several authors have stressed the need for a 85
better understanding and representation of potential preferential flow pathways (Gassiat et 86
al., 2013; Kissinger et al., 2013; Birdsell et al., 2015; Reagan et al., 2015; Grasby et al., 87
5 2016; Raynauld et al., 2016). Most of these studies have assessed the processes and 88
conditions that could lead to upward fluid migration using numerical modelling based on 89
generic conditions that may not represent the specific context of a given area. 90
On the other hand, many studies looking for indications of impacts on shallow aquifers 91
have relied almost exclusively on geology and groundwater geochemistry and isotopes 92
(e.g., Osborn et al., 2011; Warner et al., 2012; Jackson et al., 2013a; Molofsky et al., 2013; 93
Darrah et al., 2014; McIntosh et al., 2014; McMahon et al., 2014; Moritz et al., 2015; Siegel 94
et al., 2015; Humez et al., 2016; Nicot et al., 2017a, 2017b & 2017c). Early studies had 95
suggested a link between groundwater quality and the distance to shale gas wells (Osborn 96
et al., 2011; Jackson et al., 2013a), which had led to a scientific debate about the occurrence 97
or not of such groundwater degradation. More recent studies in regions with or without 98
shale gas exploitation have concluded that hydraulic fracturing and shale gas exploitation 99
cannot be directly related to groundwater quality degradation (Siegel et al., 2015; Humez 100
et al., 2016; LeDoux et al., 2016; Sherwood et al., 2016; Harkness et al., 2017; McMahon 101
et al., 2017; Nicot et al., 2017a, 2017b & 2017c). Harkness et al. (2017) have stressed that 102
controversies related to the potential for contamination from hydraulic fracturing have 103
likely stemmed in large part from the lack of predrilling datasets (including a 104
comprehensive suite of geochemical tracers), emphasizing the need to develop an 105
understanding of the critical factors controlling the presence of elevated levels of 106
hydrocarbon gas and salts in many aquifers located above shale gas reservoirs. McMahon 107
et al. (2017) also warned that shale gas exploitation is a recent activity compared to the 108
long residence time of groundwater, which may imply that today’s absence of detectable 109
impact does not mean that no impact would be observed in the long term. 110
6 While organic and inorganic groundwater geochemistry (including isotopes) represents a 111
powerful tool, it relies on phenomena that are already happening and cannot be used only 112
by themselves to fully understand, predict or eventually avoid potential contaminations 113
from deep units. Therefore, groundwater geochemistry and isotopes should be 114
complemented with other direct and indirect data to obtain a better knowledge and 115
understanding of the intermediate zone, including its fracturing, its hydrogeological 116
properties, its ability to transfer fluids and thus, its integrity. Industry-driven rock 117
geochemistry, geomechanical and geophysical characterization have almost exclusively 118
focussed on the deep hydrocarbon reservoir in an attempt to characterize and improve 119
hydrocarbon recovery, thereby largely ignoring the intermediate zone. The need for 120
research on the role of natural fractures and faults as pathways for methane and other fluids 121
to reach shallow aquifers has been stressed by Ryan et al. (2015). 122
In spite of a significant recent increase in research on potential impacts of deep resource 123
exploitation to shallow groundwater quality, there is currently no scientific consensus on 124
how to assess these impacts based on the specific context of a basin or shale gas 125
exploitation area. This highlights the importance of collecting scientific data to increase 126
knowledge, inform debates and provide tools to help regulators protect and manage 127
groundwater resources in areas where unconventional hydrocarbon resources are exploited. 128
In an effort in this regard, a holistic integrated study aiming to assess potential impacts of 129
shale gas activities on shallow aquifers in the St. Lawrence Lowlands (southern Quebec, 130
Canada) was initiated in 2012. This region only experienced limited exploration activities 131
with no commercial production. The purpose of this study was to investigate a 500 km2
132
area and evaluate whether its geological context presents a risk of aquifer contamination 133
7 prior to any potential large-scale drilling and fracturing activities. It was deemed critical to 134
assess aquifer vulnerability to fluid upflow related to deep subsurface unconventional 135
hydrocarbon exploitation in this frontier play, because groundwater is the local major 136
source of water supply and strong societal protests against hydraulic fracturing had 137
occurred. Since few data were available on the intermediate zone, in addition to 138
conventional geological data our approach for this project involved the use of multi-source 139
indirect data from different disciplines such as geophysics, geomechanics, hydrogeology, 140
and rock and groundwater geochemistry. Extensive fieldwork was carried out including 141
shallow well drilling (30 to 150 m deep), sampling of groundwater, soil, core and drill 142
cuttings, shallow seismic surveys, borehole logging in shallow wells, airborne 143
electromagnetic survey, structural surveys, hydraulic tests in sediments and bedrock, and 144
groundwater monitoring. Multiple electric logs from shale gas wells as well as deep seismic 145
profiles were also re-evaluated. 146
This paper presents an overview of the entire project and shows how diverse data types 147
were integrated to assess the potential for fluid upflow from the unconventional shale gas 148
reservoir. Sections 3 to 6 of this paper thus present an overview of the work carried out in 149
each discipline, including its objective, fieldwork, methods used to interpret the acquired 150
data and main results. Readers are referred to peer-reviewed papers on these specific 151
studies to obtain more details. The understanding of the system hydrodynamics gained 152
from the integration of results is discussed in section 7. A synthesis of other work that did 153
not lead to useful results is provided in the Supplementary information. 154
The anticipated outcomes of this work were two-fold: 1) assess potential impacts of shale 155
gas development on shallow aquifers through the identification of possible natural 156
8 connections between deep and shallow geologic formations in the Saint-Édouard study 157
area and 2) contribute to the development of a methodology that could be used to assess 158
aquifer vulnerability relative to deep subsurface activities, which could serve as a basis for 159
regulatory frameworks aiming to minimize the potential impacts to aquifers. To our 160
knowledge, this is the first time that such an aquifer vulnerability assessment is made on 161
the basis of specific local and regional conditions. 162
163
1.2 Description of the study area 164
165
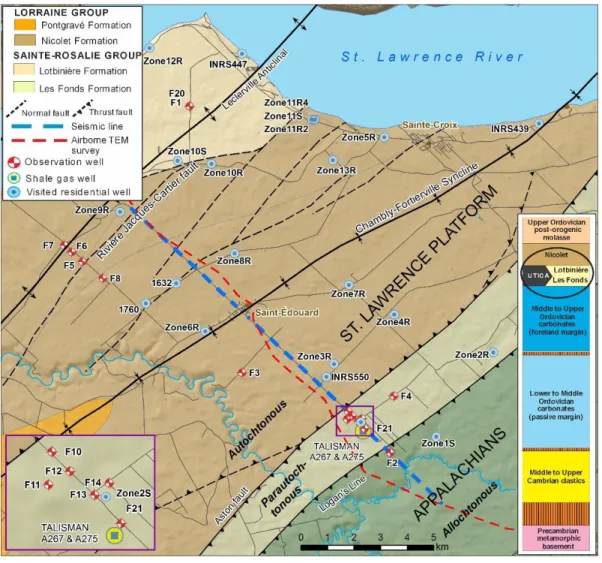
The study area is located in the St. Lawrence Lowlands in southern Quebec (Canada), in 166
the Saint-Édouard region, on the south shore of the St. Lawrence River, about 65 km 167
southwest of Quebec City (Figures 2 and 3). The study area overlies the Upper Ordovician 168
Utica Shale, which was explored from 2007 to 2010 to assess its potential for shale gas 169
production. Talisman Energy (now Repsol Oil & Gas Canada Inc.) drilled two wells in this 170
area: one vertical, A267, and one horizontal, A275 (Figure 3). The horizontal well was the 171
most promising one drilled in the Utica Shale in southern Quebec with post-fracking initial 172
gas production of 340000 m3/day (12 Mcf/d), which stabilized to 170000 m3/day (6 173
Mcf/d) after 25 days (Thériault, 2012). 174
The Utica Shale is part of the St. Lawrence Platform and extends over more than 10000 175
km2 (Figure 2). Only 28 shale gas exploration wells were drilled over this vast area, of 176
which 18 were hydraulically fractured, before the de facto shale gas exploration 177
moratorium came into force in 2010 (Lavoie et al., 2014). Due to this limited number of 178
9 wells, the Utica Shale is considered a frontier play and, therefore, the St. Lawrence 179
Platform is generally viewed as a “virgin” area with respect to hydraulic fracturing. 180
The topography of the ~500 km2 study area shown on Figure 3 is relatively flat, having an 181
elevation of nearly 90 m at the foot of the Appalachian piedmont, where well F2 was drilled 182
(1.5 km south of the Talisman A267 and A275 wells), to ~30 m close to the St. Lawrence 183
River. A ~20 m escarpment borders the south shore of the St. Lawrence River. Mean 184
monthly temperatures vary between -11˚C (in January) and 19˚C (in July). Annual total 185
precipitation is ~1170 mm, with about 23% falling as snow. Most residential wells in this 186
area are open holes in the naturally fractured sedimentary rocks and have a steel casing 187
across surficial sediments. Well depths vary from 20 to 80 m (average of ~50 m) and the 188
wells are either under confined or semi-conditions (Ladevèze et al., 2016; Ladevèze, 2017), 189
which allow them to be better protected against potential contamination from the surface 190
(such as spills) than unconfined aquifers. The water table is relatively shallow in these low-191
permeability shales, ranging from 8.5 m deep to flowing artesian. The piezometric map 192
(Ladevèze et al., 2016) shows that groundwater generally follows the topography, flowing 193
from the Appalachians towards the St. Lawrence River. 194
195
2
Geological context
196197
2.1 Regional geological context 198
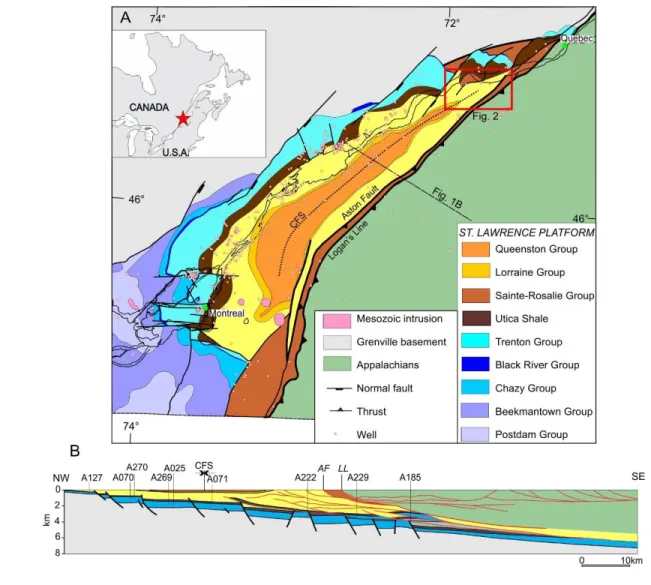
10 In southern Quebec, a Cambrian – Ordovician sedimentary succession is preserved in the 200
St. Lawrence Platform (Fig. 2) The succession records the evolution of the rift to passive 201
margin and the final foreland basin events developed at the southern margin of the 202
Paleozoic Laurentia craton (Lavoie, 2008; Lavoie et al., 2012). 203
In the upper 2 km depth of the study area, black organic-rich mudstones (Utica Shale and 204
Sainte-Rosalie Group) are capped by shallowing-upward flysch (Lorraine Group) (Lavoie, 205
2008). The Utica Shale is dominated by calcareous black shales with minor siltstone and 206
is overpressured (BAPE 2010; Chatellier et al., 2013). 207
The St. Lawrence Platform strata are sub-horizontal and locally affected by mesoscopic 208
open folds. High-angle generally SE-dipping normal faults displace in a staircase fashion 209
the Precambrian basement and the St. Lawrence platform succession up to the Utica Shale 210
with increased thickness of the sedimentary package on the downthrown fault block 211
(Castonguay et al., 2010; Séjourné et al., 2013) (Fig. 2). These faults are exposed along the 212
NW edge of the St. Lawrence platform (Fig. 3) and extend to the SE below the Appalachian 213
tectonic wedge. Previous geological interpretations (Konstantinovskaya et al., 2009; 214
Castonguay et al., 2010) suggested that normal faults do not extend in flysch and molasse 215
units (Lorraine, Sainte-Rosalie and Queenston groups). The St. Lawrence Platform is 216
bounded to the southeast by a deformed zone where Middle to Upper Ordovician platform 217
units are imbricated in several compressive thrust panels; this zone is known as the 218
parautochthonous domain (St-Julien et al., 1983; Castonguay et al., 2010). The Aston Fault 219
marks the contact between the largely undeformed autochthonous St. Lawrence Platform 220
and the parautochthonous domain (Figs. 2 and 3). The contact of the parautochthonous 221
domain with the Appalachians corresponds to a regional low-angle thrust fault known as 222
11 the Logan’s Line, which marks the position of the westernmost reach of allochthonous 223
units (St-Julien et al., 1983; Castonguay et al., 2010) (Figs. 2 and 3). East of the Logan’s 224
Line, Paleozoic rocks of the Appalachians are steeply-dipping and involved in overturned 225
NW-verging folds (Clark and Globensky, 1973). 226
227
2.2 Saint-Edouard geological setting 228
229
Surficial sediments in the Saint-Édouard area are usually thin (< 10 m) and made up of 230
reworked tills and near-shore sediments of the former Champlain Sea, except in a few areas 231
where fine-grained marine sediments have accumulated in local lows of the paleo-232
topography (Légaré-Couture et al., 2018; Rivard et al., 2018a). 233
Outcrops are sparse in this region, with the best sections exposed along the cliff on the 234
shore of the St. Lawrence River and along small creeks (Clark and Globensky, 1973). The 235
surface geology of the area consists of Upper Ordovician clastic-dominated units of the 236
Lorraine Group (Nicolet and Pontgravé formations) and of the Sainte-Rosalie Group 237
(Lotbinière and Les Fonds formations) (Fig. 3). The Lotbinière, Nicolet and Pontgravé 238
formations are part of the St. Lawrence Platform (Fig. 3), whereas the Les Fonds Formation 239
belongs to the parautochthonous domain (Fig. 3). The Lotbinière, Les Fonds and Nicolet 240
formations consist of more or less calcareous mudstone and siltstone; these three units 241
display variable content of organic matter and were shown to be in the oil window (Lavoie 242
et al., 2016). 243
12 The area is characterized by several regional faults, which could hypothetically act as 244
potential natural or enhanced migration pathways for deep fluids. The St. Lawrence 245
Platform is cut by the Rivière Jacques-Cartier (RJC) normal fault system (Fig. 3), which 246
limits the Lotbinière Formation to the southeast. The RJC fault is a lateral equivalent of the 247
major Yamaska Fault (Fig. 2) and has significant vertical throw (see below). The Aston 248
and Logan NW-verging thrust faults in the southeastern part of the study area limit the 249
parautochthonous domain where the Les Fonds Formation is present. Between the RJC and 250
Aston faults, the Upper Ordovician succession consists of the Nicolet Formation (Fig. 3). 251
The Upper Ordovician Utica Shale is considered hosting a significant volume of 252
hydrocarbons (Dietrich et al., 2011; Chen et al., 2014 & 2017). Based on seismic (Lavoie 253
et al., 2016) and hydrocarbon exploration well data (Thériault, 2012), the Utica Shale is 254
present at variable depths in the study area: it was intercepted by wells at relatively shallow 255
depths in the northern part of the area (271 m to 580 m) and at greater depths in the southern 256
part (1857 m in the Saint-Édouard Talisman well). In all the wells, the Utica Shale is either 257
stratigraphically overlain by the Nicolet Formation or structurally overlain by the Les 258
Fonds Formation. The characteristics of each formation is provided in Lavoie et al. (2016). 259 260
3
Seismic reflection
261 262 Objective 26313 2-D seismic surveys were used to investigate whether faults in the Saint-Édouard region 264
reach the surface or not, as the latter could form primary control on fluid migration 265
pathways and may act as hydraulic conduits connecting the shallow and deep subsurface 266
(Caine et al., 1996; Faulkner et al., 2010; Bense et al., 2013). Seismic data consisted in one 267
set of industry data originally collected in the early 1970s and reprocessed by Talisman 268
Energy during the late 2000s, and two sets of near-surface data collected specifically for 269
this project. The three seismic data sets aimed at being complementary by providing 270
seismic images with different vertical resolutions of various depth intervals from the 271
unconventional reservoir up to the surface. 272
In-house reprocessing of the industry data aimed at enhancing the resolution of the upper 273
~2 km bedrock reflections. However, acquisition parameters for the industry survey were 274
set to image targets approximately located 1800 to 2800 m below the surface. Therefore, 275
the first ~500 m were poorly imaged and difficult to interpret. New shallow seismic surveys 276
were carried out to obtain key information on the near surface extensions of faults to 277
complement the available industry survey. Acquired seismic lines thus included areas of 278
the moderately dipping Logan’s Line and Aston thrust fault, and the steeply dipping RJC 279
normal fault (Figures 2 and 3). At the regional scale, these structural features are relatively 280
well documented in the deep subsurface (Konstantinovskaya et al., 2009; Castonguay et 281
al., 2010; Thériault, 2012), but their potential near-surface extension remains equivocal in 282
the Saint-Édouard area. Shallow seismic surveys also aimed to help in positioning 283
observation wells in or near faulted zones, so as to compare the permeability and 284
groundwater quality of these zones with those of surrounding areas. 285
Fieldwork and methods
14 Shallow seismic surveys were performed using two types of vibrating sources: the Minivib 287
(20-310 Hz) typically used for groundwater studies in unconsolidated sediments and the 288
Envirovib (20-110 Hz) tentatively used in this project to fill the imaging gap between 50 289
and 500 m. The Minivib was operated in the horizontal inline-mode (H1) and P and S 290
arrivals were recorded using a 37.5 m long landstreamer equipped with 48 3-Component 291
stations with a 0.75-m spacing (Pugin et al., 2009). The Envirovib was operated in vertical-292
mode and P-arrivals were recorded using one 480 m-long landstreamer including 96 293
vertical-component stations with a 5-m spacing. In the Saint-Édouard area, a total of 18 294
km and 15 km of shallow seismic data were collected respectively with Minivib and the 295
Envirovib in 2013 and 2014. 296
Results
297
Results from the shallow seismic surveys were heavily impacted by the high velocity 298
contrasts between the free surface (P-wave velocity of 300 m/s) or the thin Quaternary 299
cover (P-wave velocity of 800 to 1700 m/s) and Paleozoic rocks (St. Lawrence Lowlands 300
and Appalachians; P-wave velocity of 3800 to 4200 m/s). This high velocity contrast 301
located at or almost at the free surface converts most of the seismic energy into surface 302
waves, impairing shallow bedrock reflection imaging from low energy and high-frequency 303
seismic sources. Despite these difficult geological conditions for seismic acquisition, the 304
contact between the thin veneer of unconsolidated sediments and the bedrock was 305
adequately imaged with the Minivib using P and S-waves recorded on the vertical and H1 306
components of the station. All data parametrization attempts and filtering processes did not 307
allow the Envirovib survey to be interpreted with confidence as this source simply lacked 308
the energy to go beyond the strong velocity contrast that characterizes the first interface. 309
15 Therefore, given the specific near surface geological conditions, the shallow seismic 310
surveys failed to locate the surface extension of faults imaged by the deep seismic survey. 311
A new subsurface interpretation of the area, below ~500 m, was made possible through the 312
reprocessing of the industry deep seismic profile (Fig. 4a). The end-product confirmed the 313
overall architecture of the Paleozoic successions and imaged the geometry of the St. 314
Lawrence Platform and parautochthonous domain in greater details compared to most 315
publicly-available vintage seismic lines (Lavoie et al., 2016). Several fault splays 316
belonging to the RJC fault zone could be traced with confidence, some of which possibly 317
extending to the near surface. These faults could represent potential fluid migration 318
pathways, as shown by red arrows in Figure 4b. The geometry of the Appalachians SE of 319
the Logan's Line remains poorly resolved by seismic data, due to structural complexity 320
(Lavoie et al., 2016). 321
322
Based on the interpretation of the deep seismic (and due to a lack of good-quality data from 323
the shallow seismic surface), four observation wells were drilled and five residential wells 324
were sampled on both sides of the mapped normal fault potentially extending to the surface 325
to obtain hydrogeological and geochemical information (see sections 5 and 6). 326 327
4
Geomechanics
328 Objective 32916 A geomechanical study was carried out using petrophysical wireline logs from shale gas 330
exploration wells in the Saint-Édouard area. The objective was to estimate geomechanical 331
properties for the Utica Shale and the overlying intermediate zone, so as to identify the 332
presence or absence of barriers to the propagation of hydraulic fractures towards the 333
surface. To calibrate these values, laboratory geomechanical tests of core samples from the 334
Lorraine Group and Utica Shale from the shale gas well had been planned. Unfortunately, 335
these laboratory tests did not provide reliable results. Therefore, they are only briefly 336
described in the Supplementary information section and discussed in Séjourné (2016). 337
Data and Methods
338
Publically available LAS digital files were integrated into the software Petra®, while DLIS 339
files provided by Talisman Energy, containing all recorded data during logging campaigns, 340
were used to verify the integrity and comprehensiveness of the LAS files and to 341
occasionally complement them. Available data included gamma ray, caliper, density 342
porosity, neutron porosity, resistivity curves, photoelectric factor, P and S waves, as well 343
as bulk density and its correction curve. For a few wells, spectral gamma ray and 344
mineralogy logs were also available. 345
Three shale gas exploration wells in or close to the study area had a complete borehole 346
logging dataset and were thus used for this work: Saint-Édouard, Leclercville and 347
Fortierville (Séjourné, 2016 & 2017). Acoustic logs (P and S waves) were used to derive 348
elastic properties such as Poisson’s ratios and Young’s modulus. An acoustic brittleness 349
index was derived from these two properties and a mineralogical brittleness index was 350
derived from the mineralogy logs to better understand the observed variations between the 351
17 Utica Shale and its sedimentary cover. Subsequently, five additional conventional 352
hydrocarbon exploration wells (drilled between 1972 and 1979) for which S-waves were 353
not available were also used to extend the spatial coverage (Séjourné, 2017). To this 354
purpose, a synthetic S-wave was generated for these wells and synthetic elastic modules 355
were then calculated, allowing the estimation of the geomechanical properties. 356
Results
357
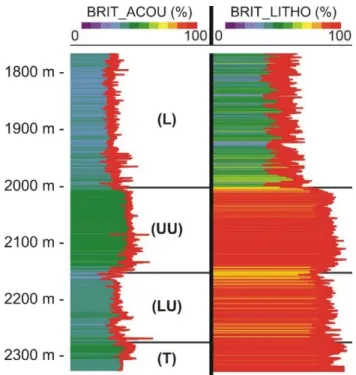
Values for Young’s modulus and Poisson’s ratios show that a large mechanical contrast 358
exists between the brittle calcareous Utica Shale and more ductile clayey shales of the 359
Lorraine Group. This relationship is best exemplified by the brittleness indexes shown in 360
Figure 5, where a sharp contrast is observed at the contact between the upper part of the 361
Utica Shale and the base of the Lorraine Group. Figure 5 also illustrates the good agreement 362
between results obtained from acoustic and mineralogy logs. During hydraulic fracturing, 363
the propagation of induced fractures within the more brittle Utica Shale would be severely 364
limited or even stopped by these overlying ductile units. The geomechanical study thus 365
strongly suggests that units of the intermediate zone (Lorraine Group) represent an efficient 366
barrier to the propagation of hydraulic fractures, thus providing a good protection for the 367
shallow groundwater aquifers. Nonetheless, these geomechanical property values remain 368
indicative and qualitative, and should be taken with caution in absence of calibration with 369
laboratory tests (see the Supplementary information section and Séjourné, 2017). 370
18
5
Hydrogeology
372 373
Hydrogeological fieldwork included the drilling of 15 observation wells, borehole logging 374
of these wells, hydraulic tests in wells and permeability tests in surficial deposits. 375 376 5.1 Well drilling 377 Objective 378
Drilling of 15 observation wells into the regional fractured rock aquifer provided cuttings 379
or core samples and groundwater samples in key locations. These wells provided 380
information about stratigraphy, hydraulic conductivity and natural fractures. Locations of 381
observation wells were strategically chosen to gain information, first on specific areas to 382
improve spatial and formation coverage and second in the vicinity of mapped fault zones, 383
whose positions are uncertain. 384
Fieldwork
385
Of the fifteen observation wells that were drilled, seven were hammer drilled (F5, F6 and 386
F10 to F14) and eight were diamond drilled (F1 to F4, F7, F8, F20 and F21). Characteristics 387
of these wells are provided in Ladevèze et al. (2016) and Table S-1 of the Supplementary 388
information and their location is shown in Figure 3. The diamond-drilled wells provided 389
core samples for stratigraphic assessment and organic geochemistry. Observation wells 390
have a depth range of 30 to 147 m and they are all open in bedrock. Each well was 391
19 instrumented with a datalogger to record water levels and. three of these wells were also 392
equipped with barometers. 393 394 5.2 Fracture characterization 395 Objective 396
The main purposes of acquiring data on natural fractures were to characterize the geometry 397
of the fracture network affecting the sedimentary succession in the Saint-Édouard region 398
and to assess the continuity of structural features from deep to shallow units. Information 399
on fractures were derived from bedrock outcrops, shallow observation wells through 400
borehole geophysical logging, and three shale gas exploration wells using Formation Micro 401
Imager (FMI) logs for depths exceeding 560 m. Since this project aims to assess the 402
potential for upward fluid migration from the shale gas reservoir to surficial aquifers, the 403
study of fracture networks was a key component. 404
Fieldwork
405
Shallow borehole logging was carried out in 11 observation wells. This work aimed to 406
collect data on fractures (orientation, dip and aperture), bedrock lithology, compressional 407
(P) and shear (S) wave velocities in the bedrock, fluid temperature and electrical 408
conductivity, as well as identify zones of fracture flow. The suite of tools consisted of 409
natural gamma-ray and guard resistivity, optical and acoustic televiewers, full waveform 410
sonic logs, fluid temperature, fluid conductivity, and heat-pulse flowmeter. Since ambient 411
flow (i.e. natural upward/downward gradients in borehole fluid) was not observed in any 412
well, an impeller (Grundfos Redi-Flo 2) pump was used to induce upward flow in boreholes 413
20 for the heat pulse flowmeter testing. Data on fractures (orientation, density, spacing, cross-414
cutting relationships) were also collected from 15 bedrock outcrops, mainly located close 415
to the St. Lawrence River (Ladevèze, 2017; Ladevèze et al., 2018a). 416
Methods
417
Fractures identified using borehole geophysical logging were classified as open, closed or 418
broken zones. Open and broken features were further classified as “flowing” based on flow 419
indications. . P- and S-wave velocities were computed from full waveforms using a 420
semblance processing routine to obtain slowness (µs/m) of P and S waves, and calculate 421
velocity logs (details are available in Crow and Ladevèze, 2015). 422
FMI images were used to examine fracture densities, fracture types (open or closed) and 423
orientations. Estimates of apertures from these images were provided by Talisman Energy. 424
Imaged vertical sections for the three shale gas wells varied from 560 m to 2320 m deep, 425
but were mostly located in the lower part of the Lorraine Group and in the underlying Utica 426
Shale and (below 1500 m). Images of horizontal sections for each shale gas well, drilled 427
into the Utica Shale, over lengths varying from 920 to 1000 m, were also available. 428
Chronology of fractures was based on intersection relationships and through fold test in 429
order to calculate the fracture attitudes prior to folding events. Fracture spacing was also 430
estimated to characterize the spatial organization of these structures using variograms. 431
Results
432
Four fracture sets were defined: three vertical sets (FS1, FS2 and FS3) and one sub-433
horizontal, corresponding to bedding plane fractures (BPF). FS1 and FS2 are orthogonal 434
21 to each other and to the bedding planes. They can be found everywhere throughout the 435
shallow and deep intervals, however in shale units they seem to be clustered in “corridors”, 436
while in siltstone beds they are more uniformly spatially distributed. Fractures from FS3 437
are more sparsely distributed and were mainly observed in the Utica Shale. BPF could only 438
be observed at shallow depths, but are assumed to be present deeper, based on other studies 439
examining shale successions (Gale et al., 2007; Gale et al., 2015; Wang and Gale, 2016). 440
Based on the similarities between the shallow and deep fracture datasets and also based on 441
the regional geologic and tectonic history, it was assumed that the fracture network 442
characterization could also be applied to the intermediate zone (Ladevèze et al., 2018a). 443
Figure 6 presents conceptual models of the fracture network for the entire sedimentary 444
succession of the Saint-Édouard area. 445
Fracture data obtained from the shallow and deep intervals revealed that most fractures are 446
open in the shallow rock aquifer, while very few fractures are open at depth. Most of these 447
shallow fractures are present within the first 60 m of the rock, and especially the upper 30 448
m (Ladevèze et al., 2018b). At depth, fractures from only one fracture set (FS1) were found 449
to be quite commonly open in the shale gas reservoir (21% of all FS1 fractures), and thus, 450
by extension, very likely in the intermediate zone. FMI images also showed that the 451
calcareous and brittle Utica Shale is more densely fractured than the Lorraine Group units 452
(Séjourné, 2017). Denser fracture networks were, however, observed in the close vicinity 453
of some of the thrust faults, with fractures generally oriented in the same direction as the 454
FS1 fracture set. Implications of their presence on groundwater flow are discussed in 455
section 5.3. 456
22 5.3 Hydraulic properties, groundwater flow and confinement conditions
458
Objective
459
Hydraulic conductivities (K) of shallow and deep rock formations were estimated to better 460
understand the system hydrodynamics and to define hydrogeological conditions, as well as 461
the role of fractures in groundwater flow. For the shallow intervals, K values were acquired 462
through in situ hydraulic tests and theoretical equations were used for the deep interval. 463
The goal for the deep interval assessment was to propose a semi-quantitative estimate of 464
hydraulic properties based on available data and to develop a conceptual model of the 465
fracture network to make a preliminary assessment of potential upward fluid migration 466
through these structural features. 467
Fieldwork
468
In situ hydraulic tests were carried out in shallow observation wells using slug tests.
469
However, the least permeable wells (10-8 m/s or less, see Table S-1 in Appendix) were 470
instead pumped for a short period using a low-yield impeller pump (Grunfos Rediflo2) to 471
avoid very large drawdowns that would have taken weeks to recover (see details in 472
Ladevèze et al., 2016). 473
Water-level and barometric measurements were recorded every 15 minutes using pressure 474
transducers (dataloggers). The purposes of acquiring these data series were 1) to help 475
define confinement conditions and 2) to estimate aquifer recharge for wells under 476
unconfined conditions. 477
Methods
23 Hydraulic conductivities (K) for the shallow observation wells were estimated from slug 479
tests using two interpretation methods (Bouwer and Rice, 1976; Hyder et al., 1994). Both 480
methods provided similar results. For the deep interval, hydraulic properties (porosity and 481
hydraulic conductivity) were estimated based on fracture apertures, fracture spacing and 482
density (see representative elementary volumes in Fig. 8) integrated in the cubic law 483
assuming laminar flow between two parallel plates (Snow, 1968; Bear, 1993). Porosity was 484
estimated as a percentage of the fracture volume in a quasi-impermeable matrix, based on 485
available fracture characteristics and estimates of inter-cluster (or inter-corridor) distance. 486
Results
487
Hydraulic conductivities (K) of the shallow interval, which is the active groundwater flow 488
zone (upper 60 m of the rock aquifer), range between 2x10⁻⁹ and 1x10⁻⁵ m/s. The 489
geometrical mean is higher in the autochthonous domain (1.8x10⁻⁶ m/s) than in the other 490
two domains (2.3x10⁻⁷ m/s). In addition, the range of values in the parautochthonous and 491
allochthonous domains is wider than in the autochthonous domain. Restricted to the upper 492
part of the Lorraine Group, siltstone beds are less than 10 cm thick and they are present in 493
meter- to decameter-thick intervals; they are densely fractured (see Figure 6). Hydraulic 494
tests have not indicated different permeabilities close to known (mapped) faults compared 495
to those of the adjacent domain. Since open fractures in the shallow aquifer can locally 496
display some large apertures, the fracture network significantly contributes to the total 497
porosity of the rock mass (which is approximately 8%). 498
As very few fractures are open at depth and generally belong to a single set (FS1, see 499
section 5.2), these fractures should not increase significantly the shale porosity and 500
24 permeability, and hence should not favour fluid circulation because the possibility for 501
fracture interconnection is very limited. Moreover, clay-gouge was observed in cores of 502
shale gas wells drilled in the thrust fault zone (Ladevèze, 2017); therefore, given the shale 503
- siltstone dominated succession in the entire study area, the presence of clay-gouge in the 504
undrilled normal fault zone is strongly suspected due to the presence of potential secondary 505
inverse-compressive fault-anticlines suggested from the reprocessed seismic line over the 506
trace of the RJC fault (Lavoie et al., 2016). Therefore, flow across fault zones is considered 507
very unlikely in this region. Within the deep intervals (intermediate zone and Utica Shale), 508
very low hydraulic conductivities (K) in the order of 10-12-10-18 m/s were estimated with 509
the cubic law. These values are in agreement with values found in the literature for the 510
Lorraine Group and Utica Shale (BAPE 2010; Séjourné et al., 2013). 511
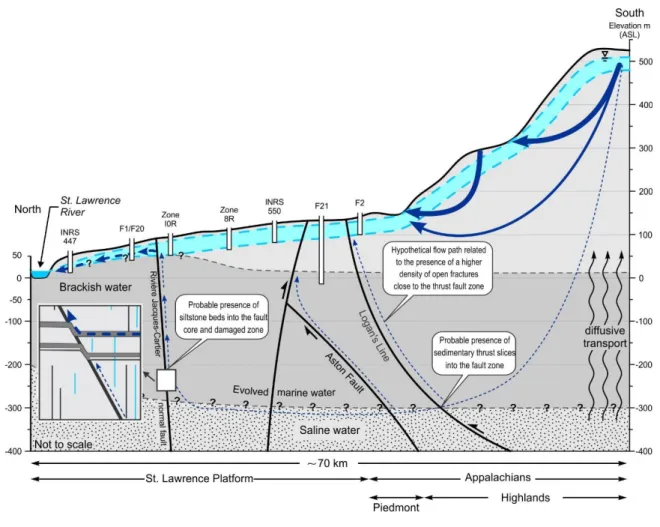
While estimated hydraulic conductivities are very low, two features could possibly locally 512
increase permeability in the two fault zones of the study area. In the thrust fault zone, open 513
fractures were found to be more frequent in the damage zone surrounding the fault planes. 514
However, they are also mainly in the same direction as fractures from FS1, hence limiting 515
possible fracture interconnections. In the normal fault zone, siltstone beds, which are more 516
permeable than shale strata and appear to be relatively frequent in the upper part of the 517
Lorraine Group (Lavoie et al., 2016), were inferred to have been dragged into the core of 518
the normal fault (Ladevèze, 2018b), an assumption based on data from abandoned (old) 519
hydrocarbon exploration well logs, various geological descriptions and geochemical 520
findings (see section 6.1). This possible increase in permeability could not, however, be 521
quantified, as no hydraulic data are available at depth in this region. Pressure gradient data 522
for the shallow intermediate zone is not available either, although it is well known that the 523
25 deeper Utica Shale is overpressured (Chatellier et al., 2013; Séjourné et al., 2013; 524
Konstantinovskaya et al., 2009). Nevertheless, the possibility that these fault zones act as 525
large-scale flow pathways seems extremely unlikely (Ladevèze et al., 2018b). 526
527
6
Geochemistry
528 529
The groundwater and rock geochemistry study mainly focussed on the characterization of 530
hydrocarbons (concentration and isotopic composition) from observation wells. These 531
results were compared to the organic geochemistry data from the deep Utica Shale. 532 533 6.1 Groundwater geochemistry 534 Objective 535
As the main objective of the project was to investigate the potential for upward fluid 536
migration from the shale gas reservoir to freshwater aquifers, it was crucial to sample and 537
analyze shallow groundwater to see if it contained thermogenic gas and, if so, to determine 538
its provenance. Isotopic geochemistry is a valuable tool to investigate the origin (microbial 539
or thermogenic) of methane and its possible relation with the shale gas reservoir. Therefore, 540
a multi-isotope approach was used, which included both stable and radioactive isotopes. 541
Fieldwork and analyses
26 Groundwater was sampled from 14 of the 15 observation wells (well F14, located in the 543
thrust fault zone and likely in gouge, remained dry throughout the duration of the project), 544
as well as in 30 residential wells in order to obtain a better spatial coverage. Among the 44 545
sampled wells, seven were sampled regularly over a period of up to 2.5 years at intervals 546
between one to four months (see section 6.3). Groundwater was sampled at specific 547
targeted depths in observation wells, where borehole geophysics had previously located 548
flowing fractures. 549
Observation wells were sampled using a low-flow yield according to the EPA guidelines 550
(Puls and Barcelona, 1996) using a submersible pump (either an impeller or a bladder 551
pump), or HydraSleeve bags for the deepest well (F21). These sampling techniques 552
provided similar results when tested systematically in 10 wells over three sampling 553
campaigns (Rivard et al., 2018b). Residential wells were also sampled at a low yield from 554
an outdoor tap, prior to any treatment. Samples for alkane concentrations and isotopic 555
composition were collected under a head of water (method described in Bordeleau et al., 556
2018a, 2018b & 2018c), which minimizes degassing but does not prevent it completely 557
when methane is effervescent (Molofsky et al., 2016). Hence, when downhole 558
concentrations are above the methane saturation point at atmospheric pressure, measured 559
concentrations are expected to be underestimated compared to true downhole 560
concentrations. 561
Groundwater samples were collected and analysed for a wide variety of compounds 562
including major and minor ions and trace metals, alkane concentrations (C1 to C3), VOCs,
563
stable isotope composition of water (δ2H and δ18O) and of methane, ethane and propane
564
(C1 to C3-δ13C and -δ2H; when concentrations allowed), dissolved inorganic carbon
27 δ13C), 222Rn, tritium (3H), as well as radiocarbon (14C) in methane and DIC, and finally
566
36Cl. Some of these analyses are quite atypical for this type of project (e.g., 36Cl, CH 4-14C)
567
and they provided important information on groundwater age and hydrocarbon source. 568
Analytical methods used in the different laboratories are described in details in Bordeleau 569
et al. (2018a, 2018b & 2018c). 570
Results
571
Groundwater, which is generally potable in the region (based on metal, anion and VOC 572
results), was classified into four water types according to the dominant cation and anion(s) 573
in the samples. They are, in order of geochemical evolution: Ca-HCO3, Na-HCO3,
Na-574
HCO3-Cl and Na-Cl (Figure 7). There is no particular pattern in the spatial distribution of
575
water types in the study area; instead, transitions occur vertically, and hence the major ion 576
geochemistry is mostly related to sampling depth. Chemical evolution first occurs through 577
ion exchange with the aquifer matrix, and additional salinity is gained through mixing with 578
residual water of the Late Quaternary Champlain Sea water, which invaded this area 579
between 13,000 and 11,000 years ago (Occhietti and Richard, 2003). While the bulk of the 580
water in all water types is consistent with a meteoric origin (based on H2O-δ2H and -δ18O
581
values), the contribution of Champlain Sea residual water to salinity in the Na-HCO3-Cl
582
and Na-Cl water types throughout the study area is confirmed by a chloride to bromide 583
(Cl/Br) molar ratio close to the seawater ratio of 639 (Hounslow, 1995). Another source of 584
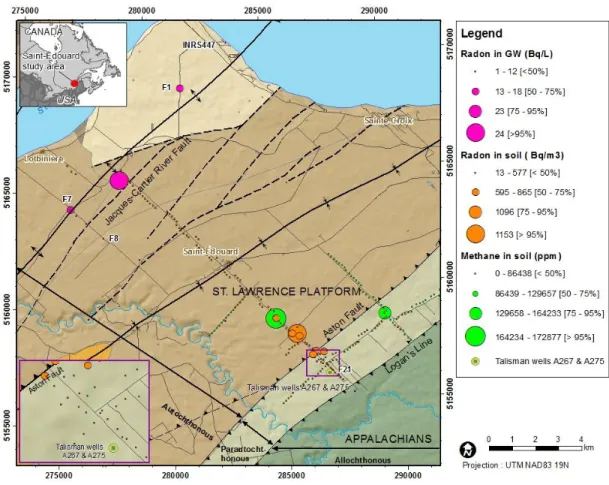
salinity that was identified in a few wells is formation brines, as even small amounts of 585
these saline brines cause a high salinity in the samples, accompanied by a Cl/Br ratio well 586
below that of seawater. 587
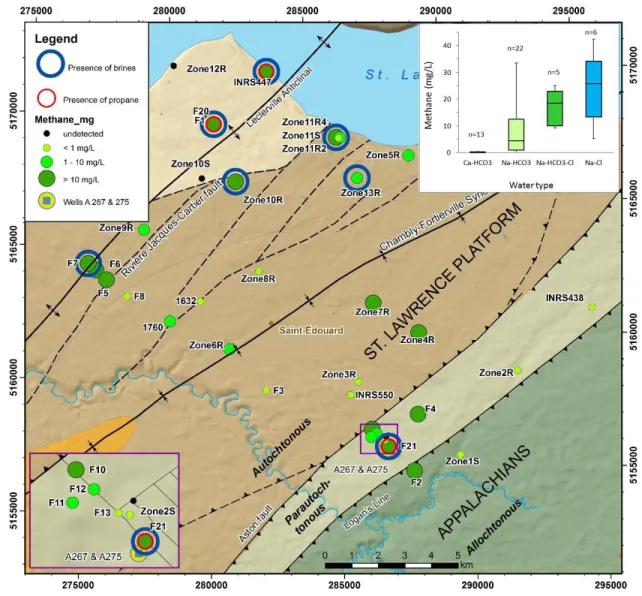
28 Samples with clear indication of deep formation brines were found to be located mainly 588
close to (F5, F7, Zone 10R, Zone 11R2) or downstream (F1, F20, INRS-447) of the normal 589
fault zone (Figure 7), suggesting that it acts as a discharge zone for deep regional 590
groundwater flow (Bordeleau et al., 2018a, and section 7.1). Analyses of radioisotopes in 591
samples from the bottom of wells F7 and F20 confirmed the very old apparent (bulk) age 592
of this water, in the order of nearly 2 million years (based on 36Cl values), with no 593
contribution (F7) or very little contribution (F20) of modern recharge (based on 3H and
594
DIC-14C values). Groundwater radon analyses (222Rn) did not show any abnormally high 595
values in the study area (the highest being 24 Bq/L), but the highest values were found 596
close to the normal fault zone or downstream of it (Bordeleau et al., 2018c, and Figure S1 597
of the Supplementary Information section). 598
Dissolved methane was found to be ubiquitous in the study area, being detected in 96% of 599
the sampled wells. The median concentration for all visited wells was 4.9 mg/L, with values 600
in individual samples ranging from below detection limit (<0.006 mg/L) to 82 mg/L 601
(Bordeleau et al., 2018a). The large spatial variations cannot be explained by differences 602
in bedrock geology (Figure 7), but are strongly correlated to the water type and by 603
extension, to the sampling depth and groundwater age (Bordeleau et al., 2018a). Higher 604
methane concentrations were found in Na-rich evolved water, an observation in agreement 605
with many other studies (Molofsky et al., 2013 and 2016; Darrah et al., 2014; Moritz et al., 606
2015; LeDoux et al., 2016; Siegel et al., 2015). A few wells also had significant 607
concentrations of ethane and propane, which is an indication of the presence of 608
thermogenic gas, since microbes can only produce very small amounts of these two 609
molecules (Tazaz et al., 2013). 610
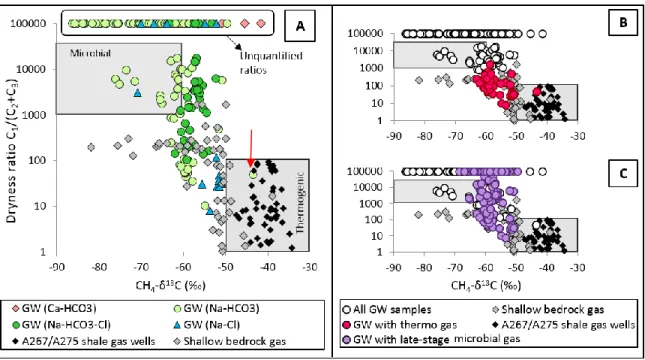
29 The origin of the natural gas found in groundwater can be ascertained from various 611
geochemical graphs. The commonly-used Bernard graph (Bernard et al., 1976) showing 612
the dryness ratio (C1/[C2+C3]) versus methane carbon isotope values is presented in Figure
613
8. All individual samples collected in all wells are represented; for those with no ethane 614
and propane, a dryness ratio cannot be computed, but was assigned an arbitrary value of 615
100 000 (at the top of the graphs, in the “unquantified ratios” box). Results from most 616
samples fall outside of the traditional domains for microbial and thermogenic gas (Figure 617
8-A). This could be due to mixing between microbial and thermogenic gas, or to 618
biogeochemical processes affecting the isotopic composition of microbial gas. 619
Mixing with thermogenic gas was confirmed in 15% of the wells, based on the presence of 620
ethane and/or propane (Figure 8-B). These wells are not clustered in a specific area or 621
located specifically along fault zones (Figure 7, see red circles). However, the only 622
groundwater sample that falls within the ‘thermogenic’ domain on Figure 8 (shown with a 623
red arrow), was collected in a well located along the RJC fault. The CH4-13Cvalue of this
624
sample corresponds to deep formation gas from the Lorraine Group, but not to the Utica 625
Shale (values published in Chatellier et al., 2013). This residential well was sampled 626
several times afterward, but all subsequent samples contained only microbial gas. 627
For samples without ethane or propane, other processes must be invoked to explain 628
ambiguous CH4-13Cvalues. The process that is most often suspected is oxidation, which
629
causes an increase in both CH4-13C and -2Hvalues. Considering the CH4-2Hvalues in
630
our samples, and based on published isotopic fractionation factors for methane oxidation, 631
this process does not appear to be significant in the Saint-Édouard area, except for Ca-632
HCO3 type samples with very low methane concentrations and relatively high CH4-δ13C
30 values (pink diamonds on Figure 8-A). Moreover, comparison of CH4-2H and H2O-2H
634
values confirmed that methane isotopic values in most samples are consistent with regular 635
(non-oxidized) microbial methane formed via the CO2 reduction pathway using the local
636
groundwater (Bordeleau et al., 2018b). 637
Another process that may explain ambiguous isotopic values is late-stage methanogenesis, 638
which is the result of kinetic isotope effects occurring during microbial transformation of 639
substrates (mostly CO2 in this region) into methane, in an isolated groundwater reservoir
640
where the carbon (reactant) pool has substantially been used up and is not replenished by 641
fresh DIC from active recharge (Whiticar et al., 1999). Gas produced through this process 642
is characterized by high dryness ratios typical of microbial methane, relatively high CH4
-643
13C values resembling thermogenic gas, and higher than expected DIC-13C values. An
644
in-depth interpretation of these geochemical parameters (Bordeleau et al., 2018b) revealed 645
that many samples contained late-stage microbial gas (Figure 8-C). Noteworthy, several of 646
these samples also contain some thermogenic gas (Figure 8-B, C). Analyses of methane 647
radiocarbon (CH4-14C), and comparison with DIC-14C values in the aquifer, confirmed that
648
the late-stage microbial gas was produced in the distant past (14C-free), while the regular
649
microbial produced at shallower depths in the aquifer tends to be more recent (14C-bearing). 650
Finally, stable isotopic composition of ethane and propane, when available, did not provide 651
additional information on the possibility of upward migration, as the values measured in 652
groundwater, shallow bedrock gas and deep formation gas (Lorraine and Utica shales) span 653
similar ranges (Bordeleau et al., 2018b). 654
31 6.2 Rock geochemistry
656
Objective
657
As 15% of the sampled wells contained dissolved thermogenic methane, it was necessary 658
to determine the origin of that methane. If methane had been found to originate from the 659
Utica Shale, it would have implied the presence of natural fluid migration pathways from 660
the shale gas reservoir to the shallow groundwater. Therefore, initial organic geochemical 661
analyses were carried out on shallow core samples to document gas characteristics in the 662
upper 150 m, mainly composed of black shale units. The purpose of these analyses was 663
mainly to provide the concentrations and isotopic (δ13C and δ2H) compositions of alkanes 664
(C1-C3) that were shown to be present in shallow bedrock and compare these values to
665
those of dissolved natural gas in groundwater. 666
Fieldwork
667
Drill cuttings and core samples were collected during the drilling campaigns. Both were 668
stored in Isojars® (Isotech Laboratories, Champlain, IL) containing ultrapure water and a 669
bactericide during the 2014 campaign. A triplicate of Isojars® were collected 670
approximately every 10 to 15 m, leading to a total number of samples per well varying 671
from 3 to 10. Gas composition was analysed for 39 samples. Some core samples were also 672
preserved in a double-layer vacuum plastic bag for pore-water analyses and some were 673
disinfected and stored in aluminium foil, then frozen, for phospholipid fatty acid (PLFA) 674
analyses. Analyses of the last two types of samples did not provide the expected results; 675
they are thus only briefly discussed in the Supplementary information section. 676
Methods
32 Drill cuttings and core samples preserved in the Isojar® were initially analysed by Rock-678
Eval to assess the presence of pore-space free and adsorbed hydrocarbons as well as their 679
thermal maturation. The latter was also evaluated through organic petrography of the 680
samples. Gas extracted from drill cuttings and core samples (accumulated in the Isojar® 681
headspace) was analysed for both alkane concentrations and isotopic composition. 682
Therefore, the complete set of analyses included: Rock-Eval pyrolysis, petrographic 683
observation of organic matter reflectance, alkane concentrations (C1 to C3 or C1 to C5
684
depending on the laboratory), alkane isotopic composition (C1 to C3) for δ13C and
685
sometimes δ2H (depending on the laboratory), and 14C of methane. Methods used in 686
laboratories for the different analyses are described in Lavoie et al. (2016) and Bordeleau 687
et al. (2018b). 688
Results
689
All rock samples from the Les Fonds, Lotbinière and Nicolet formations showed organic 690
matter typical of Type II kerogen, the three units are thermally mature and have reached 691
oil window conditions at the time of maximum burial. The Lotbinière and Les Fonds 692
formations have total organic carbon (TOC) content of a fair hydrocarbon source rock 693
(TOC>0.5%), whereas the Nicolet Formation has a lower TOC content and is considered 694
as a poor hydrocarbon source rock (Lavoie et al., 2016). 695
All shallow bedrock samples contained gas hydrocarbons, but with locally variable 696
composition and concentration that were not always linked to specific bedrock units. Over 697
the depth range covered by samples, a downward increase in the concentration of alkanes 698
(C1+C2+C3) was observed, often along with a decrease in the gas dryness ratio (C1/[C2+C3])
33 (Lavoie et al., 2016). In fact, samples with dryness ratios <100 (thermogenic gas) were 700
found along the whole depth range, but samples with ratios between 100 and 1000 (mixed 701
gas) were restricted to the top 50 m of bedrock. Likewise, samples with CH4-δ13C values
702
corresponding to thermogenic gas (>-50‰) or mixed gas (-60 to -50‰) were found over 703
the whole depth range, while samples with microbial values (<-60‰) were generally 704
restricted to the top 15 m of bedrock. This suggests that in the top part of the fractured rock 705
aquifer, the thermogenic gas that was originally present in the bedrock pores has escaped 706
and/or was affected by microbial degradation, while ongoing in situ methanogenesis in this 707
active part of the aquifer adds microbial gas. 708
Isotopic results and dryness ratios for shallow bedrock samples appear on Figure 8 (grey 709
diamonds), along with deep formation gas (>600 m) from the Lorraine and Utica shales 710
(black diamonds) published by Chatellier et al. (2013). The CH4-δ13C ratios of shallow
711
bedrock gas have limited overlap with those of the deep formation gas, which typically 712
show isotopically-enriched values. The presence of unambiguously thermogenic gas in 713
some shallow bedrock samples, and the mix of microbial and thermogenic gas in others, is 714
confirmed by a Whiticar (1999) plot of CH4-δ13C versus CH4-δ2H values (see Lavoie et al.,
715
2016). As mentioned in section 6.1, the δ13C values of C2 and C3 alkanes are
716
indistinguishable from values for the deep formation gas samples (Lavoie et al., 2016). 717
The CH4-δ13C ratios of shallow rock samples overlap with groundwater results for a large
718
part, but more thermogenic gas was found in rock (Figure 8), confirming that thermogenic 719
gas is trapped in rock pores, while recent microbial gas is constantly forming and dissolving 720
in groundwater. A comparison of CH4-δ13C and –δ2H values for shallow bedrock and
721
groundwater was also made on a well by well basis, showing that values were very similar 722
34 for a given well and sampling depth (Bordeleau et al., 2018b). Based on these findings, the 723
likely source of thermogenic gas in groundwater appears to be the shallow fractured rock 724
aquifer itself (which is mainly composed of organic-rich black shale), rather than the deep 725
Utica Shale (Lavoie et al., 2016). 726 727 6.3 Groundwater monitoring 728 Objective 729
The objective of monitoring dissolved methane concentration and its isotopic composition 730
was to document natural variations in wells with different characteristics. Knowledge of 731
these temporal variations for a given area and even for a given well prior to any shale gas 732
development is critical, mainly to distinguish natural fluctuations from anthropogenic 733
impacts stemming from deep industrial activities. Until now, few studies have documented 734
such variations (e.g.: Coleman and McElreath, 2012; Gorody, 2012; Humez et al., 2015; 735
Sherwood et al., 2016; Smith et al., 2016; Currell et al., 2017, Botner et al., 2018) and they 736
have relied on only a few wells and/or on a few sampling events. 737
Fieldwork and methods
738
Monitoring was carried out over more than two years in six wells, including four 739
observation wells (F1 to F4) and two residential wells (INRS-447 and Zone 9R). Well F21, 740
which was drilled later in the project, was subsequently added to the monitoring program 741
and was sampled over 15 months. The selected wells reflect the diversity of wells present 742
in this study area (e.g.: high and low methane concentrations, observation and residential 743
wells, shallower and deeper wells, purely microbial gas and mixed gas). Groundwater was 744
35 sampled for alkane (C1-C3) concentrations, methane isotopic composition (CH4-δ13C and
745
–δ2H), and DIC-13C analyses. Groundwater sampling was carried out as described in
746
section 6.1. 747
Results
748
Results showed that dissolved methane concentrations can fluctuate greatly even in the 749
absence of industrial activities, depending on the sources of gas and microbial activity. 750
Some examples from monitoring wells are presented in Figure9. For the Saint-Édouard 751
area and for the monitored period, methane concentrations varied from 2.5 to 6 times the 752
lowest recorded values for a given well (with sampling depth and sampling technique 753
remaining the same), which is well above the uncertainty expected for sampling, handling 754
and analysis (Rivard et al., 2018a). The gas dryness ratio (not shown here) also varied 755
significantly over time for a given well, but in general it did not affect the interpretation, 756
as values tended to remain within the same “class” (<100 for thermogenic gas, >1000 for 757
microbial gas). 758
In contrast, isotopic values (CH4-13C and -2H) were generally very stable over time, with
759
variations remaining within the uncertainty expected for sampling, handling and analysis 760
(Rivard et al., 2018a). However, the two wells with the lowest methane concentrations 761
(Zone 9R and F3) showed significant variations over time (Figure 9). Changes in isotopic 762
composition due to either mixing of gas sources in varying proportions, or to post-genetic 763
processes affecting methane, are likely to have a more noticeable effect when methane 764
concentrations are small. In well F3, the variations were attributed to oxidation (Rivard et 765
al., 2018a) while in Zone 9R, the main factor is the detection of thermogenic gas with a 766
36 relatively deep formation gas signature in the first sample of the series (Bordeleau et al., 767
2018b). DIC-13C values were also found to vary significantly over time (not shown here), 768
especially in wells where methane concentrations were high and where late-stage 769
methanogenesis was predominant (Rivard et al., 2018a). 770
Therefore, while isotopic values of methane are usually a good and stable indicator of gas 771
origin in a well, significant variations may occur in some wells and thus monitoring for 772
both concentration and isotopic values should be carried out for a sufficient period ahead 773
of any shale gas activities to establish natural variability. Moreover, monitoring of DIC-774
δ13C may prove very helpful in interpreting the origin of methane, especially when CH 4
-775
δ13C values are ambiguous. Most importantly, interpretation of gas origin based on a single
776
sample from a well could be erroneous if that sample is a punctual anomaly, as was 777
observed on a few occasions in this study. These results could therefore have important 778
implications on regulatory or voluntary procedures aiming to define the natural baseline 779
presence of methane prior to shale gas activities. 780
781
7
Importance of multi-source and multi-discipline data
782783
The complex scientific issues associated with the study of potential upward fluid migration 784
from hydrocarbon reservoirs to shallow aquifers ideally require multisource data and 785
multidisciplinary expertise. Within the Saint-Édouard project, the approach used integrated 786
data from and expertise in structural geology, stratigraphy, hydrogeology, geophysics, 787