HAL Id: hal-01892925
https://hal.umontpellier.fr/hal-01892925
Submitted on 1 Jun 2021
HAL is a multi-disciplinary open access
archive for the deposit and dissemination of
sci-entific research documents, whether they are
pub-lished or not. The documents may come from
teaching and research institutions in France or
abroad, or from public or private research centers.
L’archive ouverte pluridisciplinaire HAL, est
destinée au dépôt et à la diffusion de documents
scientifiques de niveau recherche, publiés ou non,
émanant des établissements d’enseignement et de
recherche français ou étrangers, des laboratoires
publics ou privés.
Distributed under a Creative Commons Attribution| 4.0 International License
Variation in RNA Virus Mutation Rates across Host
Cells
Marine Combe, Rafael Sanjuán
To cite this version:
Marine Combe, Rafael Sanjuán. Variation in RNA Virus Mutation Rates across Host Cells. PLoS
Pathogens, Public Library of Science, 2014, 10 (1), �10.1371/journal.ppat.1003855�. �hal-01892925�
Marine Combe1, Rafael Sanjua´n1,2*
1 Instituto Cavanilles de Biodiversidad y Biologı´a Evolutiva, Valencia, Spain, 2 Departament de Gene`tica, Universitat de Vale`ncia, Valencia, Spain
Abstract
It is well established that RNA viruses exhibit higher rates of spontaneous mutation than DNA viruses and microorganisms. However, their mutation rates vary amply, from 1026to 1024substitutions per nucleotide per round of copying (s/n/r) and
the causes of this variability remain poorly understood. In addition to differences in intrinsic fidelity or error correction capability, viral mutation rates may be dependent on host factors. Here, we assessed the effect of the cellular environment on the rate of spontaneous mutation of the vesicular stomatitis virus (VSV), which has a broad host range and cell tropism. Luria-Delbru¨ck fluctuation tests and sequencing showed that VSV mutated similarly in baby hamster kidney, murine embryonic fibroblasts, colon cancer, and neuroblastoma cells (approx. 1025 s/n/r). Cell immortalization through p53 inactivation and oxygen levels (1–21%) did not have a significant impact on viral replication fidelity. This shows that previously published mutation rates can be considered reliable despite being based on a narrow and artificial set of laboratory conditions. Interestingly, we also found that VSV mutated approximately four times more slowly in various insect cells compared with mammalian cells. This may contribute to explaining the relatively slow evolution of VSV and other arthropod-borne viruses in nature.
Citation: Combe M, Sanjua´n R (2014) Variation in RNA Virus Mutation Rates across Host Cells. PLoS Pathog 10(1): e1003855. doi:10.1371/journal.ppat.1003855 Editor: Adam Lauring, University of Michigan, United States of America
Received July 12, 2013; Accepted November 12, 2013; Published January 23, 2014
Copyright: ß 2014 Combe, Sanjuan. This is an open-access article distributed under the terms of the Creative Commons Attribution License, which permits unrestricted use, distribution, and reproduction in any medium, provided the original author and source are credited.
Funding: This work was supported by grants from the Spanish Ministerio de Economı´a y Competitividad (BFU2011-25271) and the European Research Council (ERC-2011-StG- 281191-VIRMUT). The funders had no role in study design, data collection and analysis, decision to publish, or preparation of the manuscript. Competing Interests: The authors have declared that no competing interests exist.
* E-mail: [email protected]
Introduction
RNA viruses show extremely high genetic variability and rapid evolution, ultimately due to their elevated rates of spontaneous mutation, which range from 1026 to 1024 substitutions per nucleotide per round of copying (s/n/r). However, mutation rate estimates vary considerably, even for the same virus [1,2]. Since viral mutation rates have implications for pathogenesis [3,4], vaccine development [5,6] antiviral therapy [7,8], and epidemi-ological disease management [9,10], it is important to have accurate data and a clear understanding of the factors determining these rates. As a case in point, the risk of cross-species transmission is determined, in addition to the ecology of virus-host interactions, by the input of new adaptive mutations in the viral population [11], and a recent phylogenetic analysis of rabies virus isolates suggested that the waiting time required for host jumps depends on the number of positively selected mutations involved in cross-species transmission [12].
In RNA viruses, mutation rates are determined by the intrinsic base selection specificity of the viral polymerase [13–16], the presence/absence of proofreading mechanisms such as 39exonu-clease activity [17–19], or the mode of replication [20,21]. However, in addition to these virus-encoded factors, viral mutation rates can be host-dependent. For instance, it has been suggested that the replicase of cucumber mosaic virus exhibits different fidelity in pepper and tobacco plants [22,23]. In retroviruses, replication fidelity may be affected by intra-cellular dNTP imbalance and total concentration, which vary among cell types [24–26], although a recent study revealed no differences in the HIV-1 mutation rate in various cell types including T lymphoblast, glioblastoma and human embryonic kidney cells
[27]. Also, the expression of host genes may influence the viral mutation rate as is the case of APOBEC3 cytidine deaminases, which can edit the HIV-1 cDNA and produce G-to-A hypermuta-tions [28–30]. A similar role was postulated for the cellular RNdependent adenosine deaminase (ADAR) which could lead to A-to-G hypermutation in several RNA viruses, including rhabdovi-ruses [31], paramyxovirhabdovi-ruses [32], and retrovirhabdovi-ruses [33–35]. Finally, cell metabolism may also have an impact in viral mutation rates, since it has been shown that ethanol-derived reactive oxygen species (ROS) can damage the RNA of hepatitis C virus, whereas other compounds such as glutathione and iron chelators were found to have the opposite effect [36].
Vesicular stomatitis virus (VSV) is a non-segmented negative-stranded RNA virus belonging to the family Rhabdoviridae with an extremely wide host tropism. The virion attaches to phosphadtidyl serine or other ubiquitous cell surface receptors and can productively infect most mammalian cells [37]. In nature, VSV infects a very large number of mammal species including livestock (cattle, horse, swine, goats, etc.) and wild animals (rodents, bear, lynx, bats, etc.), and also infects insects (sandflies, blackflies, mosquitoes, etc.) [38,39], which act as transmission vectors [40– 42]. Therefore, VSV replicates in widely different cellular environments, but the impact of this heterogeneity on the viral mutation rate is unknown. Actually, nearly all mutation rate estimates for animal viruses have been obtained in standard laboratory cell lines, which are usually immortalized or cancerous and thus show aberrant metabolic/mitotic rates and gene expression patterns. For VSV, most studies are conducted using hamster kidney cells, despite the fact that the brain is the main target organ of rhabdoviruses. Furthermore, all viral mutation rate studies have been conducted under atmospheric oxygen levels but
these are substantially higher than those found in most tissues [43], and the impact of this type of environmental stress in the estimates is unknown. Here, we measured the mutation rate of VSV in primary and tumoral cell types including murine fibroblasts of various origins and neural cells, and under different oxygen levels, as well as insect cells. We found that the VSV mutation rate was relatively constant in all mammalian cells tested. However, VSV mutated four times more slowly in insect cells than in mammalian cells, a finding that may have implications for our understanding of arboviral evolution.
Results/Discussion
Fluctuation tests in BHK-21 cells
We measured the mutation rate of VSV by the Luria-Delbru¨ck fluctuation test, a standard estimation method [44] that has been used previously in several viruses including poliovirus [45], vesicular stomatitis virus [46], influenza A virus [47], measles virus [48], turnip mosaic virus [49], and bacteriophages w6 [20] and Qb [50]. To score mutants, we used a monoclonal antibody against the envelope glycoprotein G and determined the probability of appearance of monoclonal antibody resistance (MAR) mutants in independent cultures (null-class method). First, we performed six
independent tests in baby hamster kidney cells (BHK-21), for which we had previous results [46]. This gave an average mutation rate to the MAR phenotype of m = (1.6460.27)61025 per round of copying (Table 1). This rate can be converted to per-nucleotide units as m~3m=T , where T is the set of observable mutations leading to the phenotype (mutation target) and three stands for the number of possible nucleotide substitutions per site [2]. Sequencing of the glycoprotein G gene from 15 MAR plaques allowed us to identify four different nucleotide substitutions, which led to amino acid changes D257N, D259A, D259N, and S273T, whereas previous work reported the same substitutions at position 259 of the G glycoprotein in addition D257G, D257V, D257Y and A263E [51]. Taking T = 8, the estimated mutation rate is m = 6.1561026
substitutions per nucleotide per round of copying (s/n/r).
Validation by molecular clone sequencing
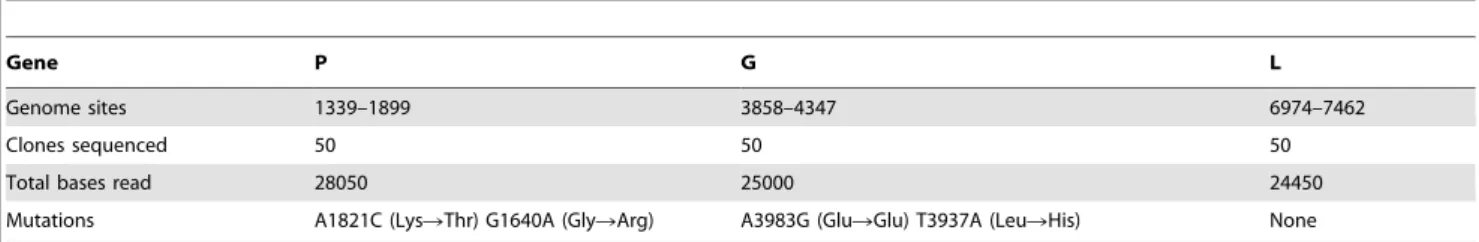
To verify the reliability of the above estimate, we used a molecular clone sequencing approach. This allowed us to score mutations more directly than in fluctuation tests and to analyze a wider genome region, although the interpretation of the data is complicated by the fact that the observed mutation frequency is dependent on selection, the number of generations elapsed, etc. BHK-21 cells were infected with a single infectious particle (i.e. plaque forming unit, pfu) by limiting dilution, and the resulting viral bursts (1.556107 final pfu on average) were used for RNA purification, RT-PCR, molecular cloning, and sequencing of three genome regions mapping to genes P, G, and L. We observed four single-nucleotide substitutions in 77500 bases in total, giving a mutation frequency of f = 5.1661025(Table 2). For a per-cell burst size of B = 1250 [46], the number of infection cycles (i.e. viral generations) elapsed should be c~ln 1:55|10
7
ln 1250 ~2:3. Therefore, the per-generation increase in mutation frequency was f =c~2:24|10{5. To account for the effect of selection, we used
the previously characterized distribution of mutational fitness effects (see Methods). Based on this, the expected fraction of observable mutations after 2.3 generations was 53% and, thus, the estimated per-cell mutation rate is mc~
f
ca~4:23|10
{5
. The exact number of round of copying per cell is unknown but a previous work suggested rC= 5.8 rounds/cell, implying that m = 7.30610
26
s/n/r. This estimate is fully consistent with the results provided by the Luria-Delbru¨ck fluctuation test. Subsequent experiments were done Author Summary
RNA viruses show high rates of spontaneous mutation, a feature that profoundly influences viral evolution, disease emergence, the appearance of drug resistances, and vaccine efficacy. However, RNA virus mutation rates vary substantially and the factors determining this variability remain poorly understood. Here, we investigated the effects of host factors on viral replication fidelity by measuring the viral mutation rate in different cell types and under various culturing conditions. To carry out these experiments we chose the vesicular stomatitis virus (VSV), an insect-transmitted mammalian RNA virus with an extremely wide cellular and host tropism. We found that the VSV replication machinery was robust to changes in cellular physiology driven by cell immortalization or shifts in temperature and oxygen levels. In contrast, VSV mutated significantly more slowly in insect cells than in mammalian cells, a finding may help us to understand why arthropod-borne viruses tend to evolve more slowly than directly transmitted viruses in nature.
Table 1. Fluctuation tests of VSV in BHK-21 cells.
Test 1 Test 2 Test 3 Test 4 Test 5 Test 6 Ni(pfu) 160611 267618 3586114 355635 293636 290610 Nf(pfu) 2456261021 108756956 203756849 3815061590 4615761044 172006934 Total cultures 24 24 24 24 24 24 With no MAR 16 20 17 16 16 15 With 1 MAR 6 4 6 7 7 4 With 2 MARs 0 0 1 1 0 2 With .2 MARs 2 0 0 0 1 3
Fraction with no MAR (P0) 0.667 0.833 0.708 0.667 0.667 0.625
Mutation rate (m) 1.6661025 1.7161025 1.7261025 1.0761025 0.8861025 2.7861025 doi:10.1371/journal.ppat.1003855.t001
using fluctuation tests only because they provided a faster and simpler approach.
Constant mutation rate in mammalian cells
Previous mutation rate studies with VSV have been conducted in BHK-21 cells only [2,46,52]. However, these are immortal-ized/tumoral cells, as opposed to those typically encountered bythe virus in vivo. Furthermore, VSV has a tropism for neural cells, and kidney fibroblasts are not a natural target of the virus. Toaddress the potential effect of immortalization on the viral mutation rate, we performed fluctuation tests in primary mouse embryonic fibroblasts (MEFs) and isogenic, p53 knock-out, MEFs. The average rate was similar in normal (m = 1.2761025) and p53knock-out MEFs (m = 0.8261025), revealing no significant effectof cellular immortalization (Figure 1; t-test: P = 0.232, n = 6). However, many cell lines are tumoral and show other genetic andmetabolic alterations in addition to p53 inactivation. To check the potential effects of these changes, we performed fluctuation tests in CT26 cells from an undifferentiated grade IV colon adenocar-cinoma of a BALB/c mouse [53], but we found no significant differences with primary MEFs (m = 1.1861025; t-test: P = 0.885, n = 6). Of note, BHK-21 are also tumor-forming cells, and the mutation rate was similar to the rate observed in MEFs or CT26 cells (one-way ANOVA: P = 0.293, n = 12). This homogeneity in the VSV mutation rate was not an obvious a priori, because metabolic and mitotic activity should alter the availability of NTPs [54] and hence could impact RNA replication fidelity, although VSV replicates in the cytoplasm and may not be strongly affected by these alterations. This result has implications for the field of oncolytic virotherapy [55], since it is critical to assess the genetic stability of these therapeutic viruses during large-scale manufactur-ing and clinical use. In particular, CT26 cells have been used in mice as a model for testing the oncolytic activity of VSV [56]. Also, the above results suggest that VSV replicates with similar fidelity in different cell types, but we sought to test whether this would also hold for neural cells. We therefore performed fluctuation tests in Neuro-2a cells from a mouse neuroblastoma [57]. Again, we found that the average mutation rate did not significantly differ from the rate obtained in BHK-21 cells (m = 1.0661025; t-test: P = 0.461, n = 9). Finally, to test for other potential effects of cell physiology, we also varied oxygen levels. The VSV mutation rate in BHK-21 cells cultured under hypoxic conditions (1% oxygen) was slightly higher but not significantly different to the rate obtained under standard conditions (m = 2.7161025; t-test: P = 0.122, n = 9). Oxidative stress should lead to the release of ROS, which have been previously shown to be mutagenic for hepatitis C virus [36]. However, VSV does not appear to be sensitive to oxidation levels. This might be related to the fact that the nucleocapsid of mononegavirales forms a tunnel-like structure which wraps the viral genomic RNA and remains assembled during the entire infection cycle [58,59], effectively isolating the viral RNA [60].
Lower mutation rate in insect cells
Since VSV alternates between mammalian and insect hosts in nature, we sought to measure the viral mutation rate in insect cells (Figure 1). In S2 cells from D. melanogaster embryos, the average estimate from three independent fluctuation tests was m = 4.0861026, representing a fourfold decrease compared with BHK-21 (t-test: P = 0.009, n = 9). To further investigate this, we selected two additional insect cells lines: Sf21 ovarian cells from the moth Spodoptera frugiperda, and C6/36 from Aedes albopictus mosquito larvae. Also, since insect cells were infected at 28uC and mammalian cells at 37uC, we performed four additional tests in BHK-21 at 28uC. We used estimates obtained in mammalian (BHK-21, BHK-21 at 28uC, MEF, MEF p532/2, CT26, and Neuro-2a) and insect cells (S2, Sf-21, and C6/36) to jointly test for the effects of host type and temperature (fixed factors) in a two-way ANOVA in which the specific cell line was treated as a random factor nested within host type. This confirmed that VSV shows lower mutation rate in insect cells than in mammalian cells (ANOVA: P,0.001), and also that temperature cannot account for this result because the estimates in BHK-21 were actually higher at 28uC than at 37uC (P = 0.001). Using log10-transformed
Table 2. Molecular clone sequencing of VSV from BHK-21 cells.
Gene P G L
Genome sites 1339–1899 3858–4347 6974–7462
Clones sequenced 50 50 50
Total bases read 28050 25000 24450 Mutations A1821C (LysRThr) G1640A (GlyRArg) A3983G (GluRGlu) T3937A (LeuRHis) None doi:10.1371/journal.ppat.1003855.t002
Figure 1. VSV mutation rate to the MAR phenotype estimated by the Luria-Delbru¨ ck fluctuation test in different cellular environments. Each dot represents an independent estimate (n = 3 for all except n = 6 for BHK-21 and n = 4 for BHK-21 at 28uC). Horizontal bars indicate the mean rate. Detailed information for each test is provided in Table 1 and in Text S1.
data, the estimated effect size of the host type in the above model was 0.59060.205, which implies a 3.9 fold mutation rate decrease in insect cells. One possible explanation for this difference is that our sensitivity to detect MAR mutants varied between assays performed in mammalian and insect cells. To address this, we first verified that MAR plating efficiency was similar in BHK-21, S2, Sf21, and C6/36 cells using a genetically engineered MAR mutant (D259A). Second, we tested for differences in the mutation target size (T). To do this, we sampled 15 individual MAR plaques from fluctuation tests performed in S2 cells and sequenced the region of the G protein controlling this phenotype. We found the same amino acid replacements as in fluctuation tests performed in BHK-21 cells (D257N, D259N, S273T, see above) except for D259A. However, because the D259 mutant is viable in insect cells [61], failure to detect it was probably due to insufficient sampling depth. We also found substitution A263E, which was reported previously in 21 cells [51]. Therefore, insect S2 and BHK-21 cells shared a similar mutational repertoire and plating efficiency, supporting the consistency of the observed mutation rate difference. Interestingly, VSV [62] and arboviruses in general [63,64] tend to evolve more slowly than directly transmitted viruses. Our own meta-analysis using 170 previously published evolutionary rates confirmed that, after accounting for phylogenetic relatedness and the timespan of sequence sampling, arboviruses showed a significantly lower evolution rate than directly transmitted viruses (Figure 2; two-way ANOVA: P = 0.006), the geometric mean rates being 5.761024 substitu-tions per site per year (s/s/y) and 1.361023s/s/y, respectively. This has been often interpreted in terms of fitness tradeoffs, whereby neutral or beneficial mutations in mammals can be deleterious in insects, and vice versa, thus restricting viral evolution. However, whether arboviruses show similar mutation rates in mammalian and insect cells has not been addressed before, and our results offer a new possible explanation for the relatively slow arboviral evolution. Future experiments with other
arboviruses could help elucidate the generality of these findings and, if so, to delineate the mechanisms behind the observed differences in replication fidelity.
Materials and Methods Virus
Viruses were obtained from an infectious cDNA clone by transfecting baby hamster kidney (BHK-21) cells [65,66], purified by filtration (0.22mm), and stored at 70uC in aliquots until use. Cell culturing
BHK-21 cells (American Type Culture Collection, ATCC) were cultured in DMEM supplemented with 10% fetal bovine serum (FBS), 0.02 mM L-Glutamine, a mix of non-essential amino-acids, 100mg/mL streptomycin, 60mg/mL penicillin, and 2mg/mL fungizone. MEFs and their p532/2 derivatives were obtained from Dr. Carmen Rivas (Centro Nacional de Biotecnologı´a, Madrid) and cultured in the same medium but with 12% FBS. Neuro-2a cells were obtained from Prof. Jose´ M. Garcı´a-Verdugo (Department of Cell Biology, University of Valencia) and cultured in MEM supplemented with 2 mM L-Glutamine, 1 mM sodium pyruvate, 10% FBS, non-essential amino acids and the above antibiotics. CT26 cells (ATCC) were cultured in DMEM with 10% FBS, 2 mM L-glutamine, 10 mM HEPES and antibiotics. All the above cells were incubated at 37uC with 5% C02 and
passaged upon confluence. D. melanogaster Schneider (S2) cells were obtained from Dr. Rube´n Artero (Department of Genetics, University of Valencia) and cultured in Schneider’s medium supplemented with 10% FBS and antibiotics at 25uC in the absence of C02, and infected at 28uC. Sf21 cells were obtained
from Dr. Salvador Herrero (Department of Genetics, University of Valencia) and were cultured in Grace’s insect medium supple-mented with 10% FBS and antibiotics at 28uC in the absence of C02. C6/36 cells (ATCC) were cultured in DMEM supplemented
with 10% FBS, 2 mM L-glutamine, non-essential amino acids, 1 mM sodium pyruvate and antibiotics at 28uC under 5% C02.
Hypoxia was achieved by displacing oxygen with nitrogen, using a Galaxy 170R incubator (Eppendorf).
Luria-Delbru¨ck fluctuation tests
We inoculated 32 identical cultures each containing 104 confluent cells with approximately 300 pfu/well (Ni) and
incubat-ed them until approximately 36104pfu/well were produced (N f).
After a round of freeze-thawing to release intracellular particles, we used eight cultures for titration and 24 for plating the entire undiluted volume (100mL) in the presence of a monoclonal antibody against the surface glycoprotein G at a concentration that neutralizes completely the wild-type virus and selects for MAR mutants. The antibody, in the form of a hybridoma supernatant, was added to the plating medium (25% v:v) to avoid phenotypic masking [52]. Plating assays were done in DMEM gelled with 0.4% agarose containing 2% FBS. After 24 h, monolayers were fixed with 10% formaldehyde and stained with 2% crystal violet to visualize plaques. Since mutation is a rare event, the number of mutations per culture is expected to follow a Poisson distribution of parameter l~m(Nf{Ni) and therefore the probability of
observing no mutants in a culture is P0~e{m(Nf{Ni), where m is
the mutation rate from the wild-type to the MAR phenotype (null-class method). However, if there is incomplete plating, some cultures may contain undetected MAR mutants. If we define z as the plating efficiency (relative to BHK-21 cells), the probability of observing no mutants can be expressed as P0~PkQk(1{z)k,
where Qkis the probability of k actual mutants in a culture. Using
Figure 2. Molecular evolution of directly transmitted and arthropod-transmitted riboviruses. Data were collected from the supplementary information of a previous meta-analysis [69] and include 170 evolutionary rates, 113 for directly transmitted viruses and 57 for arboviruses. The box plot indicates the median (central lines), percentiles 25/75 (box) and percentiles 10/90 (bars), and outliers (dots). doi:10.1371/journal.ppat.1003855.g002
a Poisson distribution of parameter l~m(Nf{Ni) for k, we
numerically solved Q0given P0, Ni, Nf, and z and calculated the
mutation rate as m~{ ln(Q0)=(Nf{Ni).
Plating efficiency in fluctuation tests
For each cell type tested, the plaque assay for scoring MAR mutants was done in BHK-21 cells for technical feasibility and to control for differences in plating efficiency among cells. However, since plaque assays to score MAR mutants were done without dilution, antiviral cytokines or other compounds released from the cells in which the virus was grown could modify plating efficiency (plaque assays for determining Nfwere done at a roughly 1/100
dilution and thus were much less affected by this problem). For instance, BHK-21 cells are at least partially responsive to interferon [67], potentially inhibiting growth of MAR mutants and biasing mutant counts down. To calibrate this effect, we titrated a MAR clone obtained by site-directed mutagenesis (substitution D259A in the surface glycoprotein G) in the presence of undiluted superna-tants harvested from cells previously infected with the wild-type virus (Ni<300 pfu and Nf><104pfu, similar to fluctuation tests),
adding monoclonal antibody to the plates to observe MAR plaques only. The wild-type infections were performed under each of the experimental conditions (BHK-21, MEF, MEF p532/2, CT26, Neuro-2a, BHK-21 with 1% O2, BHK-21 at 28uC, S2, Sf21 and
C6/36 cells). Addition of supernatants from BHK-21 cells infected under standard conditions did not alter the titer of the D259 MAR clone, hence the relative plating efficiency was z = 1. The relative plating efficiency for each of the other conditions is shown in the Supporting Information ‘‘Text S1’’ and was based on at least six independent plating assays.
Mutation target size in fluctuation tests
To ascertain the number of possible mutations conferring the MAR phenotype, we plated approximately 105pfu in the presence of antibody, incubated them for 24 h, and pipetted individual plaques. Viral RNA was purified, reverse-transcribed using AccuScript High Fidelity Reverse Transcripatse (Agilent Tech-nologies), and the cDNA was PCR-amplified using Phusion High Fidelity DNA polymerase (New England Biolabs). We used specific primers to amplify and sequence a region of the G protein (genome sites 3361 to 4501 in GenBank accession EF197793) which controls the MAR phenotype [51]. PCR products were sequenced by the Sanger method and analyzed using Staden software.
Mutation frequency determination by molecular clone sequencing
A 96-well plate containing 104cells per well was inoculated with a limiting dilution of the viral stock such that approximately 10% of wells were infected. Plates were incubated at 37uC for 24 h, inspected under the microscope for cytopathic effects, and freeze-thawed to allow release of intracellular viruses. Viral RNA was purified from the supernatant of each of five positive wells and reverse-transcribed using AccuScript High Fidelity Reverse Transcripatse, and the cDNA was PCR-amplified using Phusion High Fidelity DNA polymerase and specific primers located in the P, G and L genes, as indicated. PCR products were cloned and used for E.coli transformation, and 10 colonies were picked and amplified by colony PCR using Phusion High Fidelity DNA polymerase. PCR products were sequenced by the Sanger method and analyzed using Staden software. To obtain the mutation frequency, the number of observed mutations was divided by the total number of bases sequenced.
Effect of selection on mutation frequency
We used the empirically characterized distribution of muta-tional fitness effects of random single-nucleotide substitutions in VSV to correct for the effect of selection on mutation frequency and obtain the mutation rate per cell infection. We did so numerically by simulating the combined effects of mutation and selection. The statistical distribution of fitness effects (s) for viable substitutions can be roughly captured using an exponential distribution truncated at s~1 (lethality) plus a class of lethals occurring with probability pL: P(s)~(1{pL)
le{ls
1{e{l if 0,s,1,
p(s)~pLif s = 1, and p(s)~0 otherwise. In a previous work using
the same VSV strain as here, it was estimated that pL~0:40 and
that E(s)~1
l~0:13 [65,68]. Fitness effects were measured as growth rate ratios, si~1{
ri
r0
, where r is the exponential growth rate and subscripts i and 0 refer to the mutant and wild-type, respectively [65]. These s-values were transformed to per cell infection units as si’~1{
B1{si{1
B{1 , where B is the burst size. After simulating fitness effects using the truncated exponential plus lethal distribution and applying the per cell infection transforma-tion, selection was applied by picking individuals for the next cell infection cycle with weighted probability 12s9, and the process was iterated. This provided an expected mutation frequency f and therefore a relationship between m and f. Genetic drift was ignored since it should not modify the expected value of f. Also, for simplicity, mutations were assumed to have independent fitness effects (no epistasis) and back mutations were ignored, which seems reasonable in the short-term, because single forward mutations will greatly outnumber secondary and back mutations. Simulations were performed using Wolfram Mathematica and Excel. A graphical representation of this correction can be found in a previous work [2].
Analysis of published molecular evolutionary rates In a previous meta-analysis, we collected evolutionary rate estimates that were originally inferred from field isolates using Bayesian analysis of dated sequences after validation of the molecular clock [69]. Here, we used 170 of these estimates, which corresponded to 62 different riboviruses. We sought to compare viruses transmitted directly through respiratory secretions, blood, sexual contact, feces, or animal bites (n = 113) against arboviruses (n = 57). We used a two-way ANOVA in which the following factors were included: transmission mode (fixed), viral family (random) to account for phylogenetic relatedness, and sampling timespan (covariate) to account for the known time-dependency of evolution rate estimates. Since rates ranged several orders of magnitude log-transformed data were used.
Supporting Information
Text S1 Detailed information of fluctuation test results for wild-type MEFs (Table S1), p532/2 MEFs (Table S2), CT26 colon cancer cells (Table S3), Neuro-2a neuroblastoma cells (Table S4), BHK-21 cells under hypoxia (Table S5), BHK-21 cells at 28uC (Table S6), S2 cells (Table S7), in Sf21 cells (Table S8), and C6/36 cells (Table S9).
(PDF)
Acknowledgments
We thank Carmen Rivas, Jose´ Manuel Garcı´a-Verdugo and Rube´n Artero for the cells, Pablo Herna´ndez, Silvia Torres and Raquel Garijo for
technical assistance, and Ron Geller for useful comments on the
manuscript. Author Contributions
Conceived and designed the experiments: RS. Performed the experiments: MC. Analyzed the data: MC RS. Wrote the paper: RS.
References
1. Duffy S, Shackelton LA, Holmes EC (2008) Rates of evolutionary change in viruses: patterns and determinants. Nat Rev Genet 9: 267–276.
2. Sanjua´n R, Nebot MR, Chirico N, Mansky LM, Belshaw R (2010) Viral mutation rates. J Virol 84: 9733–9748.
3. Pfeiffer JK, Kirkegaard K (2005) Increased fidelity reduces poliovirus fitness and virulence under selective pressure in mice. PLoS Pathog 1: e11.
4. Vignuzzi M, Stone JK, Arnold JJ, Cameron CE, Andino R (2006) Quasispecies diversity determines pathogenesis through cooperative interactions in a viral population. Nature 439: 344–348.
5. Vignuzzi M, Wendt E, Andino R (2008) Engineering attenuated virus vaccines by controlling replication fidelity. Nat Med 14: 154–161.
6. Weeks SA, Lee CA, Zhao Y, Smidansky ED, August A, et al. (2012) A Polymerase mechanism-based strategy for viral attenuation and vaccine development. J Biol Chem 287: 31618–31622.
7. Anderson JP, Daifuku R, Loeb LA (2004) Viral error catastrophe by mutagenic nucleosides. Annu Rev Microbiol 58: 183–205.
8. Domingo E (2006) Quasispecies: concept and implications for virology. Springer.
9. Holmes EC (2008) Evolutionary history and phylogeography of human viruses. Annu Rev Microbiol 62: 307–328.
10. Woolhouse M, Gaunt E (2007) Ecological origins of novel human pathogens. Crit Rev Microbiol 33: 231–242.
11. Pepin KM, Lass S, Pulliam JR, Read AF, Lloyd-Smith JO (2010) Identifying genetic markers of adaptation for surveillance of viral host jumps. Nat Rev Microbiol 8: 802–813.
12. Streicker DG, Altizer SM, Velasco-Villa A, Rupprecht CE (2012) Variable evolutionary routes to host establishment across repeated rabies virus host shifts among bats. Proc Natl Acad Sci USA 109: 19715–19720.
13. Mene´ndez-Arias L (2009) Mutation rates and intrinsic fidelity of retroviral reverse transcriptases. Viruses 1: 1137–1165.
14. Pfeiffer JK, Kirkegaard K (2003) A single mutation in poliovirus RNA-dependent RNA polymerase confers resistance to mutagenic nucleotide analogs via increased fidelity. Proc Natl Acad Sci USA 100: 7289–7294.
15. Arnold JJ, Vignuzzi M, Stone JK, Andino R, Cameron CE (2005) Remote site control of an active site fidelity checkpoint in a viral RNA-dependent RNA polymerase. J Biol Chem 280: 25706–25716.
16. Korneeva VS, Cameron CE (2007) Structure-function relationships of the viral RNA-dependent RNA polymerase: fidelity, replication speed, and initiation mechanism determined by a residue in the ribose-binding pocket. J Biol Chem 282: 16135–16145.
17. Roberts JD, Bebenek K, Kunkel TA (1988) The accuracy of reverse transcriptase from HIV-1. Science 242: 1171–1173.
18. Steinhauer DA, Domingo E, Holland JJ (1992) Lack of evidence for proofreading mechanisms associated with an RNA virus polymerase. Gene 122: 281–288.
19. Denison MR, Graham RL, Donaldson EF, Eckerle LD, Baric RS (2011) Coronaviruses: an RNA proofreading machine regulates replication fidelity and diversity. RNA Biol 8: 270–279.
20. Chao L, Rang CU, Wong LE (2002) Distribution of spontaneous mutants and inferences about the replication mode of the RNA bacteriophage w6. J Virol 76: 3276–3281.
21. Sardanyes J, Sole RV, Elena SF (2009) Replication mode and landscape topology differentially affect RNA virus mutational load and robustness. J Virol 83: 12579–12589.
22. Pita JS, de Miranda JR, Schneider WL, Roossinck MJ (2007) Environment determines fidelity for an RNA virus replicase. J Virol 81: 9072–9077. 23. Pita JS, Roossinck MJ (2013) Mapping viral functional domains for genetic
diversity in plants. J Virol 87: 790–797.
24. Diamond TL, Roshal M, Jamburuthugoda VK, Reynolds HM, Merriam AR, et al. (2004) Macrophage tropism of HIV-1 depends on efficient cellular dNTP utilization by reverse transcriptase. J Biol Chem 279: 51545–51553. 25. Bebenek K, Roberts JD, Kunkel TA (1992) The effects of dNTP pool
imbalances on frameshift fidelity during DNA replication. J Biol Chem 267: 3589–3596.
26. Julias JG, Pathak VK (1998) Deoxyribonucleoside triphosphate pool imbalances in vivo are associated with an increased retroviral mutation rate. J Virol 72: 7941–7949.
27. Holtz CM, Mansky LM (2013) Variation of HIV-1 mutation spectra among cell types. J Virol 87: 5296–5299.
28. Harris RS, Bishop KN, Sheehy AM, Craig HM, Petersen-Mahrt SK, et al. (2003) DNA deamination mediates innate immunity to retroviral infection. Cell 113: 803–809.
29. Lecossier D, Bouchonnet F, Clavel F, Hance AJ (2003) Hypermutation of HIV-1 DNA in the absence of the Vif protein. Science 300: 1112.
30. Mangeat B, Turelli P, Caron G, Friedli M, Perrin L, et al.(2003) Broad antiretroviral defence by human APOBEC3G through lethal editing of nascent reverse transcripts. Nature 424: 99–103.
31. O’Hara PJ, Nichol ST, Horodyski FM, Holland JJ (1984) Vesicular stomatitis virus defective interfering particles can contain extensive genomic sequence rearrangements and base substitutions. Cell 36: 915–924.
32. Cattaneo R, Schmid A, Eschle D, Baczko K, Ter MV, et al (1988) Biased hypermutation and other genetic changes in defective measles viruses in human brain infections. Cell 55: 255–265.
33. Hajjar AM, Linial ML (1995) Modification of retroviral RNA by double-stranded RNA adenosine deaminase. J Virol 69: 5878–5882.
34. Kim T, Mudry RA, Jr, Rexrode CA, Pathak VK (1996) Retroviral mutation rates and A-to-G hypermutations during different stages of retroviral replication. J Virol 70: 7594–7602.
35. Sharmeen L, Bass B, Sonenberg N, Weintraub H, Groudine M (1991) Tat-dependent adenosine-to-inosine modification of wild-type transactivation response RNA. Proc Natl Acad Sci USA 88: 8096–8100.
36. Seronello S, Montanez J, Presleigh K, Barlow M, Park SB, et al. (2011) Ethanol and reactive species increase basal sequence heterogeneity of hepatitis C virus and produce variants with reduced susceptibility to antivirals. PLoS ONE 6: e27436.
37. Whelan SPJ (2008) Vesicular stomatitis virus. In: Mahy BWJ, van Regenmortel MHV, editors. Encyclopedia of Virology. Elsevier. pp. 291–299.
38. Letchworth GJ, Rodriguez LL, Del cbarrera J (1999) Vesicular stomatitis. Vet J 157: 239–260.
39. Kuzmin IV, Novella IS, Dietzgen RG, Padhi A, Rupprecht CE (2009) The rhabdoviruses: biodiversity, phylogenetics, and evolution. Infect Genet Evol 9: 541–553.
40. Comer JA, Tesh RB, Modi GB, Corn JL, Nettles VF (1990) Vesicular stomatitis virus, New Jersey serotype: replication in and transmission by Lutzomyia shannoni (Diptera: Psychodidae). Am J Trop Med Hyg 42: 483–490. 41. Mead DG, Gray EW, Noblet R, Murphy MD, Howerth EW, et al. (2004)
Biological transmission of vesicular stomatitis virus (New Jersey serotype) by Simulium vittatum (Diptera: Simuliidae) to domestic swine (Sus scrofa). J Med Entomol 41: 78–82.
42. Tesh RB, Chaniotis BN, Johnson KM (1972) Vesicular stomatitis virus (Indiana serotype): transovarial transmission by phlebotomine sandlies. Science 175: 1477–1479.
43. Carreau A, El Hafny-Rahbi B, Matejuk A, Grillon C, Kieda C (2011) Why is the partial oxygen pressure of human tissues a crucial parameter? Small molecules and hypoxia. J Cell Mol Med 15: 1239–1253.
44. Zheng Q (1999) Progress of a half century in the study of the Luria-Delbruck distribution. Math Biosci 162: 1–32.
45. Sedivy JM, Capone JP, RajBhandary UL, Sharp PA (1987) An inducible mammalian amber suppressor: propagation of a poliovirus mutant. Cell 50: 379–389.
46. Furio´ V, Moya A, Sanjua´n R (2005) The cost of replication fidelity in an RNA virus. Proc Natl Acad Sci USA 102: 10233–10237.
47. Sua´rez P, Valca´rcel J, Ortı´n J (1992) Heterogeneity of the mutation rates of influenza A viruses: isolation of mutator mutants. J Virol 66: 2491–2494. 48. Schrag SJ, Rota PA, Bellini WJ (1999) Spontaneous mutation rate of measles
virus: direct estimation based on mutations conferring monoclonal antibody resistance. J Virol 73: 51–54.
49. de la Iglesia F, Martinez F, Hillung J, Cuevas JM, Gerrish PJ, et al. (2012) Luria-Delbruck Estimation of Turnip mosaic virus Mutation Rate in vivo. J Virol 86:3386–3388.
50. Garcia-Villada L, Drake JW (2012) The three faces of riboviral spontaneous mutation: spectrum, mode of genome replication, and mutation rate. PLoS Genet 8: e1002832.
51. Holland JJ, de la Torre JC, Clarke DK, Duarte E (1991) Quantitation of relative fitness and great adaptability of clonal populations of RNA viruses. J Virol 65: 2960–2967.
52. Holland JJ, de la Torre JC, Steinhauer DA, Clarke DK, Duarte EA, et al. (1989) Virus mutation frequencies can be greatly understimated by monoclonal antibody neutralization of virions. J Virol 63: 5030–5036.
53. Corbett TH, Griswold DP, Jr., Roberts BJ, Peckham JC, Schabel FM, Jr. (1975) Tumor induction relationships in development of transplantable cancers of the colon in mice for chemotherapy assays, with a note on carcinogen structure. Cancer Res 35: 2434–2439.
54. Bray G, Brent TP (1972) Deoxyribonucleoside 59-triphosphate pool fluctuations during the mammalian cell cycle. Biochim Biophys Acta 269: 184–191. 55. Russell SJ, Peng KW, Bell JC (2012) Oncolytic virotherapy. Nat Biotechnol 30:
658–670.
56. Breitbach CJ, De Silva NS, Falls TJ, Aladl U, Evgin L, et al. (2011) Targeting tumor vasculature with an oncolytic virus. Mol Ther 19: 886–894.
57. Klebe RJ, Ruddle FH (1969) Neuroblastoma: cell culture analysis of a differentiating stem cell system. J Cell Biol 43: 69A.
58. Ge P, Tsao J, Schein S, Green TJ, Luo M, et al. (2010) Cryo-EM model of the bullet-shaped vesicular stomatitis virus. Science 327: 689–693.
59. Green TJ, Zhang X, Wertz GW, Luo M (2006) Structure of the vesicular stomatitis virus nucleoprotein-RNA complex. Science 313: 357–360. 60. Ostertag D, Hoblitzell-Ostertag TM, Perrault J (2007) Overproduction of
double-stranded RNA in vesicular stomatitis virus-infected cells activates a constitutive cell-type-specific antiviral response. J Virol 81: 503–513. 61. Novella IS, Hershey CL, Escarmis C, Domingo E, Holland JJ (1999) Lack of
evolutionary stasis during alternating replication of an arbovirus in insect and mammalian cells. J Mol Biol 287: 459–465.
62. Rodrı´guez LL, Fitch WM, Nichol ST (1996) Ecological factors rather than temporal factors dominate the evolution of vesicular stomatitis virus. Proc Natl Acad Sci USA 93: 13030–13035.
63. Hanada K, Suzuki Y, Gojobori T (2004) A large variation in the rates of synonymous substitution for RNA viruses and its relationship to a diversity of viral infection and transmission modes. Mol Biol Evol 21: 1074–1080.
64. Jenkins GM, Rambaut A, Pybus OG, Holmes EC (2002) Rates of molecular evolution in RNA viruses: a quantitative phylogenetic analysis. J Mol Evol 54: 156–165.
65. Sanjua´n R, Moya A, Elena SF (2004) The distribution of fitness effects caused by single-nucleotide substitutions in an RNA virus. Proc Natl Acad Sci USA 101: 8396–8401.
66. Whelan SP, Ball LA, Barr JN, Wertz GT (1995) Efficient recovery of infectious vesicular stomatitis virus entirely from cDNA clones. Proc Natl Acad Sci USA 92: 8388–8392.
67. Lin RJ, Liao CL, Lin E, Lin YL (2004) Blocking of the alpha interferon-induced Jak-Stat signaling pathway by Japanese encephalitis virus infection. J Virol 78: 9285–9294.
68. Sanjua´n R (2010) Mutational fitness effects in RNA and ssDNA viruses: common patterns revealed by site-directed mutagenesis studies. Phil Trans R Soc Lond 365: 1975–1982.
69. Sanjua´n R (2012) From molecular genetics to phylodynamics: evolu-tionary relevance of mutation rates across viruses. PLoS Pathog 8: e10026 85.