Publisher’s version / Version de l'éditeur:
ACI Materials Journal, 87, 4, pp. 340-347, 1990-07-01
READ THESE TERMS AND CONDITIONS CAREFULLY BEFORE USING THIS WEBSITE. https://nrc-publications.canada.ca/eng/copyright
Vous avez des questions? Nous pouvons vous aider. Pour communiquer directement avec un auteur, consultez la première page de la revue dans laquelle son article a été publié afin de trouver ses coordonnées. Si vous n’arrivez pas à les repérer, communiquez avec nous à PublicationsArchive-ArchivesPublications@nrc-cnrc.gc.ca.
Questions? Contact the NRC Publications Archive team at
PublicationsArchive-ArchivesPublications@nrc-cnrc.gc.ca. If you wish to email the authors directly, please see the first page of the publication for their contact information.
NRC Publications Archive
Archives des publications du CNRC
This publication could be one of several versions: author’s original, accepted manuscript or the publisher’s version. / La version de cette publication peut être l’une des suivantes : la version prépublication de l’auteur, la version acceptée du manuscrit ou la version de l’éditeur.
Access and use of this website and the material on it are subject to the Terms and Conditions set forth at
Low-temperature effects on the microstructure of cement paste
exposed to sea-water
Ramachandran, V. S.; Cheung, M. S.; Hachem, H. M.
https://publications-cnrc.canada.ca/fra/droits
L’accès à ce site Web et l’utilisation de son contenu sont assujettis aux conditions présentées dans le site LISEZ CES CONDITIONS ATTENTIVEMENT AVANT D’UTILISER CE SITE WEB.
NRC Publications Record / Notice d'Archives des publications de CNRC:
https://nrc-publications.canada.ca/eng/view/object/?id=a6aa782f-7235-44fd-8a7b-2b5b6fd28f15 https://publications-cnrc.canada.ca/fra/voir/objet/?id=a6aa782f-7235-44fd-8a7b-2b5b6fd28f15
Ser
THl
N21d
National Research
Conseil national
10.
1687
)$I
c
ouncil Canada
c
Q 2
de recherches Canada
BLDG,
Institute for
lnstitut de
-- - -
Research in
recherche en
Construction
construction
Low- Temperature Effects on the
Microstructure of Cement Paste
Exposed to Seawater
by V.S. Ramachandran, M.S. Cheung, and H.M. Hachem
ANALYZED
Reprinted from
ACI Materials Journal
Vol. 87, No. 4
July -
August 1990
p. 340-347
(I RC Paper No. 1687)
NRCC 32357
N R C-
CISTIF
I
1
FEB
20
1991
I
Abstract
Portland cement pastes made at a water/cement ratio of 0.25 were precured at
4°C for 3 to 15 hr and then cured in simulated seawater at -2.0 and 2°C for ages
up to 180 days. Compressive strength, morphology, rate of hydration and
porosity of the pastes were determined and interrelationships were
established.
On a effectub la cure de pates de ciment Portland preparees dans un rapport
eau-ciment de 0,25
A 4
O
C
pendant 3
A
15 heures, puis dans de l'eau de mer
simulbe
A
-2
et 2 OC durant des pbriodes atteignant 180 jours. Les auteurs ont
dbtermin6 la resistance
A
la compression, la morphologie, le taux
d'hydratation et la porosite des pates, et ils ont 6tabli des relations entre
ces
Title no. 87-M36
Low-Temperature Effects on the Microstructure of Cement
Paste Exposed to Seawater
by
V.
S.
Ramachandran, M.
S.
Cheung, and H. M. Hachem
Title no. 87-M36
Low-Temperature Effects on the Microstructure of Cement
Paste Exposed to Seawater
by
V.
S.
Ramachandran, M.
S.
Cheung, and H. M. Hachem
The microstructure and compressive strength of normal portland ce- ment pastes made with a water/cement ratio (w/c) of 0.25, precured at 4 C (39.2 F) for periods ranging fmm 3 to 15 hr, and then contin- uously cured in simulated seawater of different temperatures [- 2, 0, 2 C (28.432,35.6F.j, were examined at ages up to 180 days. At low- precuring temperature, the I day compressive strength increased with increasing precuring duration. Ajter 28 or 180 days of curing in sea- water, however, the compressive strength showed a reversed trend. The development of physical, chemical, and microstructural charac- teristics of the cement paste were consistent with the strength in- creases observed at age 1 day. At older ages, strength war no longer a simple function of the degree of hydration, as complex interactions occurred between the cement paste and salts. It was evident from the cement paste morphology that these interactions resulted in a distinct paste composition which differs from that of specimens not cured in salt water.
Continuous curing in salt water at different temperatures [- 2, 0,
and 2 C (28.4,32, and 35.6 F)j did not yield significant differences in the compressive strength development. The influence of salts on strength development seems to be more pronounced in the long term
(28 days) and at higher curing temperatures. A h , results indicate that salt attack on the cement paste may continue even beyond 180
days.
During the initial curing period. low-curing temperature drastically retards the hydration process, leading to very low I day compressive strength. On the other hand, the initial rate of hydration and strength development appears to be accelerated by curing in salt water.
There is a linear relationship between the log of compressive strength and porosity for specimens; this relationship, however, be- comes nonlinear at porosity below 20 percent when specimens are cured in salt water.
Keywords: age-strength relation; cement pastes; compressive strength; low-tem- perm- mlcrostroetore; porosity; portland cements; seawater.
The growing interest in better understanding cold- weather concreting is evident from the large number of publications on the subject and the wide range of re- lated research activities. This is amply reflected in the proceedings of a recent workshop on low-temperature
The most critical period in concrete construction is the initial curing period, when concrete is transforming from the weak plastic phase into the hardened solid state. Placing concrete in a low-temperature environ- ment generally retards its strength gain and reduces its resistance to weathering. It will also result in finished concrete that is not as watertight as that which has not been frozen. In addition, if concrete is subjected to ini- tial frost damage before it has attained sufficient strength, adverse effects on the properties of the hard- ened concrete usually result.
The curing conditions of concrete used in slip-form construction in the Arctic Sea are characterized not only by the low ambient temperature at placing but also by exposure to the cold seawater within a short period of time after placing (less than 24 hr).
Aitcin, Cheung, and Shah2 carried out field and lab- oratory experiments simulating the curing conditions of concrete construction practice in the Arctic Sea. The laboratory simulation study indicated that the longer the initial curing period prior to immersion in the salt water, the higher the strength development, particu- larly during the first week. However, field data showed that the initial curing period had practically no influ- q ence on compressive strength development. The com- pressive strength of seawater-cured specimens in the field was consistently lower than that of the standard room temperature specimens. Opposite trends were ob- 4 served in the laboratory when comparing the compres- sive strength of simulated seawater-cured specimens with that of the standard-cured specimens.
Gardner, Sau, and Cheung3 also carried out similar experiments, and some of the results similarly led to conclusions that are not in total agreement with stan- effects on concrete.' Despite the difficulties associated ACIMaferials JOUIWI, V. 87, NO. 4. ~ u l y - ~ u g u s t 1990.
Received June 30, 1989. and reviewed under Institute publication policies. with its use in cold climates, concrete remains a very
Copyright AmeriEBn AU rights reserved, including popular ~ 0 n S t r ~ ~ t i 0 n material for many structures the making of copies unless permission is obtained from the copyright propri-
aon. Pertinent discussion will be published in the May-June 1991 ACI Mate- erected in the Arctic. rials J o u r n a l if recieved by Feb. 1, 1991.
V. S. -R is a principal research officer and head of the materials section of the Institute for Research in Construction. National Research Coun- cil of Canada. He received his DSc in cement chemistry from the University of Mysore. Kamataka. India.
M. S. Cheung is Manager of the Research, Development & Demonstration Di- vision, Public Works Canada. He received his PhD in civil engineering from The Universitr of Calgary. His research experience includes computational me- chanics and durability of materials. H e is currently managing a number of projects in the areas of building durability and premature deteriorations.
H. M. Hachem is a fonner mearch engineer at the Research. Development & Demonstmtion Division, Public Works Canada. H e received his MSc from The
University of Ottawa. His research interests include concrete materials and re- habilitation of existing structures.
dard findings. In that study, concrete with w/c of 0.45 and 0.35, cast and cured at 0 C (32 F) in simulated sea- water, have resulted in strength gains faster than simi- lar concrete cast and cured at 22 C (71.6 F).
The conflicting results may be explained by the dif- ficulty in maintaining a prescribed constant curing temperature in the concrete specimen. Because of the heat of hydration resulting from the reaction between cement and water, the internal temperature of the spec- imen is elevated and cannot be controlled easily. The major significant chemical interaction in a concrete specimen occurs between the cement paste and the sea- water. Thus, to investigate the effects of curing tem- perature and seawater on the structural and strength development of concrete, it was decided that cement paste specimens of relatively smaller dimensions rather than normal-sized concrete cylinders should be used, since this allows for a better control of the curing tem- perature.
In this study, portland cement paste specimens of 2 x 2 x 2 in. (5 x 5 x 5 cm) were precured at 4 C (39.2 F) for different durations, and then exposed to simulated seawater at -2, 0, and 2 C (28.4, 32, and 35.6 F). Ad- ditional specimens were moist-cured for 6 hr at 23 and 4 C (73.4 and 39.2 F), and then exposed to simulated seawater and freshwater, respectively. After curing for different durations in their respective environments, the physicochemical properties of the specimens were de- termined.
This paper presents the results of an experimental study aimed at determining the interrelationship be- tween the microstructure and the physico-mechanical characteristics of portland cement pastes prepared and hydrated under simulated Arctic Sea conditions.
RESEARCH SIGNIFICANCE
This research was conducted to study the effects of cold temperature and seawater curing on strength, mi- crostructure, and other properties of cement. The ex- perimental results indicate that the physical and chemi- cal characteristics of the cement paste, namely, compressive strength, true density, porosity, lime con- tent, weight loss, and microstructure, are significantly influenced by the curing period, the temperature, and seawater. In addition, experiments confirmed that salt- water attacks the cement compounds even after the ini-
ACI Materials Journal I July-August 1990
tial curing periods and could result in lower cement paste strength.
EXPERIMENTAL DETAILS Materials
Normal Type 10 portland cement was used in this study. The major components were as follows: trical- cium silicate = 50.74 percent; dicalcium silicate =
21.15 percent; tricalcium aluminate = 8.64 percent; te- tracalcium alumino ferrite = 8.52 percent; and calcium sulfate = 4.77 percent, totalling 93.82 percent.
Simulated seawater was prepared in the laboratory, and the concentration of constituent salts was as fol- lows: sodium chloride = 25.0 g/l (4.0 oz-mass/gal); magnesium sulfate = 4.0 g/l (0.64 oz-mass/gal); mag- nesium chloride = 3.0 g/l (0.48 oz-madgal); calcium chloride = 1.0 g/l (0.16 oz-mass/gal); and potassium chloride = 0.7 gA(0.12 oz-mass/gal), totalling 33.7 g/l (5.40 oz-madgal).
Curing baths
Five stainless steel baths 70 x 70 x 60 cm (27.6 x 27.6 x 23.6 in.) were used in the experiment. Three baths containing simulated seawater were cooled to tempera- tures of -2, 0, and 2 C (28.4, 32, and 35.6 F). The fourth bath was refrigerated and used for freshwater at a controlled temperature of 2 C (35.6 F), while simu- lated seawater at 23 C (73.4 F) was used in the fifth bath. During curing periods, the water temperature was controlled within an accuracy of k0.5 C (0.9 F).
To prevent the formation of ice on the cooling coils of the baths, rigid plastic liners approximately 50 x 50 x 50 cm (19.7 x 19.7 x 19.7 in.) with 3 cm (1.2 in.) thick walls were fitted in the refrigerated baths. Alcohol was poured between the bath walls and liners and replen- ished periodically. The alcohol and water were agitated continuously by passing compressed air through a per- forated copper tubing surrounding the bottom of all liners.
Procedure
The experimental program included the preparation and curing of cement paste cubes (w/c = 0.25) for ini- tial periods of 3, 6, 9, 12, and 15 hr in a cold room controlled at 4 C (39.2 F), and then exposing them to the simulated seawater baths controlled at -2, 0, and 2 C (28.4, 32, and 35.6 F). Some reference specimens were cured continuously in humid rooms at 23 and 4 C (73.4 and 39.2 F). Additional specimens were cured at 23 and 4 C (73.4 and 39.2 F) only for a period of 6 hr, after which they were immersed in 23 C (73.4 F) simu- lated seawater and 2 C (35.6 F) freshwater, respec- tively.
Cement paste cubes 2 x 2 x 2 in. (5 x 5 x 5 cm) were cast and tested according to ASTM C 109 procedures for compression testing of cement mortars. A w/c of 0.25 was used based on the normal consistency method recommended In ASTM C 187. Mixing of cement with water was done as outlined in ASTM C 305. The w/c and mixing procedure were kept constant for different
Curing Temperature
Precurlng Period
Curing Medlum
Set No.
w:
SWB = Sam Water Balh FWB
-
Fresh Water Bath H.HwrnFig. I-Cement paste specimen description
(a): Spoclmm d 3
:%;
0 - 1 d q 0 - 7 -:
A - ! a d q + - t a d q (b): sp.cllmn d 4P
L
0.0 a0 1z.o iao 0.0 a0 1z.o iao M a 0 12.0 110
Proaurlng P d o d (Hr) h u r l n g Polled (Hr) Pncurlng P d o d (Hr)
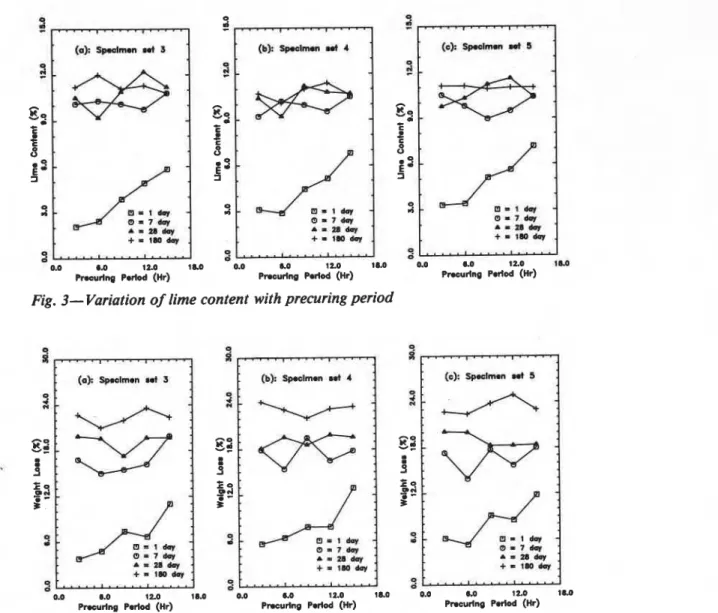
Fig. 2-Compressive strength as a function of precuring period (1 MPa = 145.03
psi)
temperatures of mixing. For samples prepared at 4 C (39.2 F), the cement, water, molds, and mixing appa- ratus were cooled to 4 C (39.2 F) before mixing.
The compressive strengths reported in this paper are averaged values, each of which represents the average of three tested cement cubes. The cubes were tested within 6 min after removal from the curing bath. After breaking the cubes, pieces weighing about 20 g (0.71 oz/mass) were selected from the interior, immersed in cold alcohol, and then placed in a freezer at
-
18 C (-0.4 F) to stop hydration at a prescribed time. The alcohol was decanted off, and then the samples were dried under continuous vacuum for 1 day.Thermal analysis was carried out using a 951-Ther- mogravimetric Analyzer (TGA) in conjunction with a
1090-Thermal Analyzer. For the TGA, 20 mg (0.71 oz- mass) samples were heated to 1000 C (1832 F) at a rate of 20 C/min (36 F/min) in a continuous flow of nitro- gen. The results of the thermal analysis are expressed in terms of calcium hydroxide and weight loss, both as a percentage of ignited sample weight. Porosity, true density, and pore-size distribution were determined us- ing the Aminco Mercury Pressure Porosimeter. Sample
342
sizes varied from 0.6 to 1.3 g (0.021 to 0.046 oz-mass). Cement morphology was also examined for selected samples using the Cambridge S-250 Scanning Electron Microscope.
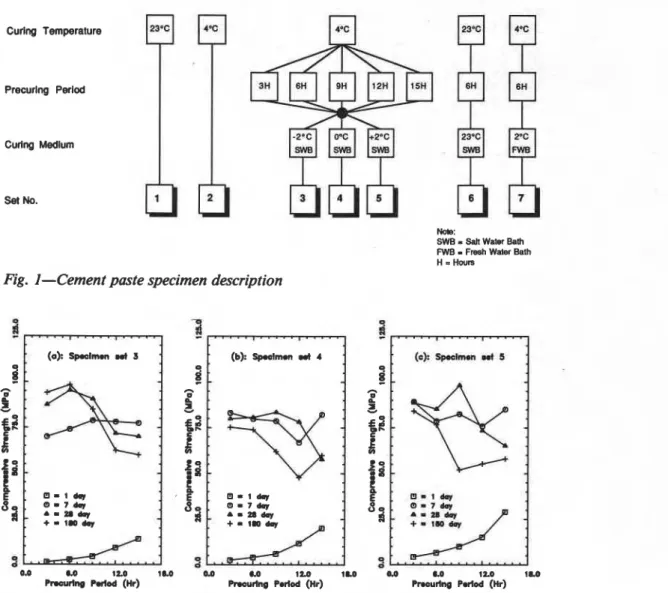
Description of specimens
Cement specimens were grouped into seven distinct sets, as shown in Fig. 1 and described here. Set 1: 23C- STD is the reference set. Specimens were prepared, cast, and cured at a temperature of 23 C (73.4 F) and at 100 percent relative humidity for 180 days. Speci- mens in Set 2: 4C-STD were prepared, cast, and moist- cured in the cold room at a temperature of
4
C (39.2 F)for 180 days. Set 3: 4C/#H/SWB/-2C represents a group of five specimens that were prepared, cast, and moist-cured in the cold room at 4 C (39.2 F) for the various curing periods (#H) of 3, 6, 9, 12, and 15 hr. Once the initial curing period was over, the specimens were submerged in the - 2 C (28.4
F)
cold simulated seawater bath (SWB). Set 4: 4C/#H/SWB/OC repre- sents a group of five specimens that were prepared, cast, and moist-cured in the cold room at 4 C (39.2F)
for the various curing periods (#H) of 3, 6, 9, 12, and-
LO LO 12.0 18.0 Pmurlng P d o d (HI)
Fig. 3-Variation of lime content with precuring period
0.0 0.0 12.0 18.0 Pmurlng P d o d (Hr) 2 -0.0 8.0 12.0 18.0 Pmurlng Porlod (Hr)
X
U
0.0 8.0 12.0 IM Pmcurlng Porlod (Hr)L
M 12.0 18.0 Pmcudng P d o d (Hr)Fig. 4-Influence of precuring period on weight loss
15 hr. Once the initial curing period was over, the spec- imens were submerged in the 0 C (32 F) simulated sea- water bath. Set 5: 4C/H/SWB/2C represents a group of five specimens that were prepared, cast, and moist cured in the cold room at 4 C (39.2 F) for the various curing periods (#H) of 3, 6, 9, 12, and 15 hr. Once the
'
initial curing period was over, the specimens were sub- merged in the 2 C (35.6 F) simulated seawater bath. In Set 6: 23C/6H/SWB/23C, specimens were prepared, cast, and cured in a 100 percent relative humidity hu- mid room at 23 C (73.4 F) for a period of 6 hr and then submerged in a simulated seawater bath controlled at 23 C (73.4F).
The specimens in Set 7: 4C/6H/FWB/2C were prepared, cast, and cured in the cold room at 4 C (39.2 F) for a period 6 hr and then submerged in afreshwater bath (FWB) controlled at 2 C (35.6
0.
TEST RESULTS AND DISCUSSION Influence of precuring period
The variation of compressive strength with precuring period for cubes of Specimen Sets 3 through 5, which
ACI Materials Journal I July-August 1990
were precured at 4 C (39.2 F) and then exposed to the cold simulated seawater, are depicted in Fig. 2(a) through (c). Only data for 1, 7, 28, and 180 days are shown.
I day-Cement strength after 1 day in the simulated seawater baths increases as the period of initial curing increases. The rate of strength increase is higher for specimens exposed to warmer simulated seawater. De- spite the low-strength development in the 1 day cement cubes [Fig. 2(a)], it is expected that hydration will con- tinue to take place even at
-
2 C (28.4 F), because sal- twater does not freeze at -2 C (28.4 F). Even fresh- water would not freeze at - 2 C (28.4 F) in narrow capillaries of the cement pastes.' This is evident from the lime content and weight loss of the 1-day curves in Fig. 3(a) and 4(a), wherein cubes initially cured for longer periods had higher values of lime content and weight loss.As cement hydrates, its volume expands and its true density decreases, as does its porosity.' Fig. 5(a) and 6(a) show these trends, particularly in terms of poros- ity, for specimens submerged in simulated seawater for 1 day. It is evident that the longer the initial curing pe-
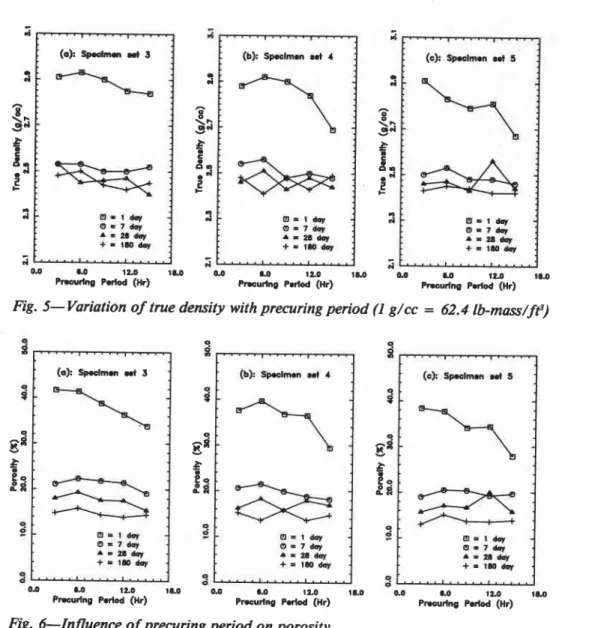
(a): Sp.clmm a d 3 2 -0.0 LO 120 1a.O Pmurlng Pulod (Hr) 0.0 LO 12.0 l a 0 h u r l n g P d o d (Hr) 0.0 LO $2.0 18.0 Pncurlng Parlod (Hr) Fig. 5- Variation of true density with precuring period (I g/cc = 62.4 lb-mass/
ff)
(a): Spoelmom wt 3
a
0.0 I.0 110 16.0 Pncurlng P.riod (Hr) 0.0 LO 120 1 M Pmurlng Perlod (Hr) Fig. 6-Influence of precuring period on porosityriod, the more the hydration and, hence, the lower the cement porosity and true density.
7 day-As expected, the 7 day compressive strengths
are substantially higher than the 1-day strengths. Un- like that for the 1 day cement paste, compressive strength variation with the precuring period is no longer a simple steady climb. Fig. 2(a) through (c) show that the compressive strength is practically the same for specimens initially cured for periods varying between 3 and 15 hr. Similar trends are observed in Fig. 3(a) through (c), 4(a) through (c), 5(a) through (c), and 6(a) through (c) for the l i e content, weight loss, true den- sity, and porosity.
28 day and 180 day-The strengths at 28 and 180
days are higher [87.5 MPa and 94.1 MPa (12,691 and 13,256 psi), respectively] for specimens with an initial curing period of 3 hr than those with 15 hr of initial curing [Fig, 2(a)]. The compressive strengths for the latter precuring period are 70.2 and 60.1 MPa (10,182 and 8716 psi), respectively, for the 28 and 180-day specimens. From this, it is evident that the precuring period has a significant influence on the long-term strength of cement pastes exposed to cold seawater.
Continuous hydration takes place in specimens that
are precured in 100 percent relative humidity and sub- sequently immersed in seawater. The hydration is also likely accelerated by seawater in the early stages so that, by 28 days, much of the hydration is completed. Hydration tends to increase the strnegth of cement. Concurrent with hydration, however, is the attack by saltwater on the cement paste, and the complex com- pounds that are formed tend to decrease the strength of the paste.6 These reactions dominate at the latter stages of curing when much of the hydration has been com- pleted. It is, therefore, conceivable that for curing pe- riods longer than 180 days, further attack by seawater could result in even lower cement paste strengths.
The variation of lime content, weight loss, true den- sity, and porosity was reasonably constant for speci- mens precured for different periods (see Fig. 3 through
6). Lime content variation with different precuring pe-
riods is not very different at 28 and 180 days (Fig. 3). However, the weight loss is consistently higher for samples cured for 180 days (Fig. 4). This would indi- cate that the composition of the paste at 180 days is different from that at 28 days. These observations fur- ther indicate that several compounds are formed by the interaction of seawater with the cement hydrate. True
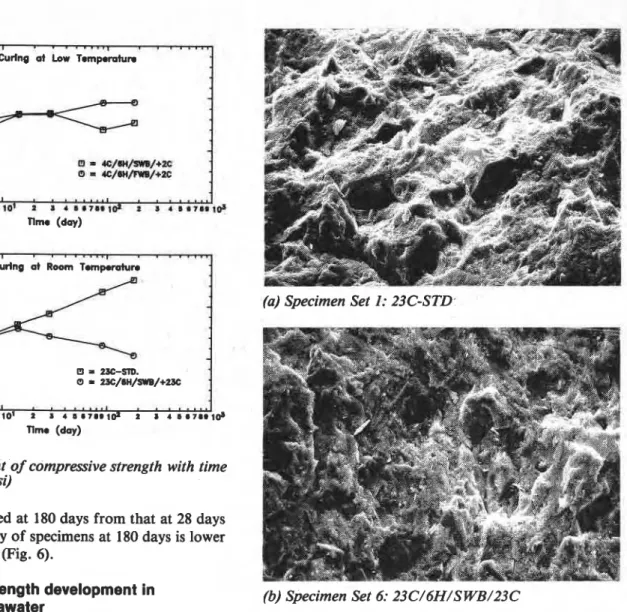
(a): Curlng al Low Tampamtun
a = I E m m m / + P C
a = I E / w / ~ ~ / + K
(a) Specimen Set I: 23C-STD-
Fig. 7-Development of compressive strength with time (I MPa = 145.03 psi)
density is not changed at 180 days from that at 28 days (Fig. 5). The porosity of specimens at 180 days is lower than that at 28 days (Fig. 6).
Comparison of strength development in freshwater and seawater
To explain the strength development in seawater, some investigations were carried out to compare the strengths in cement pastes cured in freshwater for dif- ferent curing periods. Fig. 7(a) shows compressive strength development with time for specimens exposed to 2 C (35.6 F) simulated seawater and freshwater. It is evident that strength development for cement paste ex- posed to fresh or saltwater is practically the same for the first 28 days. However, specimens exposed to sea- water exhibit a drop in compressive strength with time
1 beyond 28 days. The 180 day compressive strength for
cement paste exposed to 2 C (35.6 F) freshwater was 96.0 MPa (13,924 psi), while that for specimens ex- 'J posed to 2 C (35.6 F) simulated seawater was 76.7 MPa (1 1,124 psi). Further investigations showed that curing at 23 C (73.4 F) in seawater decreases strength after 14 days of exposure. Moist curing, on the other hand, showed a continued steady increase in strength even up to 180 days. The strength at 180 days for cement paste at 23 C (73.4 F) is 125.6 MPa (18,217 psi), while that for specimens exposed to seawater is 53.1 MPa (7702 psi) [see Fig. 7(b)].
The lower strengths in seawater-cured specimens have already been explained by the interactions between salts in seawater and the cement hydrate. Studies involving lime content, weight loss, true density, and porosity did not show significant differences between moist-cured
ACI Materials Journal I July-August 1990
(b) Specimen Set 6: 23C/6H/S WB/23C
Fig. 8-Influence of seawater salts on cement paste morphology at 180 days
and seawater-cured specimens. Lower strengths cannot be directly rationalized in terms of the degree of hydra- tion or porosity; they are better explained by the devel- opment of microcracks as a consequence of exposure to seawater. The two micrographs of cement paste cured at 23 C (73.4 F) for 180 days in seawater and freshwa- ter (Fig. 8) show that the paste cured in seawater has a different morphology from that cured in freshwater. The paste cured in seawater shows more discrete units and more microcrack development.
If the cement paste specimens do not come into con- tact with seawater, the long-term strength development is not affected much, whether the paste is cured at 23 or 4 C (74.3 or 39.2 F). The 1-day strengths for speci- mens cured at 4 and 23 C (39.2 and 73.4 F) are, respec- tively, 8.70 and 61.5 MPa (1262 and 8920 psi). Beyond about 14 days, the rate of strength development for specimens is very similar, as indicated in Fig. 9.
Porosity-compressive strength relations
Extensive work has been carried out t o relate compression strength to porosity. In cement paste sys- 345
Fig. 9-Compressive strength development for moist- cured cement pastes (I MPa = 145.03 psi)
5
/
a m -.---
C
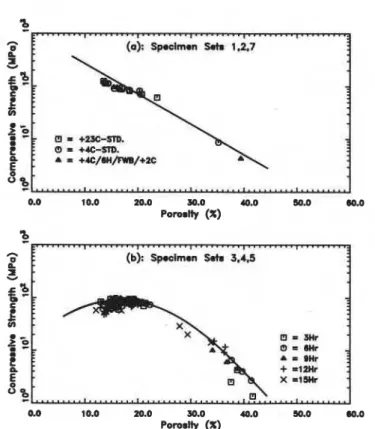
A. -/snmI+= 0.0 10.0 10.0 30.0 40.0 50.0 60.0 Poroalty (X) 0.0 10.0 10.0 50.0 40.0 30.0 60.0 Poroalty (X)Fig. 10-Compressive strength-porosity relationships in cement pastes (I MPa = 145.03 psi)
tems, a semilog plot of strength with porosity usually shows a linear relati~nship.~
Fig. l q a ) shows a plot of strength versus porosity for pastes moist-cured and not exposed to saltwater. A lin- ear relationship is observed. Specimens cured in salt- water [Fig. lo(%)] show a linear strength-versus-poros- ity relationship greater than about 20 percent. At poros- ity below this value, i.e., for specimens with longer curing periods, the relationship is essentially nonlinear, indicating a cement paste composition change caused by seawater attacks.
Compressive strength development
In Fig. 11, the strength development in cement pastes (a) moistcured continuously at 4 C (39.2 F); (b) pre- cured for 6 hr at 4 C (39.2 F) and then continuously exposed to freshwater; (c) precured for 6 hr at 4 C (39.2 F) and then saltwater-cured at 2 C (35.6 F); and (d)
Fig. 11-Compressive strength relative to that of stan- dard-cured specimens
precured at 23 C (73.4 F) for 6 hr and then cured in saltwater at 23 C (73.4 F), is compared with that in specimens continuously at 23 C (73.4 F).
The deleterious effects of low-temperature curing in saltwater on strength development are most significant during the early period of hydration (1-day-old cement paste). During this period, the low-curing temperature retards the hydration process, leading to a very low 1 day compressive strength. The relative compressive
strength can be as low as 0.1 at 1 day. With time and
I
particularly during the first week of hydration, the rel-ative compressive strength increases sharply to a value between 1 .O and 1.2 at Day 7. After 7 days, the relative compressive strength begins to decrease gradually with time. At 180 days, relative compressive strength
can
be as low as 0.4. It is evident that the rate of decrease in the compressive strength is dependent on the curing conditions. The rate of strength decrease is lowest for the specimen continuously moist-cured at 4 C (39.2 F). Specimens precured at 23 C (73.4 F) for 6 hr and then immersed in simulated seawater show the highest rate of strength decrease.Because detrimental effects of saltwater on cement physicochemical properties of the cement paste are mainly chemical in nature, and since chemical reactions are usually accelerated at higher temperatures, detri- mental effects in specimens exposed to 23 C (73.4 F) simulated seawater bath are, therefore, the most pro-
nounced. For specimens continuously cured at low 1
temperature [4 C (39.2 F)] but not exposed to saltwa- ter, the relative strength stabilizes around 1.0 after 28
days. For specimens exposed to simulated seawater, the t
relative strength is seen to decrease with time. This in- dicates that compressive strength reduction with time is caused by the saltwater attack. Chemical attacks on the cement paste seem to continue at the same rate even af- ter 90 days.
CONCLUSIONS
The physical and chemical characteristics of cement paste, namely, compressive strength, true density, po- rosity, lime content, weight loss, and microstructure, are influenced by the precuring period, the temperature
.
at which the specimens are precured, and the curing environment.Specimens precured in moisture at 4 C (39.2 F) and subsequently exposed to simulated seawater at
-
2, 0, and 2 C (28.4, 32, and 35.6 F) for different durations show that the l-day strength increases with the precur- ing period. Lime content and weight loss showed simi- lar trends, while porosity and true density followed de- creasing trends with the precuring period. At longer curing periods of 28 and 180 days, the strength de- creases as the precuring period increases, whereas po- rosity, true density, lime content, and weight loss did not show significant variation. In other words, strength is no longer a simple function of degree of hydration because of the complex interactions between the pastew and salts. Long-term strengths developed by the ce-
ment paste, cured in simulated seawater at
-
2, 0, and 2 C (28.4, 32, and 35.6 F) are similar.B Specimens continuously moist-cured at 4 C (39.2 F) and those cured in simulated seawater at 2 or 23 C (35.6 or 73.4 F) developed strengths at almost the same rate up to 14 days, after which those exposed to saltwater showed gradual loss of strength. This is caused by the attack of salts on the cement paste, which is more pro- nounced at the higher curing temperature. It is evident from the cement paste morphology that the interac- tions between salts and cement components result in a distinct cement composition characterized by discrete units and microcrack developments. These characteris- tics lead to long-term strength degradation in the ce- ment paste.
At later stages of curing, specimens that were moist- cured at ambient temperature developed compressive strengths that are higher than those in specimens cured at 4 C (39.2 F) and those in specimens exposed to salt- water. During the early curing stages (less than 7 days), specimens cured in seawater showed higher strengths than those cured in freshwater, because seawater may have accelerated the rate of hydration. In the early pe- riods of seawater curing, specimens cured at low tem-
perature develop strengths at a slower rate and ap- proach the strength of standard-cured specimens 123 C
(73.4
l?)]
at around 7 days, but subsequent to this the strengths decrease considerably, relative to the stan- dard-cured specimen. Moreover, specimens cured in moisture at any comparable temperature show higher strength than those cured in seawater.There is a linear relationship between log compres- sive strength and porosity for moist-cured specimens. Specimens that were exposed to seawater continuously also show a linear relationship, but only for porosity greater than about 20 percent; below this porosity value, the relationship is essentially nonlinear. This in- dicates a change in the physical and chemical structure of the paste.
ACKNOWLEDGMENT
This research was carried out jointly by Public Works Canada and the Institute for Research in Construction. National Research Coun- cil of Canada. The authors gratefully acknowledge the experimental assistance provided by Messrs. G. M. Polomark and A. Kearney.
REFERENCES
1. Proceedings, Workshop on Low Temperature Effects on Con- crete. Canada/Japan Science and Technology Cooperative Agree- ment, Sapporo, 1988,417 pp.
2. Aitcin, Pierre-Claude; Cheung, Moe S.; and Shah. Vinay S., "Strength Development of Concrete Cured Under Arctic Sea Condi- tions." Temperature wfects on Concrete, STP-858, ASTM, Phila- delphia, 1985, pp. 3-20.
3. Gardner, N. J.; Sau, P. L.; and Cheung, M. S.. "Strength De- velopment and Durability of Concretes Cast and Cured at 0 C." ACI Materials Journal, V. 85, No. 6, Nov.-Dec. 1988, pp. 529-536.
4. Ramachandran, V. S., Calcium Chloride in Concrete, Applied Science Publishers. London. 1978. 246 pp.
5. Ramachandran, V. S., and Feldman, R. F., "Time-Dependent and Intrinsic Characteristics of Portland Cement Hydrated in the Presence of Calcium Chloride." I1 Cemento (Rome), V. 75, 1978, pp. 311-322.
6. Ramachandran, V. S.; Feldman, R. F.; and Beaudoin, J. J.. Concrete Science, Heyden and Son Ltd., London, 1981, 427 pp.