Université de Sherbrooke
Comparison of the Effects of Cobalt-60 -Rays and Tritium Particles on Water Radiolysis and Aqueous Solutions
and
Radiolysis of the Ceric-Cerous Sulfate Dosimeter at Elevated Temperature
par
Leila MIRSALEH KOHAN
Département de médecine nucléaire et radiobiologie
Mémoire présenté à la Faculté de médecine et des sciences de la santé en vue de l‟obtention du grade de maître ès sciences (M.Sc.) en sciences des radiations et imagerie biomédicale
Sherbrooke, Québec, Canada Janvier 2014
Jury
Pr Abdelouahed Khalil Examinateur, Département de médecine, Service de gériatrie,
Faculté de médecine et des sciences de la santé Pr M‟hamed Bentourkia Examinateur, Département de médecine nucléaire et
radiobiologie, Faculté de médecine et des sciences de la santé Pr Jean-Paul Jay-Gerin Directeur de recherche, Département de médecine nucléaire
et radiobiologie, Faculté de médecine et des sciences de la santé
ii
RESUMÉ
COMPARAISON DES EFFETS DES RAYONS DU COBALT-60 ET DES
RADIATIONS DU TRITIUM SUR LA RADIOLYSE DE L’EAU ET DES
SOLUTIONS AQUEUSES ET RADIOLYSE DU DOSIMÈTRE AU SULFATE CÉRIQUE-CÉREUX À TEMPÉRATURE ÉLEVÉE
Leila MIRSALEH KOHAN
Département de médecine nucléaire et radiobiologie
Mémoire présenté à la Faculté de médecine et des sciences de la santé en vue de l‟obtention du grade de maître ès sciences (M.Sc.) en sciences des radiations et imagerie biomédicale, Faculté de médecine et des sciences de la santé, Université de Sherbrooke, Sherbrooke, Québec, Canada, J1H 5N4.
La méthodologie de simulation Monte-Carlo s‟est révélée être une très puissante technique dans l‟étude des mécanismes de la radiolyse de l‟eau. En particulier, la simulation Monte-Carlo se rend même plus importante quand les résultats expérimentaux ne sont pas disponibles, notamment dû aux difficultés techniques. Le mémoire actuel représente une étude sur la radiolyse de l‟eau irradiée par différents rayonnements à différentes températures, en utilisant la simulation Monte-Carlo. Dans la première partie de ce mémoire, on examine les mécanismes d‟auto-radiolyse de l‟eau tritiée ainsi que l‟importance de l‟effet de “transfert linéaire d'énergie” (TLE) en comparant les électrons β -de 3H avec les rayons de 60Co. Nos simulations montrent que, pour les rayons β- de 3H, on observe moins de production de radicaux libres et plus de produits moléculaires. Ces différences de rendement sont en accord avec les différences de distribution non-homogène des espèces primaires transitoires dans les deux cas. En résumé, nos résultats corroborent bien avec les travaux publiés précédemment et donnent une perspective de la radiolyse β -de 3H qui est en majorité contrôlée par l‟action chimique de « trajectoires courtes » de TLE local élevé. La même tendance pour la production des radicaux libres et des produits moléculaires a été trouvée en milieu acide ainsi que pour le dosimètre aéré de Fricke. Un de nos résultats principaux montre que le rendement G(Fe3+) du dosimètre de Fricke peut être mieux reproduit si une seule énergie électronique moyenne « équivalente » de ~7.8 keV est utilisée pour mimer la déposition d‟énergie par les particules - du tritium (au lieu de la valeur moyenne de ~5.7 keV qui est utilisée fréquemment). Ceci est en complet accord avec une recommandation du rapport 17 de l‟ICRU. La deuxième partie de ce mémoire concerne la radiolyse du dosimètre au sulfate cérique-céreux à températures élevées. Lors de cette radiolyse, H• (ou HO2• en présence d‟oxygène) et H2O2 produits par la
décomposition radiolytique de l‟eau réduisent les ions cériques Ce4+ en ions céreux Ce3+, tandis que les radicaux •OH oxydent Ce3+ en Ce4+. Nos simulations montrent que le rendement G(Ce3+) décroît quasi linéairement avec la température entre 25 et 250 °C, en excellent accord avec l‟expérience. Au-dessus de 250 °C, notre modèle prédit une diminution marquée de G(Ce3+) jusqu‟à ce qu‟on l‟observe, au lieu d‟une réduction de Ce4+, une oxydation de Ce3+. Nous montrons que cette diminution est due à l‟intervention de la réaction des atomes H• avec l‟eau en milieu homogène.
Mots clés: Radiolyse de l‟eau, simulation Monte-Carlo, eau tritiée, particules - de
3H, rayons de 60Co, radicaux libres et produits moléculaires, dosimètre de Fricke,
ABSTRACT
COMPARISON OF THE EFFECTS OF COBALT-60 -RAYS AND TRITIUM
PARTICLES ON WATER RADIOLYSIS AND AQUEOUS SOLUTIONS AND RADIOLYSIS OF THE CERIC-CEROUS SULFATE DOSIMETER AT ELEVATED
TEMPERATURE Leila MIRSALEH KOHAN
Department of Nuclear Medicine and Radiobiology
Thesis presented at the Faculty of Medicine and Health Sciences in order to obtain the Master degree of Sciences (M.Sc.) in Radiation Sciences and Biomedical Imaging, Faculty of Medicine and Health Sciences, Université de Sherbrooke, Sherbrooke, Québec, Canada, J1H 5N4
Monte Carlo simulations have proven to be very powerful techniques to study the radiolysis of water and the mechanisms underlying this radiolysis. Monte Carlo simulations particularly become important when there are no experimental results available in the literature due, for instance, to the difficulty of performing such experiments. This thesis presents a study of the radiolysis of water irradiated by different types of radiation and at various temperatures, employing Monte Carlo simulations. The first part of the thesis uses Monte Carlo simulations to elucidate the mechanisms involved in the self-radiolysis of tritiated water and to examine the importance of the effects of higher “linear energy transfer” (LET) by comparing 3H β- radiations (mean initial energy of ~5.7 keV) with 60Co -rays (~1 MeV electrons). Our simulations showed that, for 3H -, we observe lower radical and higher molecular yields than in -radiolysis. These differences in yields are consistent with differences in the nonhomogeneous distribution of primary transient species in the two cases. Overall, our results corroborate well with previously reported work, and support a picture of 3H β- radiolysis mainly driven by the chemical action of “short tracks” of high local LET. This same trend in yields of radical and molecular products was also found under acidic conditions as well as in the aerated Fricke dosimeter. One of our main findings was that the measured Fricke yield G(Fe3+) could be best reproduced if a single, mean “equivalent” electron energy of ~7.8 keV were used to mimic the energy deposition by the tritium - particles (rather than the commonly used mean of ~5.7 keV), in full agreement with a previous recommendation of ICRU Report 17. The second part of this thesis investigates the radiolysis of the ceric-cerous sulfate dosimeter at elevated temperatures. In this radiolysis, H• (or HO2• in the presence of oxygen) and H2O2 produced by the radiolytic
decomposition of water both reduce Ce4+ ions to Ce3+ ions, while •OH radicals oxidize the Ce3+ present back to Ce4+. Our simulations showed that the net Ce3+ yield decreases almost linearly with increasing temperature up to ~250 °C, in excellent agreement with experiment. Above 250 °C, our model predicts that G(Ce3+) drops markedly with temperature until, instead of Ce4+ reduction, Ce3+ oxidation is observed. This drop is shown to result from the occurrence of the reaction of H• atoms with water in the homogeneous chemical stage.
Keywords: Radiolysis of water, Monte Carlo simulation, tritiated water, G-values,
3H rays, 60Co -rays, free radical and molecular yields, LET, Fricke dosimeter,
iv
TABLE OF CONTENTS
LIST OF TABLES vi
LIST OF FIGURES vii
LIST OF ABBREVIATIONS xv
I. INTRODUCTION 1
I.1. Radiation chemistry 1
I.2. Ionizing radiation 1
I.3. Tracks in liquid water 3
I.3.1. Track structure in radiation chemistry and radiobiology 3
I.3.2. Low-LET radiation 4
I.3.3. High-LET radiation 6
I.4. A comparison between 3H particles and 60Co -rays 8
I.5. Radiolysis of liquid water and aqueous solutions 10
I.5.1. The radiolysis of water 10 I.5.2. Time scale of events and formation of primary radical 12 and molecular products in neutral water radiolysis
I.6. The effect of pH on water radiolysis 17
I.7. The Fricke dosimeter 21
I.8. The ceric-cerous dosimeter 23
I.9. High-temperature radiation chemistry 25
I.10. Monte Carlo simulations 27
I.10.1. The IONLYS simulation code 29
I.10.2. The IRT simulation code 33
I.11. Monte Carlo simulations under acidic conditions 38
I.12. Simulation of the Fricke dosimeter 40
I.13. Simulation of the cerous-ceric dosimeter 42
I.14. Incorporating temperature effects in the simulations 43
I.15. Experimental methods 47
I.16. Research objectives 47
II. ARTICLE NO. 1 49
L. Mirsaleh Kohan, S. Sanguanmith, J. Meesungnoen, P. Causey,
C. R. Stuart, and J.-P. Jay-Gerin
“Self-radiolysis of tritiated water. 1. A comparison of the effects of
60Co -rays and tritium -particles on water and aqueous
solutions at room temperature.”
RSC Advances (Royal Society of Chemistry) 3, 19282-19299 (2013)
III. FURTHER STUDIES ON THE EFFECTS OF 60CO -RAYS AND
TRITIUM PARTICLES ON WATER AND AQUEOUS
SOLUTIONS AT 25 °C 96
III.1. Free radical and molecular yields in acidic conditions
for β and γ radiation in water 96
III.1.1. The reducing free radical species e-aq and H• 97
III.1.2. Hydroxyl radical 100
III.1.3. Hydrogen peroxide 102 III.1.4. Molecular hydrogen 104
III.2. Calculation of ∆G(Fe3+) for the and -radiolysis of
1 mM FeSO4 in aerated aqueous 0.4 M H2SO4 solution 106
IV. ARTICLE NO. 2 108
L.Mirsaleh Kohan, R.Meesat, J. Meesungnoen, S. Sanguanmith,
and J.-P. Jay-Gerin
“Effect of temperature on the low linear energy transfer radiolysis of the ceric-cerous sulfate dosimeter: A Monte Carlo simulation study.”
Radiation Research (Accepted)
V. RADIOLYSIS OF THE CERIC-CEROUS DOSIMETER:
EXPERIMENTAL INVESTIGATION 129
V.1. The ceric-cerous dosimeter in the presence of oxygen 130
V.2. The ceric-cerous dosimeter without oxygen 132
V.3. ∆G(Ce3+) for different concentrations of Ce3+ ions 134
V.4. A comparison between simulated G(Ce3+) values and
available experimental data in the literature 136
VI. DISCUSSION AND CONCLUSION 138
VII. ACKNOWLEDGMENTS 140
VIII. REFERENCES 141
IX. APPENDIX: ARTICLE NO. 3 164
S. Sanguanmith, Y. Muroya, J. Meesungnoen, M. Lin, Y. Katsumura,
L. Mirsaleh Kohan, D.A. Guzonas, C.R. Stuart, and J.-P. Jay-Gerin
“Low-linear energy transfer radiolysis of liquid water at
elevated temperatures up to 350 °C: Monte Carlo simulations.”
vi
LIST OF TABLES
Table I.1 Fraction of the total absorbed energy deposited in short tracks, ...…...10 blobs, and spurs for different types of radiation: low-LET 60Co γ radiation and moderately high-LET 3H β radiation (SPINKS and WOODS, 1990). Table I.2 Main spur/track reactions and rate constants (k) for the radiolysis………...20
of pure liquid water at 25 °C (from MEESUNGNOEN, 2007). Some values of k have been updated by using the most recently available data of ELLIOT and BARTELS (2009).
Table I.3 Values of ferric-ion yields G(Fe3+) (in molecule/100 eV) for …………...22 the Fricke dosimeter irradiated with different types of radiation, at 25 °C. Table I.4 Values of cerous-ion yields G(Ce3+) (in molecule/100 eV) for………...25
the ceric-cerous dosimeter irradiated with different types of radiation, at 25 °C.
Table I.5 Reactions added to the pure water reaction scheme to simulate ...…….39 the radiolysis of aqueous H2SO4 solutions, at 25 °C (from
AUTSAVAPROMPORN et al., 2007).
Table II.1 Main spur/track reactions and rate constants (k) used in our..……..………66 simulations of the radiolysis of pure liquid water at 25 °C. For first-order reactions (indicated by the symbol §), the value of k is given in s-1.
Table V.1 Initial concentrations of ceric sulfate for measurements in ………129 different dose regions (DRAGANIĆ and DRAGANIĆ, 1971).
Table V.2 A comparison between simulated G(Ce3+) in this study and ………137 the experimental results obtained by MATTHEWS (1971, 1973).
LIST OF FIGURES
Chapter I
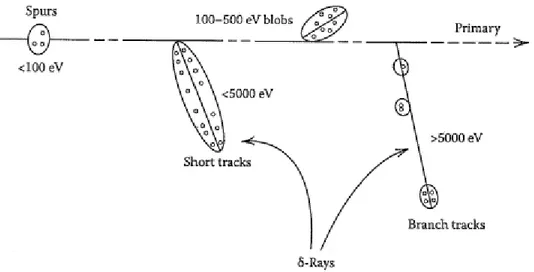
Figure 1 Track structure classification by track entities so-called spurs …………5 (spherical entities, up to 100 eV), blobs (spherical or ellipsoidal, 100–500 eV), and short tracks (cylindrical, 500 eV–5 keV) for a primary high-energy electron (not to scale). “Adapted with permission from BURTON (1969). Copyright (1969) American Chemical Society”. The energy partition between the three track entities strongly depends on the incident particle energy, dividing approximately as the ratio of 0.75:0.12:0.13 between the
spur, blob, and short track fractions for a 1-MeV electron in liquid water
(PIMBLOTT et al., 1990).
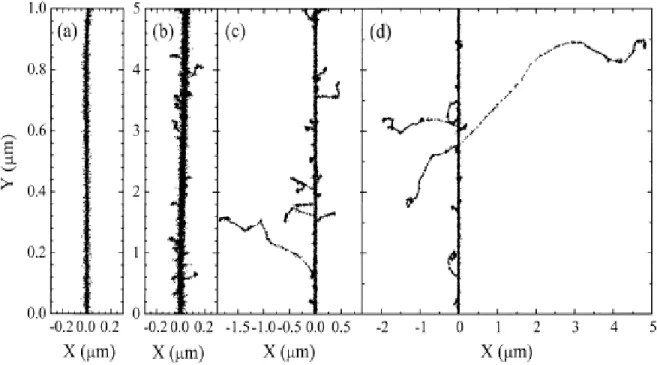
Figure 2 Simulated tracks (projected into the XY plane of figure) of………6 five 150-keV electrons in water, showing the stochastic nature of paths. Each electron is generated at the origin and starts moving vertically upwards. Figure 3 Projections over the XY plane of track segments calculated………7
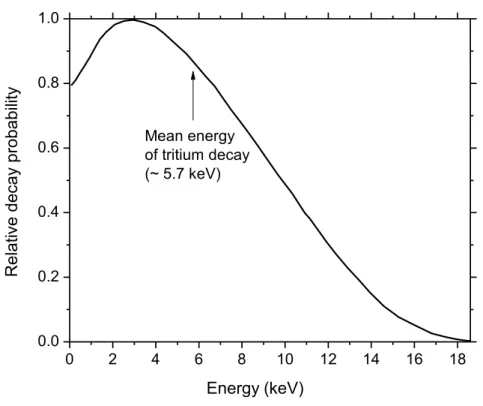
(at ~10-13 s) for (a) 1H+ (0.15 MeV), (b) 4He2+ (1.75 MeV/nucleon), (c) 12C6+ (25.5 MeV/nucleon), and (d) 20Ne10+ (97.5 MeV/nucleon) impacting ions. Ions are generated at the origin and along the Y axis in liquid water under identical LET conditions (~70 keV/m). The track segments for the different ions have been chosen equal to 5 m, except for 1H+, for which we have adopted a track length of 1 m. This reduction in the track length for 1H+ was dictated by the fact that the penetration range of this ion in liquid water, at the considered energy of 0.15 MeV, amounts to only ~2.3 m. For the case of a 1-m segment of 0.15 MeV proton track, the LET is nearly constant (~70 keV/m) along the trajectory. Dots represent the energy deposited at points where an interaction occurred (MUROYA et al., 2006). Figure 4 The 3H decay energy spectrum (Source: T.J. BOWLES and………...9
R.G.H. ROBERTSON, Los Alamos Science 1997, No. 25, 86).
Figure 5 Time scale of events that occur in the low-LET radiolysis of ……….15 neutral, deaerated water. “Adapted from MEESUNGNOEN (2007)”.
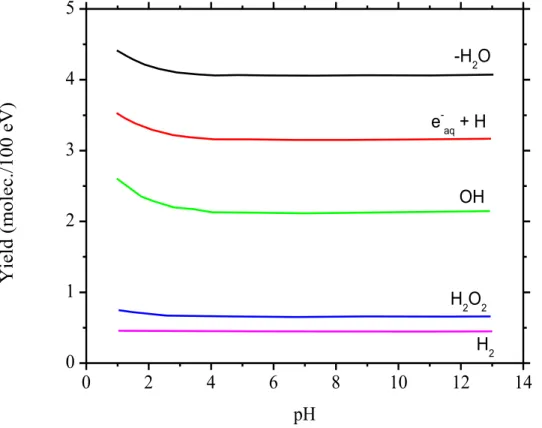
Figure 6 The effect of pH on the primary radical and molecular yields in…………..19 γ-radiolysis of water. There is a relatively small increase (~7%) in the water decomposition when the pH is varied from 3 to 1.3. “Adapted with permission from DRAGANIĆ et al. (1969). Copyright (1969) American Chemical Society”.
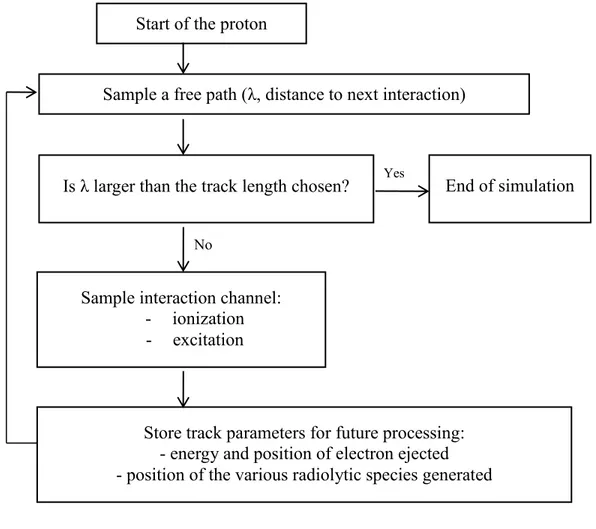
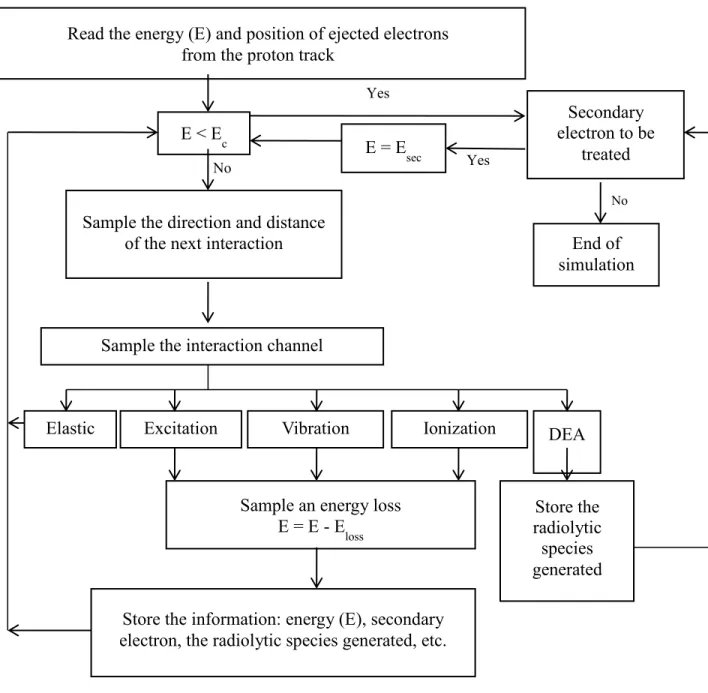
Figure 7 Algorithm of the TRACPRO simulation program…………...…………....32 Figure 8 Algorithm of the TRACELE simulation program………...34
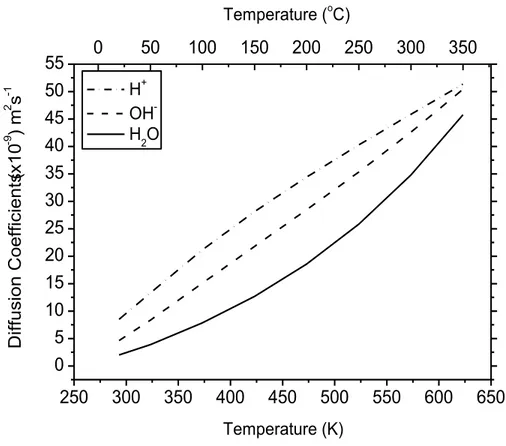
viii Figure 9 Algorithm of the IRT simulation program…………...………..…………..35 Figure 10 Diffusion coefficients (D) for various track species involved..…….……...37
in our simulations (ELLIOT and BARTELS, 2009). Chapter II – Article No. 1
Figure 1 The 3H -decay energy spectrum (Source: Bowles, T. J.; ………55 Robertson, R. G. H. Los Alamos Science 1997, No. 25, 86).
Figure 2 Simulated track histories (at ~10-13 s, projected into the XY………57 plane of figure) of a 5.7-keV -electron (mean LET ~ 5.9 keV/m) and a 300-MeV proton (LET ~ 0.3 keV/m) incident on liquid water at 25 °C. The two irradiating particles are generated at the origin and start traveling along the Y axis. Dots represent the energy deposited at points where an interaction occurred.
Figure 3 Time scale of events and main primary products in the ………..61 or fast electron radiolysis of water (ref. 15). Ionization (H2O•+) and
electronic excitation (H2O*elec) are the most important “primary processes”.
The (“dry”) electron ejected from an ionized water molecule undergoes scattering as it moves away from its parent cation. Once it has slowed down to thermal energy (eth), it can get localized or trapped (etr) in the liquid,
before it reaches a fully relaxed, hydrated (eaq) state. The ejected electron
can also be recaptured, prior to its thermalization, by the parent cation to form a vibrationally excited neutral molecule (H2O*vib). The dry electron that
escapes “geminate recombination” can be temporarily captured resonantly by a water molecule and undergo a “dissociative electron attachment” process responsible, at least in part, for the production of H2 at early times.
As for the H2O•+ radical cations, energetically very unstable, they quickly
undergo a proton transfer reaction with neighboring H2O molecules to form •OH radicals. Little is known about the decay channels for H
2O* in the
liquid phase and the branching ratios associated with each of them. They are generally assumed to be essentially the same as those reported for an isolated water molecule (note that the same decay processes have been reported to occur for H2O*elec and H2O*vib in the gas phase). By ~2 10-7 s, the time for
completion of spur processes (ref. 29), the initial highly nonhomogeneous spatial distribution of reactive species has relaxed. Finally, in the time domain beyond a few microseconds, the reactions that occur in the bulk solution can usually be described with conventional “homogeneous chemistry” methods.
Figure 4 Variation of the “entrance” LET (in keV/m) as a function………68 of the impact energy (in eV) of electrons calculated using the module TRACEPR of IONLYS for liquid water at 25 °C. The data reported by Watt
(ref. 2), Paretzke et al. (ref. 62), and Pimblott et al. (ref. 63), and the recommendations of ICRU Report 16 (ref. 64) and ICRU Report 37 (ref. 65) for liquid water (density: 1 g/cm3) are also shown for the sake of comparison. Note that these values for the LET are also reported in the literature under the (synonymous) name of “mass stopping power”, expressed in units of MeV cm2/g of material. A mass stopping power of 10 MeV cm2/g corresponds to an LET of 1 keV/m in unit density material.
Figure 5 Distribution of energy-loss events for electrons of 150- and ………69 5.7-keV incident energies in liquid water at 25 °C. Electrons are followed over their whole track until their energy is lower than ~7.3 eV (threshold for electronic excitation). The corresponding average energies lost per event are found to be ~47 and 30.5 eV, respectively. 100 000 track histories were used in the simulations of 5.7-keV -electrons.
Figure 6 Time dependence of the yields (in molecule/100 eV) of the ………71 various radiolytic products (e
aq, H•, H2, •OH, and H2O2) for the radiolysis of
pure, air-free liquid water (pH 7) by ~300-MeV incident protons (which mimic irradiation with 60Co -rays or fast electrons) and 3H -particles with initial energies of ~5.7 keV (average energy of tritium decay) and ~7.8 keV (mean energy of energy deposition by the -particles) at 25 °C, over the time interval 10-12 to 10-6 s. The three different lines show the results of our Monte Carlo simulations for the - (black solid line) and tritium - (blue solid and dashed lines, respectively) irradiations considered. Experimental data for -irradiations are as follows. •OH radical: (○) and (●), direct picosecond pulse radiolysis measurements (ref. 70) up to ~1 and 4 ns, respectively; (◊), inferred from pulse radiolysis experiments at very high dose rates (ref. 71); (□), -radiolysis of water with radical scavenger techniques employing formic acid (ref. 72); eaq: (●) (ref. 70) and (red solid
line) (ref. 73) obtained directly in picosecond pulse radiolysis experiments using G(eaq) = 4.1 ± 0.2 molecules/100 eV at 20 ps (ref. 74); (■) obtained
indirectly from nanosecond pulse radiolysis using methyl viologen (MV2+) scavengers (ref. 73); H2O2: () (ref. 75); (▲) represents the “primary”
radical and molecular yield values given in eq. [2] (ref. 13,14,35). Note that these latter data have all been placed at ~2 10-7 s, the time at which spur expansion is complete at 25 °C (ref. 29). The only relatively well documented experimental yield data for 3H -irradiations are for H2, all
inferred from scavenger studies. The H2 yields shown (in blue) in the figure
are from tritium -irradiated aqueous solutions of CuSO4: () (ref. 17)17 and
(♦) (ref. 27) and of NaN3: (∆) (ref. 27). We used here the scavenging
capacity of the solutions for eaq and H• as reported in Figs. 2 and 3 of ref. 19.
Finally, the dotted lines (in blue) show the time dependences of the yields of
•OH and e
aq after 3H particle irradiation as obtained by Harris and
Pimblott (ref. 19) using stochastic track chemistry calculations with 5.6-keV incident electrons.
x Figure 7 Distribution of energy deposition (or “energy fluence rate”)………72 by the tritium -electrons with respect to energy, f(E) (see text). The “equivalent” electron energy of ~7.8 keV corresponds to the mean energy derived from this distribution. Note that this energy was used in plotting results for tritium in Fig. 13.
Figure 8 Comparison of the time dependence of the extents G………76 (in molecule/100 eV), calculated from our Monte Carlo simulations over the interval 10-12-10-6 s, of the main spur/track reactions that occur in pure, air-free liquid water (pH 7) at 25 °C after irradiation with 300-MeV incident protons (which mimic irradiation with 60Co -rays) and 5.7-keV tritium -particles, and that contribute to the formation and decay of the hydrated electron (panels a and b), H2 (panels c and d), and H2O2 (panels e and f).
Figure 9 Time dependence of the yields (in molecule/100 eV) of the ………78 various radiolytic products (e
aq, H•, H2, •OH, and H2O2) for the radiolysis of
0.05 M aqueous solution of H2SO4 (pH 1.3) by ~300-MeV incident protons
(which mimic irradiation with 60Co -rays) and 3H -particles with initial energies of ~5.7 keV (average energy of tritium decay) and ~7.8 keV (mean energy of energy deposition by the -particles) at 25 °C, over the time interval 10-12 to 10-6 s. The three different lines show the results of our Monte Carlo simulations for the - (black solid line) and tritium - (blue solid and dashed lines, respectively) irradiations considered. Experimental data for 60Co -irradiations: (■) (ref. 24), () (ref. 75), (○) (ref. 80), and (□) (ref. 80). Note that these data have all been placed at ~2 10-7 s, the time at which spur expansion is complete at 25 °C (ref. 29). The experimental yield data for 3H -irradiations (●) are from ref. 24. They are shown in blue color in the figure.
Figure 10 Time dependence of the yields (in molecule/100 eV) of the………79 various radiolytic products (H•, H2, •OH, and H2O2) for the radiolysis of 0.4 M aqueous solution of H2SO4 (pH 0.46) by ~300-MeV incident protons
(which mimic irradiation with 60Co -rays) and 3H -particles with initial energies of ~5.7 keV (average energy of tritium decay) and ~7.8 keV (mean energy of energy deposition by the -particles) at 25 °C, over the time interval 10-12 to 10-6 s. The three different lines show the results of our Monte Carlo simulations for the - (black solid line) and tritium - (blue solid and dashed lines, respectively) irradiations considered. Experimental data for 60Co -irradiations: (▲) represents the “primary” radical and molecular yield values given in eq. [3] (ref. 13,14,31,36), and () is from ref. 75. Note that all these data have been placed at ~2 10-7 s, the time at which spur expansion is complete at 25 °C (ref. 29). The experimental yield data for 3H -irradiations (∆) are taken from ref. 22. They are shown in blue color in the figure. (◊) shows tentative yield values for 0.4 M H2SO4 water
solutions irradiated by soft (8 keV) X-rays whose LET (~6 keV/m) is similar to that of tritium -electrons (ref. 76,83).
Figure 11 Time evolution of G(Fe3+) (in molecule/100 eV) in the………83 radiolysis of aerated solution of 1 mM FeSO4 in aqueous 0.4 M H2SO4 as
obtained from our Monte Carlo simulations for 5.7-keV electrons (average beta-ray energy released by decay of tritium; blue solid line), 7.8-keV electrons (mean energy of energy deposition by the -particles; blue dashed line), and 300-MeV irradiating protons (which mimic irradiation with 60Co -rays; black solid line) at 25 °C. The concentration of dissolved oxygen used in the calculations is ~2.5 10-4 M. As can be seen, G(Fe3+) is time dependent as a result of the differences in the lifetimes of the reactions making up the radiolysis mechanism. The arrows on the right of the figure show our computed values of G(Fe3+) at ~200 s for the three types of radiation. Experimental values of G(Fe3+) at room temperature are 15.5 ± 0.2 molecules/100 eV for 60Co -rays or fast electrons, and ~11.9-12.9 molecules/100 eV for 3H -radiation.
Figure 12 Time evolution of the Fricke G-value (in molecule/100 eV)………85 in the 3H -particle radiolysis of aerated solution of 1 mM FeSO4 in aqueous
0.4 M H2SO4 at 25 °C. The line denoted A (in black color) shows to the
kinetics of Fe3+ formation computed directly from our Monte Carlo simulations for the whole energy spectrum of tritium -rays and then averaged using the distribution of fluence rate with respect to energy of Fig. 1. The line denoted B (in blue color) corresponds to the kinetics computed similarly but averaged using the distribution of energy fluence rate with respect to energy of Fig. 7 (assuming that the radiation is totally absorbed in the dosimeter solution) (ref. 76). For the sake of comparison, the arrows on the right of the figure show the range (~11.9-12.9 molecules/100 eV) of
G(Fe3+) values from the literature.
Figure 13 Variation of G(Fe3+) (in molecule/100 eV) in the radiolysis………86 of aerated solution of 1 mM FeSO4 in aqueous 0.4 M H2SO4 with incident
electron energy between 1 and 18 keV, at 25 °C. The line shows the values of G(Fe3+) obtained from our Monte Carlo simulations. Experimental data include selected G(Fe3+) values obtained with low-energy X-rays (assuming that at these low energies, primary photons produce primary electrons with similar initial energies) and 3H -radiation: (□) recommended values in ICRU Report 17, (ref. 76) , (◊) (ref. 92), (∆) (ref. 93), (■) measured using monochromatic X-rays from synchrotron radiation in the 1.8-10 keV region (ref. 94), and (○) mean of values from refs. 22 (~11.9 molecules/100 eV after correction for dosimetry (ref. 19), 23 (12.7 ± 0.3 and 12.9 ± 0.2 molecules/100 eV), and 25 (12.8 ± 0.4 and 12.7 ± 0.3 molecules/100 eV, referring to the yield‟s reasonable independence of acid concentration between 0.05 M H2SO4 and 0.4 M H2SO4 – see Figs. 8 and 9, as the authors
xii Chapter III
Figure 1 Time dependence of the extents ∆G(e-aq) (in molec./100 eV)………98
of the main spur/track reactions for the decay of e-aq, calculated from our
Monte Carlo simulations of the radiolysis of 0.4 M H2SO4 solution by 3H
particles and 60Co -rays.
Figure 2 Time dependence of the extents ∆G(H•) (in molec./100 eV)……….99 of the main spur/track reactions for the decay of H•, calculated from our Monte Carlo simulations of the radiolysis of 0.4 M H2SO4 solution by 3H
particles and 60Co -rays.
Figure 3 Time dependence of the extents ∆G(•OH) (in molec./100 eV)………….101 of the main spur/track reactions for the decay of •OH, calculated from our Monte Carlo simulations of the radiolysis of 0.4 M H2SO4 solution by 3H
particles and 60Co -rays.
Figure 4 Time dependence of the extents ∆G(H2O2) (in molec./100 eV)…………103
of the main spur/track reactions that contribute to the formation and decay of H2O2, calculated from our Monte Carlo simulations of the radiolysis of 0.4 M H2SO4 solution by 3H particles and 60Co -rays.
Figure 5 Time dependence of the extents ∆G(H2) (in molec./100 eV)………105
of the main spur/track reactions that contribute to the formation and decay of H2, calculated from our Monte Carlo simulations of the radiolysis of 0.4 M
H2SO4 solution by 3H particles and 60Co -rays.
Figure 6 Time dependence of the extents ∆G(Fe3+) (in molec./100 eV) ……….…107 of the reactions that contribute to the formation of Fe3+ ions, calculated from our Monte Carlo simulations of the radiolysis of air-saturated solution of 1 mM FeSO4 in aqueous 0.4 M H2SO4 by 60Co- irradiation at 25 °C.
Figure 7 Time dependence of the extents ∆G(Fe3+) (in molec./100 eV) of………107 the reactions that contribute to the formation of Fe3+ ions, calculated from our Monte Carlo simulations of the radiolysis of air-saturated solution of 1 mM FeSO4 in aqueous 0.4 M H2SO4 by 3H particles at 25 °C.
Chapter IV – Article No. 2
Figure 1 Time evolution of G(Ce3+) (in molecule/100 eV) for 300-MeV………… 116 incident protons (LET ~ 0.3 keV/m) in the radiolysis of aerated solution of 0.4 mM Ce4+ ions and 0.36 mM Ce3+ ions in aqueous 0.4 M H2SO4 at 25 °C,
calculated from our Monte Carlo simulations in the interval 10-12-1 s. The concentration of dissolved O2 used in the calculations is 0.25 mM. For the
sake of comparison, the arrows on the right of the figure show the range (~2.34-2.52 molecules/100 eV) of experimental G(Ce3+) values from the literature for 60Co -rays (6, 7, 11, 35-37, 48).
Figure 2 Time dependence of the extents G(Ce3+) (in molecule/100 eV) …….…118 of the different reactions that contribute to the formation and decay of Ce3+ (see text), calculated from our Monte Carlo simulations of the radiolysis of aerated ceric-cerous sulfate solutions containing 0.4 mM Ce4+ ions and 0.36 mM Ce3+ ions in aqueous 0.4 M H2SO4 by 300-MeV irradiating protons
(LET ~ 0.3 keV/m) at 25 °C and in the interval 10-12-1 s.
Figure 3 Yield of Ce3+ ions (in molecule/100 eV) in aerated ceric-cerous………...119 sulphate (0.4 mM Ce4+ ions and 0.36 mM Ce3+ ions in aqueous 0.4 M H2SO4) solutions as a function of temperature, for 300-MeV irradiating
protons (LET ~ 0.3 keV/m at 25 °C). The solid line shows the values of
G(Ce3+) obtained from our Monte Carlo simulations in the range of 25-350 °C. The dotted line represents our simulated results of G(Ce3+) calculated without incorporating reaction (14) in the simulations. Experiment: (●) ref. (4), (▲) ref. (51), (- - -) ref. (9), (◊) ref. (48), (○) ref. (52), () ref. (11), (■) ref. (35), (□) ref. (16), and () estimated values at 200 and 250 °C extrapolated linearly from the values of G(Ce3+) obtained experimentally in ref. (48).
Figure 4 Time evolution of G(Ce3+) (in molecule/100 eV) for 300-MeV …………121 incident protons (LET ~ 0.3 keV/m) in the radiolysis of aerated solution of 0.4 mM Ce4+ ions and 0.36 mM Ce3+ ions in aqueous 0.4 M H2SO4 at 350
°C, calculated from our Monte Carlo simulations in the interval 10-12-100 s. Note that reaction (14) is included in the simulations (see text). The most noticeable difference with the mechanism prevailing at 25 °C is that the contributions of the reactions (6) and (10) to the removal of Ce3+ ions are significantly increased; these two reactions that both involve •OH radicals play a predominant role in the overall value of G(Ce3+), which becomes negative at times longer than ~1 s.
Chapter V
Figure 1 G(Ce3+) as a function of Ce3+ concentration. The concentration ….…….130 of Ce4+ is 0.1 mM, in aqueous 0.4 M H2SO4 solution.
Figure 2 Time evolution of G(Ce3+), G(O2) and G(H2) in the radiolysis of………130
air-saturated solution of 0.4 M H2SO4, 0.1 mM Ce4+ and 0.2 mM Ce3+ at
25 °C by 300-MeV protons. The concentration of dissolved oxygen is 2.5 × 10⁻⁴ M.
xiv Figure 3 Time dependence of the extents ΔG (in molec./100 eV)………131 of the main reactions involved in the formation (or decay) of Ce3+, calculated from the simulations of the radiolysis of aerated ceric sulfate solution by ~300-MeV protons (LET ~ 0.3 keV/μm).
Figure 4 Time evolution of G(Ce3+), G(O2), and G(H2) (in molec./100 eV) ….….133
in the radiolysis of deaerated solutions of 0.4 M H2SO4, 0.1 mM Ce4+ and
0.2 mM Ce3+ at 25 °C by 300-MeV protons.
Figure 5 Time dependence of the extents ΔG (in molec./100 eV) of the………..…133 main reactions that intervene in the formation (or decay) of Ce3+, calculated from our simulations of the radiolysis of deaerated solutions of 0.4 M H2SO4,
0.1 mM Ce4+ and 0.2 mM Ce3+ at 25 °C by 300-MeV protons (LET ~ 0.3 keV/μm).
Figure 6 Time dependence of the extents ΔG (in molec./100 eV) of the…………..135 main reactions involved in the formation (or decay) of Ce3+, calculated from our simulations of the radiolysis of deaerated solutions of 0.4 M H2SO4, 0.1
mM Ce4+ and 0.1 mM Ce3+ at 25 °C by 300-MeV protons (LET ~ 0.3 keV/μm).
Figure 7 Time dependence of the extents ΔG (in molec./100 eV) of the…………..135 main reactions involved in the formation (or decay) of Ce3+, calculated from our simulations of the radiolysis of deaerated solutions of 0.4 M H2SO4, 0.1
mM Ce4+ and 0.5 mM Ce3+ at 25 °C by 300-MeV protons (LET ~ 0.3 keV/μm).
Figure 8 Time dependence of the extents ΔG (in molec./100 eV) of the…………136 main reactions involved in the formation (or decay) of Ce3+, calculated from the simulations of the radiolysis of deaerated solutions of 0.4 M H2SO4, 0.1
LIST OF ABBREVIATIONS
Cross section
D Diffusion coefficient
DEA Dissociative electron attachment
DNA Deoxyribonucleic acid
e-aq Hydrated electron
eV Electronvolt
Gx or g(X) Primary yield of the radiolytic species X
G(X) Experimental 100-eV yield of the final product X
IRT Independent reaction times k Reaction rate constant
keV Kilo-electronvolts (103 eV)
LET Linear energy transfer
MC Monte Carlo
MeV Mega-electronvolts (106 eV)
molec./100 eV Molecule/100 eV
Z Atomic number
3H Tritium
1
I. INTRODUCTION I.1 Radiation chemistry
Radiation chemistry is a subdivision of chemistry that studies the chemical reactions in the materials when they are exposed to high energy (~1MeV) radiations. The history of radiation chemistry goes back to the end of the 19th century after the discovery of X-rays. Earlier understanding of the nature of chemical reactions induced by radiation was difficult since it was not possible to obtain sufficiently strong radiation sources to produce enough changes that could be observed with analytical techniques. Although some works were done in the early 1940‟s that numerous developments and progress were made in radiation and nuclear sciences. Radiation chemical studies have attracted many interests due to its various applications and its ability to produce, and investigate, almost any reactive atomic species playing a part in chemical reactions, syntheses, industrial processes, or in biological systems. The techniques are applicable to gaseous, liquid, solid, and heterogeneous systems. Radiation chemistry focuses mainly on few different sources of ionizing radiation: radiation produced by the decay of radioactive nuclei (α, β, and γ radiations), beams of accelerated charged particles such as electrons and protons. Electromagnetic radiation or X-ray radiation is another source of radiation. How a radiation source depends on the type of applications and size of the material to be irradiated. Radiation chemistry of water and aqueous solutions is the most important subject being studied, because of the unique importance of water, mainly in biological systems and also in various area of nuclear science and technology such as water-cooled nuclear power. Furthermore, water serves as the standard reference material in clinical radiation therapy since water has similar absorption properties as a biological tissue.
I.2 Ionizing radiation
Ionizing radiations are energetic particles and electromagnetic radiations that can directly or indirectly remove an electron from an atom or a molecule and produce a positive ion. In some cases, if the energy of the ionization radiation is not sufficient to ionize the molecule, the molecule can be excited to one of its electronic states. (see, for example: EVANS, 1955; ANDERSON, 1984; IAEA-TECDOC-799, 1995; MOZUMDER, 1999;
TOBUREN, 2004). In direct ionizing radiations, fast moving charged particles such as electrons, protons, -particles, or stripped nuclei cause ionization via direct Coulomb interactions. Indirectly ionizing radiations are energetic electromagnetic radiations such as X- or -ray photons or neutrons that remove bound orbital electrons through a secondary interaction. For the case of photons, the primarily process is production of Compton electrons and photoelectrons and if the energy of the incident photon is greater than 1.022 MeV, electron-positron pairs could also be generated. In case of neutrons, they interact with matter through elastic nuclear scattering resulting in the production of energetic recoil protons or other positively charged nuclei (ions), which then can ionize or excite molecules along their paths. It should be mentioned that regardless of the type of ionizing radiation, the final common result is the formation of tracks of physical energy-loss events in the form of ionization and excitation processes and the geometrical pattern of the track formation depends on the type of radiation involved.
Usually, if the electrons ejected in the ionization events have sufficient energy, they could further ionize molecules in the medium. As a result, the primary high-energy electron can produce along its track a large number (∼40000 per MeV of deposited energy) of secondary or higher-order electrons (ICRU REPORT 31, 1979). Most of these secondary electrons have low initial kinetic energies with a distribution mainly below 100 eV, and a most probable energy below 10 eV (LAVERNE and PIMBLOTT, 1995; SANCHE, 2002; AUTSAVAPROMPORN, 2006). It is shown that these electrons lose all their energy by multiple quasi-elastic and inelastic interactions through different interactions such as ionizations and/or excitations of electronic, intramolecular vibrational or rotational modes of the target molecules (MICHAUD et al., 2003), and quickly reach thermal equilibrium and become “thermalized”. Interactions of secondary electrons mostly depend on the nature of the target medium and the energy range of the incident electron. The interactions of the particles with matter are governed by cross section. The concept of “cross section” is introduced as a measure of the probability of interaction of a projectile with a target depending on its nature and energy (see, for example: JOACHAIN, 1975). The total interaction cross section is summed over all considered individual processes i. The total cross section can be used to calculate the mean distance between two consecutive interactions or “mean free path” as shown by following equation:
3 = σ 1 N , (1) [ ] [ ] [ ]
where N is the number of atoms or molecules per unit volume, and
i i
σ (2)
In a aqueous environment, thermalized electrons undergo trapping and hydration in quick succession (within ~10-12 s) as a result of the water electric dipoles rotating under the influence of the negative charge (BERNAS et al., 1996). Electrons with kinetic energies lower than the first electronic excitation of the medium are called “subexcitation” electrons (PLATZMAN, 1955) and they may undergo, prior to thermalization, geminate ion recombination (FREEMAN, 1987). There is also possibility for these electrons to produce anions through “dissociative electron attachment” (DEA) processes (CHRISTOPHOROU et al., 1984; BASS and SANCHE, 2003). Eventually, due to the energy gained by the medium, a sequence of very fast reactions and also molecular rearrangements, highly nonhomogeneously distributed chemical species such as charged and/or neutral fragments, reactive free radicals and excited chemical intermediates are formed in the medium and the spatial distribution of these arrangements is known as “track structure” (PARETZKE, 1987; MAGEE and CHATTERJEE, 1987; KRAFT and KRÄMER, 1993; PARETZKE et al., 1995; MOZUMDER, 1999; LAVERNE, 2000, 2004).
I.3 Tracks in liquid water
I.3.1 Track structure in radiation chemistry and radiobiology
Experimental and theoretical studies have shown that in the radiolysis of water the quantities and proportions of the chemical products are highly dependent on the distances separating the primary radiolytic species from each other, referred to as the “track structure”. The distribution of the track structure is mainly defined by the distribution of the physical energy deposition events and their geometrical dispositions. Interestingly, the track structure is known as “LET effects” as most of the early studies used this parameter to
characterize the different radiation chemical yields for various irradiating ions in liquid water. Furthermore, the radiation track structure is an important concept in identifying the precise spatial location of the radiolytic species and free-radical intermediates generated in the tracks, and their subsequent radiobiological action at the molecular and cellular levels. Overall, the scientific community agrees that different qualities of radiation must be analyzed in terms of track structure (CHATTERJEE and HOLLEY, 1993; MUROYA et al., 2006).
I.3.2 Low-LET radiation
The average LET of a 1-MeV electron in water is ~0.3 keV/m. The mean energy loss per collision event by such a fast electron is in the order of ~48–65 eV, meaning energy-loss events separated by ~2000 Å (LAVERNE and PIMBLOTT, 1995; MOZUMDER, 1999; AUTSAVAPROMPORN, 2006). This nonhomogeneous distribution of energy deposition events gave rise to the development of the “spur” model for low-LET track structure (KARA-MICHAILOVA and LEA, 1940; ALLEN, 1948; SAMUEL and MAGEE, 1953; MAGEE, 1953; GANGULY and MAGEE, 1956), according to which the entire track is to be viewed as a random succession of “spurs”, or spatially localized energy-loss events (it is assumed that irradiating particles are isolated from each other, an assumption not necessarily correct at very high dose rates or with very short pulses of intense beams). The deposited energy (in the order of a few tens of electronvolts) in a spur ejects an electron from a molecule and subsequently, the ejected electron undergoes collisions with the medium. The electron eventually losses its entire energy and becomes thermalized (~0.025 eV) within about 80–120 Å of its geminate positive ion (GOULET and JAY-GERIN, 1988; MUROYA et al., 2002; MEESUNGNOEN et al., 2002a; PIMBLOTT and MOZUMDER, 2004). This electron thermalization distance is an indication of the average radius of the spurs in the first stages of their development. Thus, the individual spurs produced by a radiation of low LET are so far apart along the track that they are not initially overlapping, but eventually they will develop in time.
Mozumber and Magee (MOZUMDER and MAGEE 1966a,b) expanded the “spur” model to the radiation chemical consequences of the different energy-loss processes and they specifically employed a low-LET track composed of a random sequence of three types
5 of essentially nonoverlapping entities: “spurs, blobs, and short tracks” (Figure I.1). As shown in Figure I.1, the spur category covers tracks created by the energy losses between the lowest excitation energy of water (~7.3 eV) and 100 eV. PIMBLOTT and MOZUMDER (1991) showed that usually there are one to three ion pairs in a spur and about the same number of excited molecules. For energy transfers between 100 and 500 eV tracks, blobs are defined and for larger energy transfers between 500 eV and 5keV, the term short tracks is introduced. Lastly, the term “branch tracks” is considered for energy transfers above 5 keV. Short and branch tracks are, collectively, described as -rays. This classification of the tracks has proven to be very useful in visualization of track processes and in modeling radiation-chemical kinetics.
Figure I.1 Track structure classification by spurs (spherical entities, up to 100 eV), blobs (spherical or ellipsoidal, 100–500 eV), and short tracks (cylindrical, 500 eV–5 keV) for a primary high-energy electron (not to scale). “Adapted with permission from BURTON (1969). Copyright (1969) American Chemical Society”. The energy partition between the three track entities strongly depends on the incident particle energy, dividing approximately as the ratio of 0.75:0.12:0.13 between the spur, blob, and short track fractions for a 1-MeV electron in liquid water (PIMBLOTT et al., 1990).
Figure I.2 presents an example of the low-LET tracks. In this figure, we have used Monte-Carlo simulations to calculate the complete tracks of five 150-keV electrons and their produced secondary electrons in liquid water.
Figure I.2 Simulated tracks (projected into the XY plane of figure) for five 150-keV electrons in liquid water, showing the stochastic nature of paths. Each electron is generated at the origin and starts moving vertically upwards.
I.3.3 High-LET radiation
In this section, we will discuss how high-LET radiation tracks differ from those of low-LET radiation. It has been shown that with increasing LET, the distantly-spaced, nearly spherical spurs are formed more closely together and eventually overlap especially when LET becomes greater than ~10–20 keV/m and generate dense continuous columns. High-LET tracks produced by the heavy particles consist initially of a cylindrical “core” and a surrounding region traversed by the emergent, comparatively low-LET secondary electrons, called the “penumbra” (MOZUMDER et al., 1968; CHATTERJEE and SCHAEFER, 1976; FERRADINI, 1979; MAGEE and CHATTERJEE, 1980, 1987; MOZUMDER, 1999; LAVERNE, 2000, 2004). Figure I.3 shows typical two-dimensional representations of short (1–5 m) track segments of 1H+, 4He2+, 12C6+, and 20Ne10+ ions (MUROYA et al., 2006). -300 -200 -100 0 100 200 300 -100 -50 0 50 100 150 200 y ( m) x (m)
7
Figure I.3 Projections over the XY plane of track segments calculated (at ~10-13 s) for H+ (0.15 MeV), (b) 4He2+ (1.75 MeV/nucleon), (c) 12C6+ (25.5 MeV/nucleon), and (d) 20Ne10+ (97.5 MeV/nucleon) impacting ions. Ions are generated at the origin and along the Y axis in liquid water under identical LET conditions (~70 keV/m). The track segments for the different ions have been chosen equal to 5 m, except for 1H+, for which we have adopted a track length of 1 m. This reduction in the track length for 1H+ was dictated by the fact that the penetration range of this ion in liquid water, at the considered energy of 0.15 MeV, amounts to only ~2.3 m. For the case of a 1-m segment of 0.15 MeV proton track, the LET is nearly constant (~70 keV/m) along the trajectory. Dots represent the energy deposited at points where an interaction occurred (MUROYA et al., 2006).
These track segments are calculated using our Monte Carlo simulation code, called IONLYS, under the same LET conditions (~70 keV/m). As it can be seen from the figure, these tracks can be considered as straight lines. It is also seen that the ejected high-energy secondary electrons travel to a farther distance away from the track core as the velocity of the incident ion increases, from protons to neon ions. In other words, although all the particles depositing the same amount of energy per unit path length, the energy is lost in a volume that increases in the order 1H+ 4He2+ 12C6+ 20Ne10+, indicating that the
higher-Z particle has the lower mean density of reactive species. This irradiating-ion dependence
different radial profiles) is in a good agreement with Bethe‟s theory of stopping power and indicates that LET is not a unique descriptor of the radiation chemical effects within heavy charged particle tracks (SCHULER and ALLEN, 1957; MILLER, 1958; SAUER et al., 1977; LAVERNE and SCHULER, 1987a; KAPLAN and MITEREV, 1987; FERRADINI, 1990; FERRADINI and JAY-GERIN, 1999; PIMBLOTT and LAVERNE, 2002; LAVERNE, 2000, 2004). Some studies have focused to identify other comparative characteristics of radiation in place of LET, for instance the factor Z2/2 (where Z is the charge number of the ion and is the ratio of its velocity to that of light in vacuum) (KATZ, 1970) or, equivalently, the parameter MZ2/E (where M is the heavy ion mass and E = ½ MV2 its kinetic energy) (PIMBLOTT and LAVERNE, 2002; LAVERNE, 2004). PIMBLOTT and LAVERNE (2002) suggested that no deterministic parameterization can realistically represent a phenomenon (namely, the effect of radiation quality on early radiation chemistry) that is stochastic in nature. KATZ (1978) also indicated that we need at least two parameters in order to speak of a track structure and that single parameter reductions do not fully describe observed effects. Nevertheless, despite its limitations, LET still continues to be a dominant parameter in the radiation chemistry of heavy ions.
I.4 A comparison between 3H particles and 60Co -rays
Beta particles are fast electrons produced by decaying of a certain radioactive material such as tritium, carbon-14, and phosphorus-32. β particles are usually produced with energies ranging from zero to some maximum energy, depending on the radioactive element. In our study we are focusing on the β-rays emitted from tritium (3H 3He+ + + ̅
e). Tritium (3H)
is a radioactive isotope of hydrogen. Tritium has a half-lives of 12.33 years as listed by the National Institute of Standards and Technology (NIST). In this decay, 18.6 keV can be released and the average energy of the produced β particles is 5.6 keV (see Figure I.4). Beta particles from tritium can penetrate only 5.5 m in water. In groundwater studies, labeled water can be released into the ground at one point, and the amount of tritium-labeled water that appears at other points can be monitored. In this manner, the flow of water through the ground can be mapped. Such information is important when drilling oil fields, for example. Tritium can also be substituted for ordinary hydrogen in organic
9 compounds and used to study biological reactions. Gamma rays, on the other hand, are electromagnetic radiation of nuclear origin with various wavelengths (or energies). The energy of the γ rays could vary between 40 keV and 4 MeV depending on the source of the radioactive material. The energy of the γ rays produced from cobalt-60 (60Co) is ~ 1 MeV. Cobalt-60 is the most used element to produce γ rays. γ rays produced by 60Co can penetrate deeply into the human body so it is widely used for cancer radiotherapy. Table I.1 presents estimated the fraction of the total absorbed energy deposited in short tracks, blobs, and spurs for different types of radiation: low-LET 60Co γ radiation and moderately high- LET 3H β radiation. 0 2 4 6 8 10 12 14 16 18 0.0 0.2 0.4 0.6 0.8 1.0 Mean energy of tritium decay (~ 5.7 keV) 16-07-2012 R elati ve d ec ay p ro ba bil ity Energy (keV)
Figure I.4 The 3H decay energy spectrum (Source: T.J. BOWLES and R.G.H.
Table I.1 Fraction of the total absorbed energy deposited in short tracks, blobs, and spurs for different types of radiation: low-LET 60Co γ radiation and moderately high-LET 3H β radiation (SPINKS and WOODS, 1990).
Energy deposited in: 60Co γ radiation 3H β radiation
Short tracks 25% 74.4%
Blobs 11% 7.6%
Spurs 64% 18%
I.5 Radiolysis of liquid water and aqueous solutions I.5.1 The radiolysis of water
The radiolysis of water gives rise to many important radiation-chemical reactions and has received a great attention. To describe this radiolysis, the complex sequence of events that are generated when water is exposed to radiation is usually divided in three overlapping stages (PLATZMAN, 1958): (1) The first stage called “physical” stage is the early stage when deposition of the incident ionizing radiation takes place and initial products in a specific, highly nonhomogeneous track structure geometry are formed; (2) The subsequent stage, known as “physicochemical” stage, is establishment of thermal equilibrium in the bulk medium with reactions and reorganization of initial products to form stable molecules and chemically reactive species such as free atoms and radicals; and (3) The third stage, called “chemical” stage, corresponds to a thermal chemistry during which the several reactive species diffuse and react with one another and/or with the environment.
The radiolysis of pure deaerated liquid water by low-LET radiation, such as 60Co γ-rays, hard X-γ-rays, fast electrons, or high-energy protons, generally results in the formation of the radicals and molecular products e-aq (hydrated electron), H• (hydrogen atom), H2
(molecular hydrogen), •OH (hydroxyl radical), H2O2 (hydrogen peroxide), HO2•/O2
11 see: SPINKS and WOODS, 1990). Assuming conventional irradiation conditions, radical and molecular products are formed nonhomogeneously on subpicosecond time scales in small, spatially isolated regions of dense ionization and excitation events, commonly referred to as “spurs” (MAGEE, 1953), along the track of the radiation. Owing to diffusion from their initial positions, the radiolytic products then either react within the spurs as they expand or escape into the bulk solution. This spur expansion is normally complete by about 10-6–10-7 s after the initial deposition of energy at ambient temperature. The so-called “primary” radical and molecular yields (“long-time” or “escape” yields) g(e-aq), g(H•), g(H2), g(•OH), g(H2O2), etc., represent the numbers of species produced or destroyed per
100 eV of absorbed energy that remain after spur expansion and become available to react with added solutes (treated as spatially homogeneous) at moderate concentrations.
Here, we need to introduce the following important equation in the radiolysis of pure deaerated (air-free) liquid water for low-LET radiation known as “global” equation. The global equation is written for an absorbed energy of 100 eV (FERRADINI and JAY-GERIN, 1999). The symbol used in the equation represents reactions that occur due to the absorption of ionization radiation.
GH2O H2O Ge-aq eaq + GH• H• + GH2 H2 + GH+ H+ + GOHOH
+ G•OH•OH + GH2O2 H2O2 + GHO2•/O2•HO2•/O2• + …, (3)
In the above equation, the coefficients GX – also written as g(X) – are the “primary” radical and molecular yields of the various radiolytic species X, and GH
2O denotes the
corresponding yield for net water decomposition. Recent values of the primary yields in units of molecules per 100 eV)1 have been reported by LAVERNE (2004) for 60Co γ-rays (photon energies of 1.17 and 1.33 MeV), hard X-rays or fast electrons of the same energies, at neutral pH and room temperature (average LET ~ 0.3 keV/μm):
Ge
-aq = 2.50 GH• = 0.56 GH2 = 0.45
1 These units (abbreviated as “molec./100 eV”) for G-values are used throughout in this work. For conversion into SI units (mol J-1): 1 molec./100 eV ≈ 1.0364 10-7 mol J-1.
G•OH = 2.50 GH2O2 = 0.70 (4)
The above primary yield values include the contribution of HO2•/O2•. It is worthy to note
that for low-LET radiolysis, g(HO2•/O2•) has a very small value of ~0.02 molecule/100 eV
(HART, 1955; BJERGBAKKE and HART, 1971), and is therefore considered as a minor radiolytic product that accounts for less than 1% of the other primary radiolytic species. The yield values given in Eq. (4) are linked by the following equations:
Ge
-aq + GOH= GH+ Ge
-aq + GH• + 2 GH2 = G•OH + 2 GH2O2 + 3 GHO2•/O2• , (5)
expressing the charge conservation and material balance of Eq. (3).
It should be noted that the yields of the radical and molecular species produced by the irradiation within the lifetime of a spur not only change as a function of time, but also depend on the radiation type (or LET) and the added solute (scavenger) concentration. Therefore, one of the main purposes of the radiation chemistry of water is to determine how the yields of radical and molecular species change as a function of time, LET, pH and solute concentration.
I.5.2. Time scale of events and formation of primary radical and molecular products in neutral water radiolysis
As discussed earlier the radiolysis of water is usually divided into three stages. Below, we briefly describe these three stages. Figure 1.5 shows the time scale of events that occur in the radiolysis of water and aqueous solutions.
(i) The “physical stage” is a step that lasts not more than ~10-16 s. The physical stage is the absorption of incident ionizing radiation (for example, energetic photons, γ-rays from
60Co or X-ray photons, charged particles, such as fast electrons, protons or heavy ions
generated by a particle accelerator, neutron radiation, or high-energy α-particles from suitable radioactive nuclides) by the medium. As a result of the energy absorption, a large number of ionized and electronically excited water molecules denoted H2O•+ and H2O*elec,
respectively, are produced along the path of the radiation. Note that H2O*elec represents
13 1962a) and the collective electronic oscillations of the “plasmon” type (HELLER et al., 1974; KAPLAN and MITEREV, 1987; WILSON et al., 2001). The earliest processes in the radiolysis of water, production of H2O•+ and H2O*elec, are given by:
H2O H2O•+ + e (6)
H2O H2O*elec (7)
Generally, the electron ejected from the water in the ionization event has sufficient energy to ionize or excite one or more other water molecules in the vicinity, and this leads to the formation of track entities, or “spurs”, that contain the products of the events. For low-LET radiation, the spurs are separated by large distances relative to their diameter and the track can be viewed, at this stage, as a random succession of isolated spherical spurs.
(ii) The “physicochemical stage” occurs in a time scale of about 10-12 s for aqueous solutions. This stage includes processes that lead to a thermal equilibrium in the system. The ionized and excited molecules created during the physical stage are highly unstable. During this stage, the ions and excited state water molecules dissipate their excess energy by energy transfer to neighboring molecules and bond rupture. The ionized water molecules are very short lived and their lifetime is on the order of ~10-14 s (MOZUMDER and MAGEE, 1975). In fact, they undergo a random walk through a sequence of electron transfers [about 20 over a few molecular diameters (COBUT et al., 1998)] from neighboring water molecules to the H2O•+ hole (i.e., electron-loss center) (OGURA and
HAMILL, 1973). These short-lived H2O•+ radical cations transfer a proton to an adjacent
H2O molecule and form •OH radicals as shown by the following reaction:
H2O•+ + H2O H3O+ + •OH , (8)
where H3O+ (or equivalently, H+aq) represents the hydrated hydrogen ion.
Furthermore, in this stage, the energetic (or “dry”) secondary electrons undergo a sequence of interactions with the medium and lose their kinetic energy. Eventually, they attain thermal energies (~0.025 eV at 25 °C) after about 4 10-14 s (MEESUNGNOEN et al., 2002a). During their thermalization, “dry” electrons can be recaptured by their parent ions due to the Coulomb attraction of the latter which tends to draw them back together to undergo electron-cation “geminate” recombination:
e- + H2O•+ H2O*vib (9)
As the electron is recaptured, the parent ion is transformed into a (vibrationally) excited neutral molecule. The electron released in the ionization event can cause further ionization and excitation to occur if it has sufficient kinetic energy. The so-called “subexcitation electron” (e-sub) (PLATZMAN, 1955) is formed when the energy of the
electron becomes less than the first electronic excitation threshold of water (~7.3 eV; see: MICHAUD et al., 1991). Consequently, the subexcitation electron loses the rest of its energy slowly by exciting vibrational and rotational modes of water molecules. Once thermalized (e-th), the electron, which is negatively charged, interacts with the dipoles of the
surrounding water molecules and becomes trapped in a state called “trapped or wet electron” (e-tr). Finally, this electron becomes fully hydrated (e-aq) and behaves like a chemical species.
In liquid water at 25 °C, thermalization, trapping, and hydration can then follow in quick succession in less than ~10-12 s (for example, see: JAY-GERIN et al., 2008):
e- e-sub e-th e-tr e-aq (10)
During its thermalization, the ejected electron can also be temporarily captured by a water molecule forming a transient anion (TNI)
e- + H2O H2O (11)
The produced transient anion of water dissociates into H and •OH via the process of “dissociative electron attachment” (DEA), according to
H2O H + •OH , (12)
H can then react with another water molecule through a fast proton transfer reaction and
produce a hydrogen molecule and OH
H + H
2O H2 + OH . (13)
The DEA process has been observed in amorphous solid water at ~20 K for electrons with energies between ~ 5 and 12 eV (ROWNTREE et al., 1991).
15 Event Approximate time scale Homogeneous chemical stage (>10-6 s)
Figure I.5 Time scale of events that occur in the low-LET radiolysis of neutral, deaerated water (Adapted from MEESUNGNOEN, 2007).
Interestingly, it has been suggested that DEA to water is responsible, at least partially, for the yield of “nonscavengeable” molecular hydrogen in the radiolysis of liquid water at early times (PLATZMAN, 1962b; FARAGGI and DÉSALOS, 1969; GOULET and JAY-GERIN, 1989; KIMMEL et al., 1994; COBUT et al., 1996). This proposed mechanism for the production of H2 has been experimentally confirmed and it has been shown that the
previously accepted nonscavengeable yield of H2 is due to precursors of e-aq, which can be
lowered with appropriate (dry electron) scavengers at high concentration (PASTINA et al., 1999).
Excited molecules may be produced directly from the irradiation as shown in reaction (7) or by neutralization of an ion shown by reaction (9). Unfortunately, there is not much information regarding the channels through which the excited water molecules in the liquid phase decay and the branching ratios associated with each of them. However, the contribution of the water excited states to the primary radical and molecular products in the water radiolysis is relatively small compared to that of the ionization processes, so that the lack of information on the decomposition process has only limited consequences. Therefore, the competing de-excitation mechanisms of H2O* (either electronically or vibrationally
excited water) are generally assumed to be essentially the same as those reported for an isolated water molecule in the gas phase (see, for example: SWIATLA-WOJCIK and BUXTON, 1995; COBUT et al., 1998; MEESUNGNOEN and JAY-GERIN, 2005a). There are several channels for the dissociation of an excited water molecule:
H2O* H• + •OH (14a)
H2O* H2 + O(1D) (14b)
H2O* 2 H• + O(3P) (14c)
H2O* H2O + release of thermal energy (14d)
where O(1D) and O(3P) are the singlet and triplet states of the atomic oxygen, respectively.
Reaction (14a) is the main source of the initial yield of hydrogen atoms through the dissociation of H2O*(at ~10-12 s, i.e., at the end of the physicochemical stage). Although the
O(1D) atoms produced in reaction (14b) react very efficiently with water to form H2O2 or
possibly also 2•OH (TAUBE, 1957; BIEDENKAPP et al., 1970), ground-state oxygen atoms O(3P) in aqueous solution are rather inert to water but react with most additives