RESEARCH OUTPUTS / RÉSULTATS DE RECHERCHE
Author(s) - Auteur(s) :
Publication date - Date de publication :
Permanent link - Permalien :
Rights / License - Licence de droit d’auteur :
Bibliothèque Universitaire Moretus Plantin
Institutional Repository - Research Portal
Dépôt Institutionnel - Portail de la Recherche
researchportal.unamur.be
University of Namur
Analysis of the variability of human normal urine by 2D-GE reveals a "public" and a
"private" proteome
Molina, Laurence; Salvetat, Nicolas; Ameur, Randa Ben; Peres, Sabine; Sommerer, Nicolas;
Jarraya, Fayçal; Ayadi, Hammadi; Molina, Franck; Granier, Claude
Published in:
Journal of Proteomics and Bioinformatics
DOI:
10.1016/j.jprot.2011.06.031
Publication date:
2011
Document Version
Publisher's PDF, also known as Version of record
Link to publication
Citation for pulished version (HARVARD):
Molina, L, Salvetat, N, Ameur, RB, Peres, S, Sommerer, N, Jarraya, F, Ayadi, H, Molina, F & Granier, C 2011,
'Analysis of the variability of human normal urine by 2D-GE reveals a "public" and a "private" proteome', Journal
of Proteomics and Bioinformatics, vol. 75, no. 1, pp. 70-80. https://doi.org/10.1016/j.jprot.2011.06.031
General rights
Copyright and moral rights for the publications made accessible in the public portal are retained by the authors and/or other copyright owners and it is a condition of accessing publications that users recognise and abide by the legal requirements associated with these rights. • Users may download and print one copy of any publication from the public portal for the purpose of private study or research. • You may not further distribute the material or use it for any profit-making activity or commercial gain
• You may freely distribute the URL identifying the publication in the public portal ?
Take down policy
If you believe that this document breaches copyright please contact us providing details, and we will remove access to the work immediately and investigate your claim.
Analysis of the variability of human normal urine by 2D-GE
reveals a
“public” and a “private” proteome
Laurence Molina
a,d, Nicolas Salvetat
a,d, Randa Ben Ameur
a,d, Sabine Peres
a,d,
Nicolas Sommerer
b, Fayçal Jarraya
c,d, Hammadi Ayadi
c,d,
Franck Molina
a,d,⁎
, Claude Granier
a,daSysdiag UMR 3145 CNRS Bio-Rad, Cap delta/Parc euromédecine, 1682 rue de la Valsière CS 61003, Montpellier, France b
Mass Spectrometry Proteomics Platform INRA, Montpellier, France c
Centre de Biotechnologie de Sfax, Sfax, Tunisia
dL.I.A. 135 (Laboratoire International Associé) CNRS, Montpellier, France
A R T I C L E I N F O
A B S T R A C T
Available online 20 July 2011 The characterization of the normal urinary proteome is steadily progressing and represents a major interest in the assessment of clinical urinary biomarkers. To estimate quantitatively the variability of the normal urinary proteome, urines of 20 healthy people were collected. We first evaluated the impact of the sample conservation temperature on urine proteome integrity. Keeping the urine sample at RT or at + 4 °C until storage at−80 °C seems the best way for long-term storage of samples for 2D-GE analysis. The quantitative variability of the normal urinary proteome was estimated on the 20 urines mapped by 2D-GE. The occurrence of the 910 identified spots was analysed throughout the gels and represented in a virtual 2D gel. Sixteen percent of the spots were found to occur in all samples and 23% occurred in at least 90% of urines. About 13% of the protein spots were present only in 10% or less of the samples, thus representing the most variable part of the normal urinary proteome. Twenty proteins corresponding to a fraction of the fully conserved spots were identified by mass spectrometry. In conclusion, a“public” urinary proteome, common to healthy individuals, seems to coexist with a “private” urinary proteome, which is more specific to each individual.
© 2011 Elsevier B.V. All rights reserved. Keywords:
Proteome
Two-dimensional gel electrophoresis Normal urine
Variability
1.
Introduction
Although it is commonly believed that there is no significant protein excretion in the urine of healthy individuals, evidence for the presence of a highly diverse set of proteins is now unambiguous. Since urine is formed by ultrafiltration of serum through the kidney glomeruli, some amounts of many serum proteins are present in the filtrate. Moreover, during its passage through the filtration tubules, some proteins are removed or degraded and others are added from the lining
epithelial cells to the fluid. At the end of the process, urine is a rich and complex mixture of invaluable utility in clinical proteomics [1,2]. Since the pioneering work of Anderson[3], several studies have analysed the content of the human urinary proteome by different techniques such as two dimensional-gel electrophoresis (2D-GE), SELDI and mass spectrometry (CE-MS and LC-MS/MS) [2,4–20]. More than 3000 proteins have been identified in the human normal urinary proteome and collected in a database established from 19 published studies (DUP: Database of Urinary Proteins,
⁎ Corresponding author at: Sysdiag UMR 3145 CNRS Bio-Rad, 1682 rue de la Valsière, CS 61003, 34184 Montpellier Cedex 4, France. Tel.: +33 467 166 603; fax: +33 467 166 601.
E-mail address:[email protected](F. Molina).
a v a i l a b l e a t w w w . s c i e n c e d i r e c t . c o m
w w w . e l s e v i e r . c o m / l o c a t e / j p r o t
1874-3919/$– see front matter © 2011 Elsevier B.V. All rights reserved. doi:10.1016/j.jprot.2011.06.031
Salvetat N et al., manuscript in preparation). The occurrence of the same proteins in these 19 studies was very variable, some proteins being reproducibly identified, some being unique to a study. In most of these reports, pooled urines from several individuals were used, possibly adding some inter-individual variability to the natural complexity of the proteome, in addition to variations arising from sample handling or storage. Factors that might influence the composition of the urinary proteome are gender, age, diet, time of collection, exercise, etc.
[12,17,21]. The extent of this variability has, however, rarely been studied specifically and the few studies, which used a 2D-GE approach present conflicting results. Indeed, Laffite and colleagues observed a strong conservation of five categories of proteins in urine samples from 4 males[22]. Conversely, Khan and co-workers found significant changes when comparing the proteomic profiles of urine samples from a single individual collected at different times in a single day and then once a week [17]. Oh and colleagues also reported important variations in the 2D patterns of three subjects[12]
and Thongboonkerd and co-workers concluded that a consid-erable degree of inter-individual variability exists [21]. It is possible that the low number of individual samples studied and the lack of rigorous estimation of the variability of each spot might have contributed to these discrepancies. Recently, Nagaraj and Mann measured the variability of the human normal urinary proteome by LC-MS/MS in samples collected on three consecutive days and found that the normal urinary proteome was highly conserved[20].
For the identification of urinary biomarkers of renal diseases, it becomes important not only to rigorously list the components of the urinary proteome, but also to understand to which extent the urinary proteome is variable. Here, we tried to estimate quantitatively by 2D-GE approach, the portion of the urinary proteome shared among twenty healthy individuals and to analyse the variability of each protein spot in the 20 gels. Moreover, since in clinical proteomic the conditions of sample handling may significantly modify the urinary proteome profile of the studied individuals (in addition to inter-individual variations), we also evaluated the impact of the temperature at which samples were kept after collection and during storage on urine proteome integrity.
2.
Materials and methods
2.1. Urine collection and storageSecond-morning urine samples from 20 random consenting healthy individuals (10 males and 10 females, aged 22 to 59 years) were collected in sterile cups containing phosphatase and protease inhibitors (PI), as recommended[23]. The donors had no acute or chronic disease. Urinary samples were stored at −80 °C until use. For assessing the impact of different storage conditions, four biological samples (collected once and then 1 month later) were used rapidly or after storage at−20 °C (for 2 weeks to 1 month) with or without PI. To evaluate the impact of temperature just after urine collection, samples from two normal individuals were collected, kept at room temperature for 1 h and then stored at +4 °C or room temperature for another 7 h before freezing at−80 °C.
2.2. Sample preparation
Urines were centrifuged at 4 °C at 11,000 g for 30 min and supernatants dialysed against 18.2 MΩ·cm water at 4 °C for 48 h. Samples were then concentrated using 5000 Da cut-off centri-fuge tubes (Millipore, Bedford, MA) at 4 °C to approximately 1/40 of the initial volume. Concentrated urines were lyophilised and then solubilised in buffer containing 8 M urea, 2 M thiourea, 4% w/v CHAPS, 65 mM DTE, 40 mM Tris-base and protease in-hibitors cocktails (Roche Diagnostics, Meylan, France) at room temperature on a rotating wheel for 2 h. To determine the best protein quantification assay, the Bradford method[24]and the Lowry method (RCDC protein assay kit; Bio-Rad, Hercules, CA) were compared by analysing seven normal urine samples three times and by two different experimenters.
2.3. 2-D gel electrophoresis (2D-GE)
Precast IPG strips (18 cm) with a nonlinear immobilised pH 3– 10 gradient were rehydrated with 70μg of protein sample in 8 M urea, 2 M thiourea, 4% w/v CHAPS, 65 mM DTE, 0.0025% v/v bromophenol blue and 1% v/v IPG buffer (3−10) overnight[25]. Isoelectric focusing (IEF) was carried out on an Ettan™ IPGphor™ at 20 °C using a gradient mode to a total amount of 50 kVh. During IEF, we tested the addition to the strip extremities of paper soaked with water or DeStreak Rehydra-tion SoluRehydra-tion (GE Healthcare Life Sciences, Piscataway, NJ) or DTE (20, 50 or 100 mM). After the first dimension run, proteins were reduced (65 mM DTT in 6 M urea, 50 mM Tris–HCl, pH 8.8, 30% v/v glycerol, 2% w/v SDS, 0.001 v/v bromophenol blue) and alkylated for 10 min in a similar buffer containing 135 mM iodoacetamide instead of DTT. Then, proteins were separated in the second dimension on homemade 12% SDS-polyacrylamide gels using an ISO-DALT electrophoresis unit at a constant voltage of 120 V at 10 °C overnight. The analytical gels were stained with silver nitrate and the preparative gels with colloidal Coomassie blue G-250. In this last case, 200μg of protein were loaded per gel.
2.4. Image analysis
Gel images were digitalised at 300 dpi with an ImageScanner™ (GE Healthcare Life Sciences, Piscataway, NJ) and then analysed using the Progenesis Samespot® software v3.0 (Nonlinear Dynamics, Durham, UK). Images were warped for accurate alignment and spots were then automatically detected. Progenesis Samespot® is based on the concept of recursive gel matching, which means that each gel of a matching set is recursively used as“reference gel” once during the matching process. The quality of the automatic match was critically evaluated in each case, and if necessary, corrections were done manually.
2.5. Data processing
Stringent criteria were applied to detect true protein spots in 2D gels. For each protein spot detected by Progenesis Samespot®, an intensity value was measured and then the background noise (average value of 10 different areas of the gel without apparent spot + four standard deviations) was subtracted. Thus,
a spot was counted as present when its intensity was >0 after background subtraction. The variability of a given spot was assessed by counting its occurrence in each of the 20 gels.
To assess the reproducibility of the 2D-GE technique, three series of 2D-GE experiments were performed with four different samples (repeated in duplicate in each series). For each sample (593 protein spots), the percentages of variances were calculated from the mean coefficient of variation (CV), which is the standard deviation divided by the mean of a measurement. Technical, intra-individual and inter-individual coefficients of variations were calculated per gel and per spots. The correlation between CV and mean intensity was computed with the JMP v8 software (Spearman correlation coefficient).
2.6. Data quality evaluation and statistics
All statistics and data were computed using the JMP v8 software. Comparison of collection and storage conditions was performed with the Student's t-test (p< 0.05).
2.6.1. Dispersion tree
The dispersion tree method, as described in[26], was used. Briefly, spot intensities in each gel were represented by an expression vector of dimension n (n being the number of spots). The Euclidian distance between vectors, which repre-sents all experiments and their spots intensities, was calcu-lated. The resulting distance matrix was used to perform a clustering of all the experiments. The clustering and the resulting unrooted“dispersion tree” graphical representation were performed with the PHYLIP v3.6 package (http:// evolution.genetics.washington.edu/phylip.html).
2.6.2. Outlier detection using the Mahalanobis distance
The Mahalanobis distance depends on estimates of the mean, standard deviation and correlation of the data. For each value, the distance is denoted dMand is computed as:
dMð Þ =x
ffiffiffiffiffiffiffiffiffiffiffiffiffiffiffiffiffiffiffiffiffiffiffiffiffiffiffiffiffiffiffiffiffiffi x−μ
ð ÞΤ∑−1ðx−μÞ q
Using the Mahalanobis distance, we could measure the distance of each gel, described by a multivariate vector x, to the distribution of all other n gels, characterised by their mean μ and covariance matrix Σ. The distance was plotted for each gel and outlier gels could be identified by highlighting the points with the largest distance values.
2.6.3. Principal component analysis (PCA)
PCA is a technique to take linear combinations of the original variables such that the first principal component has maxi-mum variation; the second principal component has the next most variation subject to being orthogonal to the first and the remaining components must all display these two features. The ranking of components in decreasing order determines the data variability. PCA is thus used to attribute the overall data variability to a reduced set of variables, which are called “principal components”. The first two principal components are used to map each gel in a 2D plot. With this approach, a gel that deviates too much from the others can be considered as an outlier.
2.6.4. Pearson correlation matrix
The Pearson correlation coefficient measures the strength of the linear relationship between two gels. For x and y gels, it is denoted as r and computed as:
rxy= ∑n i = 1 xi−x ð Þ yði−yÞ ffiffiffiffiffiffiffiffiffiffiffiffiffiffiffiffiffiffiffiffiffiffiffiffiffiffiffiffiffiffiffiffiffiffiffiffiffiffiffiffiffiffiffiffiffiffi ∑n i = 1 xi−x ð Þ2∑n i = 1 yi−y ð Þ2 s
If there is an exact linear relationship between two gels, the correlation is 1 or−1, depending on whether the variables are positively or negatively related. If there is no linear relation-ship, the correlation is close to zero. A matrix of correlation coefficients is calculated and a colour map of the Pearson correlations coefficients is plotted to show the groups of gels that have similar correlations (on a scale from red (+1) to green (−1)).
2.6.5. Hierarchical ascendant clustering analysis
HAC is a method of cluster analysis, based on a pairwise distance matrix, which builds a hierarchy of clusters with sequentially agglomerative and divisive approaches. We have used this method to organise the map and to group the spots according to the nearest level of intensity. For this analysis, raw data were mean-centred and Pearson correlation matrix and average linkage were chosen as parameters.
2.7. Virtual 2D gels
The Sili2DGel algorithm [27] was used for its capacity to generate virtual gels from data derived from the Progenesis Samespot®alignment.
2.8. Protein identification
Several fully conserved spots (occurring in different areas of the gels) but presenting different intensities were excised from preparative gels and washed successively with water, 25 mM ammonium bicarbonate, acetonitrile/25 mM ammonium bi-carbonate (1:1, v/v) and pure acetonitrile. A small number of variable spots were also excised. Dried gels were rehydrated in 25 mM ammonium bicarbonate (pH 7.8) containing 0.1μg trypsin (Sequencing Grade Modified Trypsin, Promega, Madison, USA) and incubated at 37 °C overnight. The resulting peptides were extracted twice from the gel pieces with acetonitrile/water (3:2, v/v) containing 0.1% trifluoroacetic acid in an ultrasonic bath for 15 min. Supernatants were pooled and the final volume was reduced to 10μl under vacuum. Trypsin-digested samples (0.8μl) were mixed with 0.8μl of matrix solution (α-cyano-4-hydroxycinnamic acid) and spotted on the MALDI target.
MS and MS/MS analysis were performed, in positive reflector mode, using an UltraFlex II mass spectrometer (Bruker Dal-tonics). All spectra were externally calibrated with a peptide mix. Typically, 200 laser shots were summed to generate a peptide mass fingerprint for each protein digest. MS and MS/MS spectra annotations were performed manually and only peaks with a signal to noise ratio higher than 3 were taken into account
to generate the peak lists. These spectra were analysed using the MASCOT software (Matrix Science, London, UK) and searched against MSDB database (3,239,079 sequences) with the following parameters: mammalian taxonomy, trypsin digestion with one missed cleavage allowed, carbamidomethyl modification of cysteine as fixed modification and oxidation of methionine as variable modification, 50 ppm mass tolerance for MS and 0.3 Da for MS/MS fragment ions. Three spots were picked in three different 2D gels (from three different healthy subjects) and were identified in MS and/or MS/MS in order to validate the protein identification in samples from different subjects.
2.9. Databases of normal urinary proteins
The 1.5 version of the Database of Urinary Proteins (DUP) (Salvetat N et al. manuscript in preparation;http://www.sysdiag.cnrs.fr/ DUP/) collects 3080 proteins that have been reported in 19 publications to occur in human normal urine. The occurrence in the DUP database of the proteins identified in this study was checked. A publicly available database of proteins found in various body fluids, including urine, was also used[28].
3.
Results
3.1. Key assessments for urinary 2D-GE profiling studies 3.1.1. Collection and storage conditions
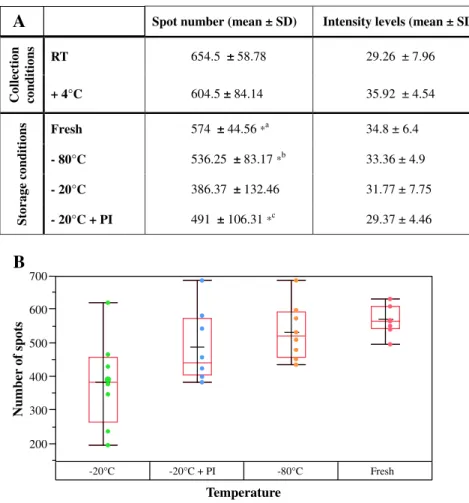
Maintaining protein integrity is a key issue in the collection and storage of biological samples for clinical proteome analysis, particularly for biomarker discovery. It is difficult, however, to perfectly control after-collection conditions prior to long-term freezer storage. In order to estimate the impact of temperature after urine collection and before freezing at −80 °C, urines were collected, kept at room temperature (RT) for 1 h and then stored at +4 °C or at RT for another 7 h. Afterwards, a qualitative and quantitative analysis by 2D-GE was performed. For the qualitative analysis, all protein spots in the gels were detected using the Progenesis Samespot® software, the background was subtracted and, finally, the presence or absence of a protein spot at a given position was checked (the total number of protein spots per gel was also ascertained). The number of protein spots in gels in which urine samples stored at RT for 7 h were analysed, was comparable to the number obtained when using urines stored at +4 °C (ratio 1.08) (Fig. 1A). No quantitative changes as measured by the mean intensity level (which reflects changes in protein amount) were observed between urines stored at RT for 7 h and urines stored at + 4 °C. RT is a fuzzy parameter since it may largely vary depending on the season and location. In order to control this parameter and since there is no difference observed between RT and 4 °C, we decided to fix it at 4 °C. An evaluation of the effect of the storage temperature on the 2D protein profile was also performed using fresh urine samples, urines stored at−20 °C (with or without protease inhibitors) and urines stored at−80 °C (Fig. 1A and B). This analysis was carried out on four biological replicates (2 men and 2 women)
collected twice at one month difference. Using the criteria described above, no significant differences in the number of protein spots and in mean intensity level were observed when using fresh urines (574 protein spots) and samples stored at −80 °C (536 protein spots) or at −20 °C+protease inhibitors (491 protein spots). Conversely, a significant qualitative change was found between urine samples stored at −20 °C (386 protein spots) and fresh urines or samples stored at−80 °C/ −20 °C+protease inhibitors. The use of fresh urine seems to be the best protocol for optimal protein integrity. However, this option is not realistic for large scale proteomic analyses and therefore we decided to perform our study using urine samples stored immediately after collection (less than 2 h) at +4 °C and then at−80 °C until use.
3.1.2. Total protein quantification and reduction and alkylation of proteins before IEF
The modified Lowry method (RCDC protein kit assay) and the Bradford method were compared for total urinary proteins quantification. The coefficient of variation (CV) was calculated for each assay and then for two different experimenters. The RCDC kit showed less variation between measurements of the same urine sample (experimenter 1: CV = 0.06; experimenter 2: CV = 0.07) than the Bradford protein assay (experimenter 1: CV = 0.11; experimenter 2: CV = 0.12).
To get high resolution 2D-GE patterns of urines, different optimization steps were found necessary and in particular, the analysis of different reducing (dithioerythritol, DTE; tris (2-carboxyethyl) phosphine, TCEP) and alkylating (iodoace-tamide, IAM; 4-vinylpyridine, VP) agents prior to the 1st dimension run. The condition of reduction with DTE without alkylation provided the best resolution for protein spots on 2D-GE gels (data not shown). Also, in order to optimise the spot resolution in the basic zone of the gel, a paper soaked with three different solutions (i.e., water, DTE or DeStreak Rehydration Solution) was added to the electrode side of the tank during IEF. Addition of a paper soaked with 50 mM DTE seemed to favour spot resolution and also to increase slightly the number of detectable spots in the basic area of gel (data not shown). This optimised 2D protein separation protocol was then applied in our study of the variability of healthy human urinary proteome.
3.2. Post 2D-GE quality assessment
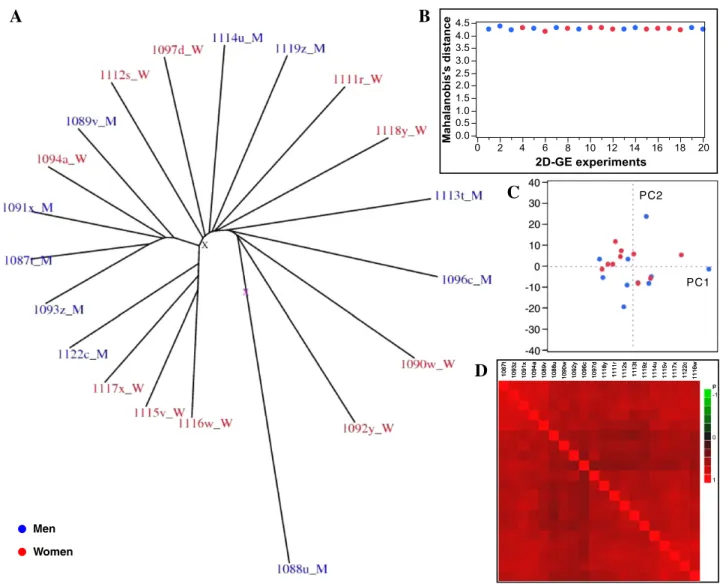
Proteins from urine samples from twenty apparently healthy subjects (10 men and 10 women) were separated by 2D-GE in two different runs (10 gels per run). In order to compare the twenty individual proteomes, it was important to assess the consisten-cy of our dataset after 2D-GE separation. To this end, we used a dispersion tree approach which assesses the consistency of a set of results from proteomic experiments[26]. The twenty 2D-GE experiments were homogeneously dispersed (ideally, the twen-ty branches of the tree would form a circle) (Fig. 2A) with only one gel being slightly outside the circle. After careful examina-tion, this gel did not present apparent defects. Its particular behaviour was probably due to some particular intrinsic properties of this sample and not to experimental problems and thus the gel was retained for further analysis. The homogeneity of the data was also confirmed by three other
statistical methods: the Mahalanobis distance (Fig. 2B), the principal component analysis (PCA) (Fig. 2C) and the Pearson correlation (Fig. 2D). The homogeneity of our dataset was further corroborated by assessing the technical variability of 2D-GE and the intra- and inter-individual changes in normal urinary proteome on four different samples. The technical repeat measurements gave a mean CV gel of 0.044 (CV spot = 0.213) and the variation of the proteome of each of the four individuals (intra-individual variability) was 0.122 (CV spot = 0.305). The inter-individual CV gel value was 0.115 (CV spot= 0.448).
The influence of gender, age and protein concentration on the variability of the urine proteomes was evaluated. There was no significant difference between the data obtained with female and male urine samples as visualised by the dispersion tree, Mahalanobis graph and PCA representation (Fig. 2). These results confirm previous observations [12,20,21]. Moreover, the mean donor's age and total protein concentration were not significantly different between male and female samples (data not shown).
3.3. Variability of human normal urinary proteome
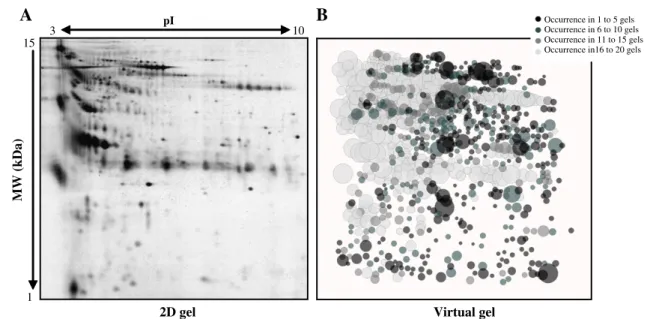
To estimate the variability of the normal urinary proteome, a qualitative analysis was then performed as described above and 910 protein spots were aligned (mean number of spots per gel was 498± 107). This result is consistent with previous similar studies, although the number is higher [13,17,21,23,29–31]. However, these 910 protein spots were not present in all gels as shown by the virtual gel representation (Fig. 3B). The rough similarity between the 2D profile of an individual sample (Fig. 3A) and the virtual gel profile that represents all the collected data (Fig. 3B) suggests a relative homogeneity in the protein content of each urinary proteome. A large part of the spots (35%) could be considered as conserved (322 protein spots in light grey, i.e., occurring in 16 to 20 gels). The most and the least conserved spots (protein spots occurring in 16 to 20 gels and 1 to 5 gels, respectively) exhibited a broad spectrum of MW, pI and intensities, suggesting the absence of obvious bias towards the characterization of conserved or variable proteins. 200 300 400 500 600 700 -20°C -20°C + PI -80°C Fresh
Temperature
Number
of spots
Spot number (mean ± SD) Intensity levels (mean ± SD)
Co llection co nditions RT 654.5 ± 58.78 29.26 ± 7.96 + 4°C 604.5 ± 84.14 35.92 ± 4.54 Sto ra ge co nditions Fresh 574 ± 44.56*a 34.8 ± 6.4 - 80°C 536.25 ± 83.17*b 33.36 ± 4.9 - 20°C 386.37 ± 132.46 31.77 ± 7.75 - 20°C + PI 491 ± 106.31*c 29.37 ± 4.46
A
B
Fig. 1– Number of spots in 2D-GE experiments using urine samples collected and stored at different temperatures. (A) Mean number of spots in 2D-GE experiments for each temperature of sample collection and storage and mean spot intensity for each tested condition. Two biological replicates were tested for post-collection conditions and four for storage conditions. Each biological replicate was run in duplicate. (B) The distribution of the number of spots in 2D-GE experiments for different temperatures of urine storage is shown in the box plot. The ends of the box are the 25th and 75th quantiles. The red and the black line inside each box identify respectively the median and the mean of each group.*aSignificant difference in spot count between fresh and−20 °C storage temperature; *bSignificant difference in spot count between−80 °C and −20 °C storage temperature and *cSignificant difference in spot count between−20 °C and −20 °C+PI storage temperature. There was no statistically significant difference in the mean number of spots and the mean intensity between all the other collection and storage conditions.
Additional information emerged from the analysis of the spot distribution in the twenty gels (Fig. 4). About 13% (exactly, 13.07%) of the protein spots were present only in ten percent or less of the samples and thus represented the most variable part of the urinary proteome. On the other hand, 23% (23.6%) of the protein spots were found in at least 90% of the samples and 16.15% of the spots (i.e., 147 protein spots) were present in all gels.
To verify that spot conservation was not biased by the spot intensity (i.e., the strongest spots being also the most conserved because they are more easily detectable), spot intensities were subjected to a hierarchical clustering analysis (Fig. 5). Four main clusters of spots emerged and within each cluster, the intensity of the protein spots was comparable (see heat map inFig. 5). The majority of the conserved spots (2
central clusters) were characterised by a relatively moderate intensity level (the green colour corresponds to low intensity and the red colour to high intensity), while a smaller cluster showed higher intensities (the red colour correspond to high intensity level). Then the quantitative variations in intensity of the 147 fully conserved spots were specifically evaluated by calculating their mean intensity and dispersion (coefficient of variation, CV). No correlation between CV and mean intensity was found (R = 0.44), indicating that, among the conserved spots, the weakest spots were not associated with the greatest variability (which could have been the case because of the faint signal). Thus, if we consider that spots are representative of proteins, our results indicate that a significant part (around 25%) of the normal urinary proteome is highly conserved and that most of the conserved spots are of medium intensity.
PC2 PC1 Women Men
A
B
C
D
Fig. 2– Post 2D-GE quality assessment. (A) Dispersion tree of the twenty 2D-GE experiments. Spot intensities in each gel were represented by an expression vector and the Euclidian distance between vectors was calculated. The resulting distance matrix was used to perform a clustering of all the experiments and the data dispersion was analysed (the data from men's urine samples are in blue and the data from women's urine samples in red). (B) Mahalanobis distance graph of the twenty 2D-GE experiments. The Mahalanobis distance depends on the estimates of the mean, standard deviation and correlation of the data. (C) Principal component analysis (PCA) of the twenty 2D-GE experiments. The first two principal components are used to map each experiment into a 2D plot. (D) Pearson correlation matrix of the twenty 2D-GE experiments. The colour map of the Pearson correlations coefficients shows the groups of samples that have similar correlations on a scale of correlation from red (+1) to green (−1).
Twenty proteins corresponding to a fraction of the fully conserved spots and four proteins corresponding to a fraction of the highly variable spots (occurrence in 1 gel) were then identified by excision from the protein spot, trypsin digestion and peptide mass fingerprinting (Table 1, Table S1). Eleven of them were proteins present in the plasma proteome, a finding which is in accordance with the known blood filtration properties of the kidney. Some proteins were found at MW positions in the 2D gel that matched their
theoretical molecular weight (Epithelial Cadherin, Glutami-nyl-Peptide Cyclotransferase, Phosphatidylethanolamine-Binding Protein 4). Others were found at positions consistent with spots belonging to proteolytically processed proteins (e.g., Mannan-Binding Lectin Serine Protease 2, Serum Albumin, AMBP, Basement Membrane-Specific Heparan Sulfate Proteoglycan core protein, Trypsinogen 4). Finally, many protein spots were at positions compatible with an increased molecular weight due to post-translational mod-ifications (e.g., Alpha-1β-Glycoprotein, Monocyte Differenti-ation Antigen CD14, secreted and Transmembrane Protein 1, Zinc-Alpha-2-Glycoprotein, Uromodulin, Alpha-1-antitryp-sin). It was not possible, due to the limited number of identified proteins, to determine whether the most con-served spots and the highly variable spots corresponded more frequently to full-length proteins rather than processed proteins. In order to validate the identification of the most conserved protein, three spots (including the one corre-sponding to AMBP protein and its fragment) were picked from three different 2D gels corresponding to three different healthy subjects and analysed by MS or MS/MS. The protein identification was confirmed for the three spots in the three different samples. This confirmed the conservation of the protein observed among the subjects.
Finally, our Database of Urinary Proteins and the Sys-BodyFluid database [28]confirmed that most of the twenty four identified proteins have been previously described (Table 1) in more than 7 publications; only Phosphatidyleth-anolamine-Binding Protein 4, Prostaglandin D2 synthase 21 kDa and Cell adhesion molecule 4 were reported only two, three and five times, respectively. The Orphan short-chain dehydrogenase/reductase and Trysinogen 4 were not previ-ously described in the two urine databases studied.
pI
Virtual gel
3 10MW (kDa)
1 15 Occurrence in 1 to 5 gels Occurrence in 6 to 10 gels Occurrence in 11 to 15 gels Occurrence in16 to 20 gels2D gel
A
B
Fig. 3– Experimental and virtual 2D-GE images. (A) Representative 2D-GE image of the urine proteome of one of the 20 normal individuals. Precast IPG strips (pH 3-10NL) were rehydrated with 70μg of protein sample and after the first dimension, proteins were separated on 12% SDS-polyacrylamide gels. Gels were stained with silver nitrate. (B) Virtual gel representation of spot variability within the 20 urinary samples computed with the Sili2Dgel software; the diameter of each spot is proportional to its mean intensity and its colour is coded according to the number of time is present in the twenty 2D-GE experiments.
0 20 40 60 80 100 120 140 160 10 20 30 40 50 60 70 80 90 100
Percentage of samples
Number of spot
13.07% 23.6 %Fig. 4– Distribution of the number of spots found in the 20 2D-GE. The presence of each individual spot in the twenty gels was checked after alignment, then the background was subtracted and, finally, the presence or absence of a spot at a given position was checked. Occurrence of each protein spot was counted in the twenty 2D-GE experiments. The numbers above the double-headed arrows correspond to the percent-age of spots found only in 10% (most variable proteome) and in 90% (most conserved proteome) of the urinary samples.
4.
Discussion
The current major interest in the identification of clinical urinary biomarkers for renal diseases and even for a larger spectrum of pathologies requires i) standardisation of the methods used for collection, storage and preparation of samples and ii) estimation of the urine normal proteome variability. Standardised protocols have recently been pro-posed by the HKUPP (Human Kidney and Urine Proteome, EU) and EuroKUP (European Kidney and Urinary Proteomics, EU FP7) groups but some points have not been completely evaluated: the addition of protease inhibitors is still under investigation and in particular for the samples storage at −20 °C. Moreover concerning the time of freezing, nothing was indicated. We thus examined some of the parameters for sample collection, storage and processing that may affect proteomic analysis by 2D-GE approach. Several studies have already evaluated these parameters using techniques like SELDI[6,32,33], CE/MS[34], magnetic beads/MS[35]and 1D LC/ MS[2], that focus more on the urinary peptidome than on the
proteome. Addition of protease inhibitors prior freezing was also debated since this may interfere with the proteome analysis [36,37]. Our study indicates that there are no significant qualitative and quantitative changes in urine samples stored at RT or +4 °C just after urine collection and before freezing at−80 °C. These results confirm the stability of urinary proteins for few hours before freezing [6,32]. The comparison of the urinary 2D profile from samples freshly used, stored at −20 °C with protease inhibitors or stored at −80 °C showed no qualitative difference. Conversely, samples stored at−20 °C without protease inhibitors presented a lower protein spot count than samples stored in the other condi-tions. It seems important to add protease inhibitors for long-term storage at−20 °C for 2D profile study. By using a similar approach, Havanapan and Thongboonkerd described no quantitative and qualitative changes in urine samples stored at −30 °C with or without protease inhibitors however, samples were stored at−30 °C only 23 h[36]. Hence, on the basis of our results and those described in the literature, the immediate storage of urine samples at + 4 °C (2 h maximum after collection) until storage at−80 °C seems the best way for long-term sample preservation for 2D-GE analysis of the urine proteome. Moreover, this storage option is compatible with clinical requirements[31,37].
The characterisation of the urinary proteome is the target of many studies[38]. By omitting articles devoted to the identifi-cation of urinary biomarkers, we found 19 recent publiidentifi-cations describing the proteomic content of normal human urine. However, the repositories of more than 3000 unique urinary proteins that we and others have established from the available literature (DUP database and Sys-BodyFluid database[28]) do not specify whether any of these proteins is unique to the individual that provided the urine sample or shared by everybody, even though the evaluation of the conservation/ variability of proteins in normal urines is important for the discovery of urine biomarkers. To address the question of the variability of the normal urinary proteome, we used the 2D-GE method because it has high resolving power, it is semi-quantitative and it allows the comparison of individual clinical samples in a medium-throughput manner. In addition, differ-ences in the isoelectric point or molecular weight can be used to differentiate post-translationally modified proteins [39]. The analysis of the dispersion of results from the twenty 2D-GE experiments (Fig. 2) confirmed the overall quality of the dataset, thus allowing meaningful gel to gel comparisons of protein spots.
Studies of proteins variability in normal urines are scarce and their conclusions are conflicting[12,17,21,22]. Our findings clearly indicate that the human urinary proteome is charac-terised by a low variability as 13% of the spots represented the variable components of the urine (i.e., present in only 10% of samples), whereas 23.6% of the proteome was highly conserved (i.e., present in 90% or more of the samples). Khan and colleagues studied the proteome of a single subject and found important changes when assessing within-day and day-to-day variations; these variations could increase the inter-individual variations we observed[17]. Our results and conclusions are not in agreement with those of Oh et al.[12]. This may be explained by the low number of samples they analysed (three vs. twenty), differences in sample collection (1st vs. 2nd morning urine) and Fig. 5– Heatmap and hierarchical ascendant clustering of the
147 spots present in all 2D-GE. The intensity levels of the 147 spots present in all twenty 2D-GE experiments were visua-lised by heatmap and hierarchical ascendant cluster analysis (Pearson correlation with average linkage) using the JMP v8 software. Each column represents the data of one 2D-GE experiment. Rows represent individual spots. Raw data were mean-centred and the colour code is graduated from green (low level of intensity) to red (high level of intensity). Hierarchical clustering analysis was used to organise the map and to group the spots according to nearest level of intensity.
in sample handling (precipitation vs. non-precipitation). Simi-larly, the study by Thongboonkerd and colleagues, although performed on a larger sample (8 individuals) was only based on a small number of aligned spots (115−246) and probably missed some of the medium/low intensity spots[21]. This could have greatly biased the authors' conclusions, since we found that the conserved proteome comprises mostly low to medium intensity spots. Adachi et al. showed by LC-MS that the urinary proteome of a single person comprises a major set (61.9%) of proteins that is also found in a pool of 9 urines[18]. By a similar approach, Nagaraj and Mann described a common and abundant set (72%) of proteins in seven normal individuals [20]. These recent reports and our findings contribute to the view that, in urine, a minor variable protein set coexists with a major conserved protein set. However, we found a smaller percentage (about 24%) of conserved proteins in comparison to the studies in which LC-MS was used (more than 60%). Indeed, when using 2D-GE methods for protein separation, the same protein could be represented in different spots with different molecular weight and isoelectric point. Conversely, LC-MS is a global analysis of all
proteins present in samples and it does not distinguish among the possible different forms (modified, fragmented) of a protein. By looking at the intensity distribution and spot conserva-tion, the highly conserved spots were in average more intense than the poorly conserved (supplementary data Fig. S1). However, a large overlap of intensities from highly conserved, medium conserved and highly variable spots exits (Fig. S1). Interestingly, the poorly and moderately conserved spots show a rather similar distribution (although the intensity seems to have little influence). Although the intensity might influence the conservation assessment, it is certainly not the main cause of conservation/variability. The consequence is probably an over estimation of variable proteome in a 2D gel experiment and an underestimation of the conserved proteome.
The protein identification study indicates that few spots, occurring at different positions in the gels, were assigned to the same protein (Lysosomal Acid Glucosidase, Serum Albumin, antibody fragments, AMBP, Serotransferrin, Trysinogen 4). This is consistent with the coexistence in urine of full-length and degraded forms of a given protein [40]. Nine of the identified
Table 1– Identification of the protein spots.
Protein name Accession number (UniProt ID) Origin P, plasma protein O, other origin Ratio exp. MW/ theoretical MW Occurrences in DUPa Occurrences in Sys-BodyFluid databaseb Alpha-1B-glycoprotein [precursor] P04217 P > 1 10 5
AMBP protein [precursor] P02760 P < 1c 14 9
Antibody fragment P ND – –
Basement membrane-specific heparan sulfate proteoglycan core protein [precursor] [fragment]
P98160 O < 1 11 6
Epithelial cadherin [precursor] P12830 O 1 7 4
Gelsolin [precursor] P06396 O < 1 10 6
Glutaminyl-peptide cyclotransferase [precursor] Q16769 O 1 10 8
Kininogen-1 [precursor] P01042 P < 1 13 8
Lysosomal acid phosphatase [precursor] P11117 O > 1 10 6
Lysosomal alpha-glucosidase [precursor] P10253 O 1 or <1d 9 3
Mannan-binding lectin serine protease 2 [precursor] O00187 P < 1 12 6
Monocyte differentiation antigen CD14 [precursor] P08571 O > 1 10 6
Phosphatidylethanolamine-binding protein 4 [precursor]
Q96S96 O 1 2 1
Prostaglandin D2 synthase 21 kDa (brain) [fragment] Q5SQ09 O > 1 3 2
Prostate specific antigen precursor P07288 P > 1 8 6
Secreted and transmembrane protein 1 [precursor] Q8WVN6 O > 1 10 6
Serotransferrin [precursor] P02787 P > 1c 15 9
Serum albumin precursor P02768 P < 1 or > 1e 10 9
Uromodulin [precursor] P07911 O > 1 14 8
Zinc-alpha-2-glycoprotein [precursor] P25311 P > 1 12 6
Orphan short-chain dehydrogenase/reductasef Q8NEX9 O < 1 0 0
Trypsinogen 4f A8CED1 P > 1c 0 0
Cell adhesion molecule 4f Q8NFZ8 O > 1 5 3
Alpha-1-antitrypsinf P01009 P > 1 15 9
a The Database of Urinary Proteins, release 1.5, lists 3080 non-redundant entries of proteins that have been found in 19 articles on urinary
proteomics.
bThe Sys-BodyFluid Database lists 1941 (partially redundant) entries from 9 articles on urinary proteomics. c Two different spots yielded the same protein assignment.
d Two different spots yielded the same protein assignment, one with an apparent MW of 106 kDa and the other of 69.6 kDa, compared to the
theoretical MW of 105.338 kDa.
e Two different spots yielded the same protein assignment, one with an apparent MW of 53.9 kDa and the other of 78 kDa, compared to the
theoretical MW of 69.367 kDa.
proteins were of plasmatic origin, in rough accordance with the proposed ratio of 30% of urinary proteins originating from plasma filtration by the kidney glomeruli[9,41]. However, the finding that several of these proteins have high molecular weights, questions the size criteria that are used as a measure of the functionality of the glomerular filtration barrier [42,43]. The analysis of the occurrence of the 24 proteins in the literature was facilitated by the availability of the DUP and Sys-BodyFluid databases. Most of the proteins were mentioned in several publications (7 to 15) with the exception of Phosphatidylethanolamine-binding protein 4, Prostaglandin D2 synthase 21 kDa, Cell adhesion molecule 4, Orphan short-chain dehydrogenase/reductase and Trysinogen 4. An unexpected finding was the identification of Prostate Specific Antigen (PSA) both in male and female urine samples. It is known that PSA is a circulating molecule in small amount in healthy men[44]. PSA was also previously observed in 38% of female urines[45]due to production by the periurethral glands [46]. Another study showed that 80% of healthy women's urines contain detectable amount of PSA, a proportion that increases up to 92% in women taking oral contraceptives[47]. As it is likely that most of the women who participated in our study were under hormonal treatment, this could explain our observation.
Our attempt to characterise quantitative variations in the conserved part of the urinary proteins shows that most of the conserved spots are characterised by a large spectrum of intensity (from weak to high). They possibly correspond to minor plasma proteins filtered from the glomeruli, to small amounts of proteins released from renal epithelial cells, or to protein fragments released through enzymatic cleavage by tubular enzymes.
In conclusion, a“public” urinary proteome which is common to healthy individuals seems to coexist with a“private” urinary proteome, which is more specific to each individual. Our results show that a significant part of the normal urinary proteome seems to be“public” i.e., shared among individuals. This crucial information should be kept in mind when looking at urinary biomarkers of diseases. Indeed, if a biomarker belongs to the “public” part of the urinary proteome, only its quantitative variations will be of use in clinical diagnostic. Conversely, if a putative biomarker belongs to the “private” proteome, the detection of its absence/presence is more likely to be of diagnostic value. It thus appears necessary now to determine which proteins are common to all individuals and which are present only in some individuals. At the same time, important efforts need to be realised to render proteomic methods more susceptible to yield quantitative information[48]. In the future standardised exhaustive maps of the normal urinary proteome from samples that have been collected/stored following differ-ent procedures (with the iddiffer-entification of all protein spots) will be helpful to further investigate the human urine variability.
Supplementary materials related to this article can be found online atdoi:10.1016/j.jprot.2011.06.031.
Acknowledgements
The financial support of the LIA 135 by the CNRS is acknowledged. LM and RB were supported by CNRS. The MS and MS/MS analyses were performed in the Proteomics Pole of
Montpellier supported by the Région Languedoc-Roussillon and IBISA.
R E F E R E N C E S
[1] Decramer S, Gonzalez de Peuto A, Breuil B, et al. Urine in clinical proteomics. Mol Cell Proteomics 2008.
[2] Lee RS, Monigatti F, Briscoe AC, Waldon Z, Freeman MR, Steen H. Optimizing sample handling for urinary proteomics. J Proteome Res 2008;7:4022–30.
[3] Anderson NG, Anderson NL, Tollaksen SL. Proteins of human urine. I. Concentration and analysis by two-dimensional electrophoresis. Clin Chem 1979;25:1199–210.
[4] Thongboonkerd V, Gozal E, Sachleben Jr LR, Arthur JM, Pierce WM, Cai J, et al. Proteomic analysis reveals alterations in the renal kallikrein pathway during hypoxia-induced
hypertension. J Biol Chem 2002;277:34708–16.
[5] Spahr CS, Davis MT, McGinley MD, Robinson JH, Bures EJ, Beierle J, et al. Towards defining the urinary proteome using liquid chromatography-tandem mass spectrometry. I. Profiling an unfractionated tryptic digest. Proteomics 2001;1:93–107. [6] Schaub S, Wilkins J, Weiler T, Sangster K, Rush D, Nickerson P.
Urine protein profiling with surface-enhanced laser-desorption/ionization time-of-flight mass spectrometry. Kidney Int 2004;65:323–32.
[7] Sun W, Li F, Wu S, Wang X, Zheng D, Wang J, et al. Human urine proteome analysis by three separation approaches. Proteomics 2005;5:4994–5001.
[8] Pisitkun T, Shen RF, Knepper MA. Identification and proteomic profiling of exosomes in human urine. Proc Natl Acad Sci USA 2004;101:13368–73.
[9] Pieper R, Gatlin CL, McGrath AM, Makusky AJ, Mondal M, Seonarain M, et al. Characterization of the human urinary proteome: a method for high-resolution display of urinary proteins on two-dimensional electrophoresis gels with a yield of nearly 1400 distinct protein spots. Proteomics 2004;4: 1159–74.
[10] Castagna A, Cecconi D, Sennels L, Rappsilber J, Guerrier L, Fortis F, et al. Exploring the hidden human urinary proteome via ligand library beads. J Proteome Res 2005;4:1917–30. [11] Soldi M, Sarto C, Valsecchi C, Magni F, Proserpio V, Ticozzi D,
et al. Proteome profile of human urine with two-dimensional liquid phase fractionation. Proteomics 2005;5:2641–7. [12] Oh J, Pyo JH, Jo EH, Hwang SI, Kang SC, Jung JH, et al.
Establishment of a near-standard two-dimensional human urine proteomic map. Proteomics 2004;4:3485–97.
[13] Zerefos PG, Vougas K, Dimitraki P, Kossida S, Petrolekas A, Stravodimos K, et al. Characterization of the human urine proteome by preparative electrophoresis in combination with 2-DE. Proteomics 2006;6:4346–55.
[14] Wang L, Li F, Sun W, Wu S, Wang X, Zhang L, et al. Concanavalin A-captured glycoproteins in healthy human urine. Mol Cell Proteomics 2006;5:560–2.
[15] Sleat DE, Zheng H, Lobel P. The human urine mannose 6-phosphate glycoproteome. Biochim Biophys Acta 2007;1774:368–72.
[16] Ru QC, Katenhusen RA, Zhu LA, Silberman J, Yang S, Orchard TJ, et al. Proteomic profiling of human urine using
multi-dimensional protein identification technology. J Chromatogr A 2006;1111:166–74.
[17] Khan A, Packer NH. Simple urinary sample preparation for proteomic analysis. J Proteome Res 2006;5:2824–38. [18] Adachi J, Kumar C, Zhang Y, Olsen JV, Mann M. The human
urinary proteome contains more than 1500 proteins, including a large proportion of membrane proteins. Genome Biol 2006;7: R80.
[19] Candiano G, Santucci L, Petretto A, Bruschi M, Dimuccio V, Urbani A, et al. 2D-electrophoresis and the urine proteome map: where do we stand? J Proteomics 2010;73:829–44. [20] Nagaraj N, Mann M. Quantitative analysis of the intra- and
inter-individual variability of the normal urinary proteome. J Proteome Res 2011;10:637–45.
[21] Thongboonkerd V, Chutipongtanate S, Kanlaya R. Systematic evaluation of sample preparation methods for gel-based human urinary proteomics: quantity, quality, and variability. J Proteome Res 2006;5:183–91.
[22] Lafitte D, Dussol B, Andersen S, Vazi A, Dupuy P, Jensen ON, et al. Optimized preparation of urine samples for two-dimensional electrophoresis and initial application to patient samples. Clin Biochem 2002;35:581–9.
[23] Thongboonkerd V. Practical points in urinary proteomics. J Proteome Res 2007;6:3881–90.
[24] Weekes J, Wheeler CH, Yan JX, Weil J, Eschenhagen T, Scholtysik G, et al. Bovine dilated cardiomyopathy: proteomic analysis of an animal model of human dilated
cardiomyopathy. Electrophoresis 1999;20:898–906.
[25] Molina L, Grimaldi M, Robert-Hebmann V, Espert L, Varbanov M, Devaux C, et al. Proteomic analysis of the cellular responses induced in uninfected immune cells by cell-expressed X4 HIV-1 envelope. Proteomics 2007;7:3116–30. [26] Copois V, Bibeau F, Bascoul-Mollevi C, Salvetat N, Chalbos P,
Bareil C, et al. Impact of RNA degradation on gene expression profiles: assessment of different methods to reliably determine RNA quality. J Biotechnol 2007;127:549–59. [27] Peres S, Molina L, Salvetat N, Granier C, Molina F. A new
method for 2D gel spot alignment: application to the analysis of large sample sets in clinical proteomics. BMC
Bioinformatics 2008;9:460.
[28] Li SJ, Peng M, Li H, Liu BS, Wang C, Wu JR, et al. Sys-BodyFluid: a systematical database for human body fluid proteome research. Nucleic Acids Res 2009;37:D907–12.
[29] Smith G, Barratt D, Rowlinson R, Nickson J, Tonge R. Development of a high-throughput method for preparing human urine for two-dimensional electrophoresis. Proteomics 2005;5:2315–8.
[30] Tantipaiboonwong P, Sinchaikul S, Sriyam S, Phutrakul S, Chen ST. Different techniques for urinary protein analysis of normal and lung cancer patients. Proteomics 2005;5:1140–9. [31] Sharma K, Lee S, Han S, Lee S, Francos B, McCue P, et al.
Two-dimensional fluorescence difference gel electrophoresis analysis of the urine proteome in human diabetic
nephropathy. Proteomics 2005;5:2648–55.
[32] O'Riordan E, Orlova TN, Mei JJ, Butt K, Chander PM, Rahman S, et al. Bioinformatic analysis of the urine proteome of acute allograft rejection. J Am Soc Nephrol 2004;15:3240–8. [33] Traum AZ, Wells MP, Aivado M, Libermann TA, Ramoni MF,
Schachter AD. SELDI-TOF MS of quadruplicate urine and serum samples to evaluate changes related to storage conditions. Proteomics 2006;6:1676–80.
[34] Theodorescu D, Wittke S, Ross MM, Walden M, Conaway M, Just I, et al. Discovery and validation of new protein biomarkers for urothelial cancer: a prospective analysis. Lancet Oncol 2006;7:230–40.
[35] Fiedler GM, Baumann S, Leichtle A, Oltmann A, Kase J, Thiery J, et al. Standardized peptidome profiling of human urine by magnetic bead separation and matrix-assisted laser desorption/ionization time-of-flight mass spectrometry. Clin Chem 2007;53:421–8.
[36] Havanapan PO, Thongboonkerd V. Are protease inhibitors required for gel-based proteomics of kidney and urine? J Proteome Res 2009;8:3109–17.
[37] Afkarian M, Bhasin M, Dillon ST, Guerrero MC, Nelson RG, Knowler WC, et al. Optimizing a proteomics platform for urine biomarker discovery. Mol Cell Proteomics 2010;9: 2195–204.
[38] Coon JJ, Zurbig P, Dakna M, Dominiczak AF, Decramer S, Fliser D, et al. CE-MS analysis of the human urinary proteome for biomarker discovery and disease diagnostics. Proteomics Clin Appl 2008;2:964.
[39] Gorg A, Weiss W, Dunn MJ. Current two-dimensional electrophoresis technology for proteomics. Proteomics 2004;4:3665–85.
[40] Hortin GL, Sviridov D. Diagnostic potential for urinary proteomics. Pharmacogenomics 2007;8:237–55.
[41] Thongboonkerd V, Malasit P. Renal and urinary proteomics: current applications and challenges. Proteomics 2005;5: 1033–42.
[42] Tryggvason K, Pettersson E. Causes and consequences of proteinuria: the kidney filtration barrier and progressive renal failure. J Intern Med 2003;254:216–24.
[43] Blouch K, Deen WM, Fauvel JP, Bialek J, Derby G, Myers BD. Molecular configuration and glomerular size selectivity in healthy and nephrotic humans. Am J Physiol 1997;273:F430–7. [44] Oesterling JE, Jacobsen SJ, Chute CG, Guess HA, Girman CJ,
Panser LA, et al. Serum prostate-specific antigen in a community-based population of healthy men. Establishment of age-specific reference ranges. JAMA 1993;270:860–4. [45] Breul J, Pickl U, Hartung R. Prostate-specific antigen in urine.
Eur Urol 1994;26:18–21.
[46] Breul J, Pickl U, Schaff J. Extraprostatic production of prostate specific antigen is under hormonal control. J Urol 1997;157: 212–3.
[47] Mannello F, Condemi L, Cardinali A, Bianchi G, Gazzanelli G. High concentrations of prostate-specific antigen in urine of women receiving oral contraceptives. Clin Chem 1998;44: 181–3.
[48] Anderson NL, Anderson NG, Haines LR, Hardie DB, Olafson RW, Pearson TW. Mass spectrometric quantitation of peptides and proteins using Stable Isotope Standards and Capture by Anti-Peptide Antibodies (SISCAPA). J Proteome Res 2004;3:235–44.