Predicting polytomous career choices in
healthcare using probabilistic expectations data
Juerg Schweri, Swiss Federal Institute for Vocational Education and
Training
1April 28, 2020
Abstract
This paper compares the career expectations and outcomes of Swiss healthcare assistants, an occupation created to increase the supply of new nurses. We investigate whether healthcare assistants can predict their own professional careers two years ahead by eliciting their expectations for a range of career alternatives, including nursing and other studies. Polytomous choice situations have rarely been analyzed using numerical probabilities in the expectations literature. Our results show that almost all respondents gives informative answers. Individuals express considerable uncertainty about their future careers, with over 60 percent expressing varying degrees of uncertainty. The analyses reveal that individuals’ numerical expectations have considerable predictive value for their future careers, even after controlling for a host of variables, but that predicted shares for career alternatives are more accurate over four years than over two years. The information conveyed in numerical expectations and their deviations from actual outcomes enables us to derive policy recommendations to increase transitions to nursing.
Keywords: Career choice; Discrete choice; Healthcare; Medical workforce; Nursing; Subjective
expectations.
JEL classification: C25, D84, I11, I21, J24
1 The author thanks Joop Hartog, Damiano Pregaldini, and Ines Trede for helpful comments and Miriam
Grønning for data support. Funding: The data collection was supported by the Swiss State Secretariat for Education, Research and Innovation. OdASante provided organizational support in the field. Declarations of interest: none. Corresponding author: Juerg Schweri, Swiss Federal Institute for Vocational Education and Training, Kirchlindachstrasse 79, Zollikofen/Bern, Switzerland; E-Mail: [email protected]
2
1. Introduction
Shortages of registered nurses are a major challenge for healthcare systems in many countries. A lack of qualified nurses may lower the quality of healthcare services in general (Tong, 2011; Lin, 2014) and prove disastrous in large-scale emergencies (McHugh, 2010; Hammad, Arbon, Gebbie, & Hutton, 2012; Bell, Dake, Price, Jordan, & Rega, 2014). Most governments regulate health professions for quality reasons (Nicholson & Propper, 2011), but many struggle to train and retain adequate numbers of nurses (Shields, 2004).
In the 1990s, Swiss authorities decided to reduce the country’s heavy reliance on the immigration of healthcare professionals. Nursing studies were repositioned as a three-year tertiary education program to help increase the quality and status of the profession. Because direct admission requires an upper-secondary qualification of some sort, authorities also created a new vocational education program at upper-secondary level, for the occupation of healthcare assistant. Completing this program qualifies the student to enter the tertiary nursing studies program. The aim of this measure was to attract young people to a healthcare career directly after compulsory schooling and thus to increase the recruitment pool for nursing studies.
In this paper, we use healthcare assistants’ (HCAs) career expectations to investigate their career paths, in particular their enrolment in nursing studies and other tertiary level studies. Subjective career expectations make a contribution to the analysis of career paths in two important ways. Firstly, we show that subjective expectations predict actual inflow into nursing and other healthcare studies and careers, even when controlling for numerous observable characteristics. Subjective expectations elicited in surveys may thus help to capture individuals’ private information about future events, and to update national nursing and health planning. Secondly, we compare career expectations and outcomes to assess whether individuals have accurate information on their future career paths or whether they fail to fully anticipate future events and their determinants. This analysis allows us to discuss policy implications for attracting HCAs to nursing careers.
Eliciting subjective career expectations in surveys is not straightforward because of the number of career alternatives available. Such polytomous choice situations under uncertainty are frequent both in healthcare and in other domains: physicians choose between specialties (Nicholson, 2002) and treatments (Manski, 2018), individuals choose their health-related behavior (e.g. their diet, Mora & Lopez-Valcarcel, 2018), and customers choose between products (Blass, Lach, & Manski, 2010). Earlier literature on expected choices, surveyed in the next chapter, typically asked for the most likely of many alternatives. However, this approach does not account for individuals’ uncertainty, as Manski (2004) observed.
3
We elicited HCAs’ subjective expectations for several career paths as numerical probabilities — an approach that has only rarely been used for choice situations with several alternatives. Hence, this paper also contributes to the literature on expectations data by analyzing polytomous choice situations with subjective probabilities.
In section 2, we shortly introduce healthcare professions in Switzerland and the survey used to analyze HCA careers (2.1). Next, we discuss the literature on eliciting subjective expectations (2.2) and show how we applied the state of the art to elicit career expectations of HCAs (2.3). In section 3, we first assess the quality of the expectations data, which tells us whether respondents were willing and able to answer probability questions meaningfully (3.1). We then analyze how expectations are correlated to individual characteristics and earlier educational pathways and investigate the uncertainty that respondents expressed about their future careers (3.2). Comparing career expectations and actual careers descriptively (3.3) and in regression models (3.4) allows us to assess the predictive value of the expectations. In section 4, we discuss findings and recommendations with a focus on the recruitment of nursing students.
2. Methods
2.1.
Analyzing healthcare assistant careersThe most important education tracks at upper-secondary level in Switzerland are firm-based apprenticeships, which are chosen by roughly 60 percent of young people. Most apprenticeships allow entry at age 16, but no such apprenticeship existed for healthcare. Authorities and professional organizations decided to create a new apprenticeship, finally introduced in 2002, to increase the number of skilled workers in healthcare. Thus, becoming a healthcare assistant requires completion of a three-year apprenticeship at upper-secondary level.
HCA apprentices work in hospitals, care homes, or homecare for 3 to 3.5 days a week and attend vocational school for 1 to 1.5 days. The program is regulated by a federal ordinance that defines the occupational skills to be acquired, duration, curriculum, and final exam. The introduction of the new HCA program proved a success in increasing numbers: HCA is today the second most popular of 230 apprenticeship programs at upper-secondary level in Switzerland.1 Hence, HCAs are the most important recruiting
pool for nursing studies at professional colleges and universities of applied sciences, well ahead of graduates from general education programs at upper-secondary level. In addition, HCA graduates can also enter a host of other tertiary studies in healthcare,
1 The number of newly trained nurses has also increased, but still falls short of the numbers needed to
4
such as paramedic, midwife, physiotherapist, and ergotherapist, or transfer to tertiary studies in other domains such as social work and teaching.2
In the late 2000s, the ongoing shortage of healthcare personnel, particularly nurses, spurred Swiss authorities to learn more about HCAs’ careers. They financed the collection of data on young HCAs’ future careers in three waves in 2010 (T1), 2012 (T2), and 2016 (T3). The T1 survey encompassed the full cohort of more than 2,000 healthcare assistants in Switzerland in their final year of the program in fall 2010. The survey was conducted during industry courses, which are organized and taught by the cantonal professional health associations and form an integral part of the curriculum. All participants provided informed consent to take part in the online survey during two course lessons.
The T2 follow-up survey was primarily based on the email information given by participants in T1. The T2 online survey took place in 2012, one year after the cohort’s graduation as HCAs in summer 2011. In total, 962 out of 1,056 respondents provided valid information about their current career status and about expectations about their careers in two years’ time in 2014. Of these, 600 also took part in the final follow- up survey T3 in 2016 and provided information about their careers since the previous survey, in particular for 2014 and 2016 (Author, Year).
For these 600 respondents, we are able to compare career expectations in 2012 with actual career status in 2014 and 2016. Some HCAs enter studies directly after graduation, so we control for career status in 2012 in the analyses. Yet, many start working as fully-trained HCAs after graduating and enter studies or change occupation in the months and years to come. Given the many career options after graduation, and the risk of dropping out of studies, HCAs face considerable uncertainty about their future pathways. We elicited this uncertainty as numerical probabilities for a range of career alternatives in the T2 survey (see section 2.3).
The literature on nurses’ labor supply has partly focused on wage elasticity (e.g., Antonazzo, Scott, Skatun, & Elliott, 2003; Nicholson & Propper, 2011; Hanel, Kalb, & Scott, 2014; Schweri & Hartog, 2017), but has also considered a host of additional factors that influence supply beyond wages (e.g., Shields & Ward, 2001; Eberth, Elliott, & Skåtun, 2016; Brook, Aitken, Webb, MacLaren, & Salmon, 2019).
Building on this literature, we control for many variables potentially influencing career choice, which were collected during surveys T1 and T2.3 These include, firstly,
personal variables on age, sex, migration background, children, parents’ education, and
2 The entry requirements depend on the type of tertiary education institutions. Professional colleges can
be entered by holders of federal VET diplomas (such as HCAs), but often require some years of work experience after HCA graduation. Universities of applied sciences require a vocational baccalaureate in addition to the federal VET diploma. HCAs can either acquire the vocational baccalaureate during their HCA training (following extra courses at vocational school for three years) or in a one-year full-time course after graduating as HCA.
3 Questionnaire T1 also profited from earlier experience in a pilot study with 272 HCAs in the Canton of
Bern, in which many similar variables were collected, albeit without numerical career probabilities (see Author, Year).
5
the number of books in the parental home. Secondly, institutional variables include the type of school track at lower-secondary level, whether HCA training included vocational baccalaureate courses, the type of training firm (acute hospital, nursing home, or home care; see Grønning & Trede, 2019, on differential careers due to training firm type), the size of the training firm, and dummies for the regions of activity of the regional healthcare associations, which mostly coincide with cantons. Finally, we include variables representing cognitive and noncognitive skills: the grade point average at the final exam of HCA training, time preference, risk aversion, career motivations (intrinsic, extrinsic, altruistic), professional commitment to the HCA occupation, satisfaction with HCA training, self-efficacy during HCA training in general education class and in work tasks, importance of work‐life balance, and intentions on working full time or part time.4
2.2. How to elicit polytomous career expectations
Education and career choices are important inputs for the efficient operation of healthcare systems (Nicholson & Propper, 2011). Choice outcomes are highly uncertain ex ante for both individuals and policy makers. However, individuals are likely to have private information about the probabilities of future outcomes that is not available to policy makers or researchers. Therefore, survey questions on individuals’ expectations may help researchers to disentangle actual uncertainty from heterogeneity between individuals and to predict actual careers.5
A structural approach seeks to identify heterogenous individual characteristics, beliefs, and expectations relevant for the phenomenon under analysis (van der Klaauw, 2012). Typically, surveys cannot collect all the details of all the relevant information. Because a key goal of this survey was to predict future careers, the approach taken was to ask individuals directly for their global assessment of the probability of future career states. This assumes that individuals used their knowledge of a great variety of aspects: their own characteristics and beliefs, their preferences including educational aspirations and occupational intentions, constraints such as earnings possibilities offered by the labor market, and information available about uncertain future events such as their probability of being admitted to particular programs and the likelihood of finishing or dropping out. Individuals’ expectations can thus be thought of as a composite index reflecting individuals’ evaluation of all aspects relevant for their future careers that they know of. In line with Manski (1999), we assume that ideal respondents “recognize that their behavior may depend on information they do not have when their expectations are
4 Descriptive statistics of the control variables are available in the supporting information online. Few
missing cases in the control variables have been imputed. Dummies indicating imputation were not significant in the models shown in the results section.
5 Researchers may also use expected probabilities as proxy for later outcomes; see Blass, Lach, and Manski
6
elicited. When asked for their choice expectations, they respond as coherently and honestly as possible given the information available.” (p. 51).
The classical approach to eliciting expectations for several alternatives is to ask for the most likely choice: the mode (e.g. Brown, Ortiz-Nuñez, & Taylor, 2011; van der Klaauw, 2012). Probabilistic questions overcome the limits of this stated-choice analysis by permitting respondents to express uncertainty about their future behavior (Manski, 2004; Delavande & Manski, 2015). If respondents choose one of four alternatives, that choice could represent certainty with 100 percent probability or uncertainty with probabilities in a range from 25 to 99 percent, values that indicate vastly different degrees of uncertainty.
Several studies have examined the predictive power of subjective numerical expectations for single events by directly comparing expectations and outcomes for the same individuals. Topics analyzed have included health outcomes (Huynh & Jung, 2015), survival (Hurd & McGarry, 2002; Khwaja, Sloan, & Chung, 2007; Bissonnette, Hurd, & Michaud, 2017), educational achievement (Kunz & Staub, 2016), unemployment and reemployment (Dickerson & Green, 2012), and beliefs about the probability of arrest on criminal behavior (Lochner, 2007). Hurd (2009) provides an overview.
These studies show that individuals’ numerical ex ante expectations have considerable predictive power for later events in situations where individuals have private information.6 However, many real-world settings do not involve a decision about a single
event but a polytomous choice between several possible options or outcomes. Eliciting choice probabilities for multiple options may be more problematic than for dichotomous choices, because such an approach increases the cognitive load on respondents. They have to divide probabilities between multiple options while ensuring that the probabilities sum to 100%.
This approach to predicting polytomous outcomes with numerical probabilities has almost exclusively been used in polling studies.7 Delavande and Manski (2012) analyze
voting probabilities for three candidates, for instance in the 2008 US presidential elections (McCain vs. Obama vs. someone else). De Bresser and van Soest (2019) elicited probabilities for nine voting alternatives in the 2017 Dutch parliamentary elections. They confront the predictions from these numerical probabilities with those from a random group of respondents that was only asked for their most likely vote. They show that
6 Of course, studies vary in their assessment of the usefulness of expectations data. For a critical view of
mortality expectations, see Elder (2013).
7 An exception is the recent working paper by Koşar, Ransom, and van der Klaauw (2020), who analyze
residential choices of US citizens and elicited counterfactual choice probabilities for three neighborhood alternatives. Pedersen, Mørkbak, and Scarpa (2020) elicited choice probabilities from medical students for two hypothetical alternative jobs but offered a third answering option: “indifferent”. Numerical probabilities have been used for few other purposes: Gong, Stinebrickner, and Stinebrickner (2019) elicited college major probabilities and used them to determine the amount of students’ earnings uncertainty that is due to uncertainty in major choice. Numerical probabilities have also been used to elicit densities over metric variables, such as inflation rate expectations (Armentier, Bruine de Bruin, Topa, van der Klaauw, & Zafar, 2015) or wage expectations (Dominitz & Manski, 1996; Schweri, Hartog, & Wolter, 2011).
7
subjective voting probabilities predict individual behavior better than deterministic statements. Yet, these favorable results for probabilistic questions may not generalize to settings other than polling, where the media routinely report party strengths using percentages. The evidence is thus still very limited on whether asking for probabilistic expectations in surveys is generally viable and useful for predicting future choices in polytomous choice settings.
2.3. Career expectations in the HCA survey
Inspired by the literature on eliciting numerical probabilities, the T2 online survey in 2012 asked HCAs the following question: “Please imagine your professional future in two years’ time: What will be your main activity on June 1, 2014? Please distribute a total of 100 percentage points among the five career alternatives below. The sum over the five alternatives has to be 100% (+/- rounding difference).”8 To respond to each alternative,
a slider could be moved from 0 to 100% in steps of 5%. The sliders effectively provided a horizontal bar graph for stating a probability distribution over the five alternatives. The sum of allocated percentages was shown in real-time as a reminder to support respondents.9
The five alternatives represented the most likely career options for the cohort of HCAs: (a) work as an HCA; (b) study or work in nursing; (c) obtain a vocational baccalaureate, which grants access to university of applied science (UAS) studies; (d) study, but not nursing; and (e) work in other occupations, or other options, such as military service and staying abroad. Since (c) the vocational baccalaureate is an option with low frequency in our setting10 that prepares for studies at UAS contained in (d), we
combine (c) and (d) into one category. Accordingly, the choice situation is described by four categories in the analyses: (1) work as HCA, (2) study or work as nurse, (3) types of study other than nursing, and (4) other options, which is the residual category. Career expectations are thus represented by a probability quadruplet {p1,p2,p3,p4} with ∑ 1
for every individual.
8 The question referred to 2014 because survey T3 was originally scheduled for 2014. In agreement with
the funding bodies, it was later postponed to 2016.
9 Some 87 out of 1,056 respondents wished to fill in a paper questionnaire instead of the online
questionnaire. The question was the same, but respondents had to write down numbers instead of moving sliders and thus could not see a real-time sum of the probabilities. We ran all estimations in section 3 including controls for questionnaire type. These were never significant and this variable was therefore dropped from the models shown.
10 The limited number of eight cases causes problems in the conditional logit models in section 3.4. The
two main reasons for the limited number of cases are: 1. There is an option to obtain a vocational baccalaureate during training, so these HCA do not attend vocational baccalaureate school after finishing training. 2. Vocational baccalaureate school lasts for one year, so those entering in 2012 or 2013 had already finished it by mid-2014.
8
3. Results
3.1. The quality of elicited expectations
Seeing the limited evidence on numerical expectations data for several career options, we start with an analysis of individuals’ response patterns to assess the quality of the data. In all, 1,056 individuals took part in the T2 survey, of whom 1,020 or 96.5 percent gave an answer to the expectations item. This means that almost all respondents were willing to answer a polytomous probability item. Some 715 or 70 percent of these gave answers that summed exactly to unity. Another 24.3 percent gave answers that summed to between .9 and 1.1, with the largest peaks at .95 and 1.05. These cases stem from rounding errors arising from the movement of the sliders in units of .05. We included these cases in the analyses and corrected the probabilities proportionally to achieve a sum of exactly unity. Thus, almost 95 percent of all given answers were valid.
In total, 962 of 1,056 (91 percent) of all respondents provided valid probabilistic expectations. Apparently, the basic principle of dividing probabilities between distinct and exhaustive alternatives was understood and accepted by a large majority of respondents.
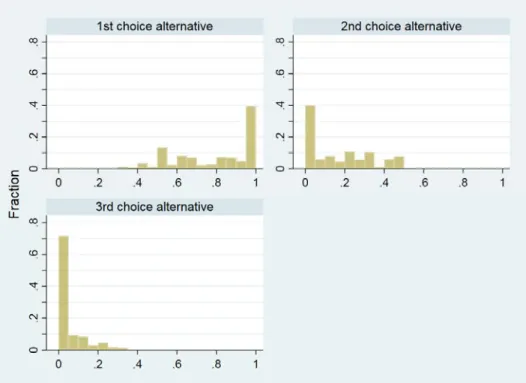
FIGURE 1 Probabilistic expectations stated in 2012 for career status in 2014, by alternatives (N = 962)
Figure 1 shows the distribution of stated probabilities by choice alternatives. The basic picture for all alternatives is that there are peaks at zero and a lot of values distributed over the whole probability span. The fact that the majority of the probabilities is closer to zero than to one is by construction, as the four probability means
9
have to sum to unity. These means are .171, .477, .192, and .159 for the alternatives as shown in figure 1.
The important fraction of respondents that reported a zero probability of being healthcare assistants may be striking, as this is the default category. Respondents had finished this education successfully one year before. However, a first wave of transitions has already taken place since graduation: 75.1 percent of those who had given a zero probability for the HCA option no longer worked as HCAs at the time of the interview in 2012. A stated probability of one is unusual for three of the alternatives, but not for nursing. This is because some respondents had already started nursing studies and obviously intended to continue this career.
We conclude that survey respondents were willing and able to give meaningful answers to the item eliciting expectations for several career alternatives. This finding is in line with other studies assessing the quality of probability data (e.g., Grewenig, Lergetporer, Werner, & Woessmann, 2019) and particularly with the findings of studies cited in section 2.2 on numerical probabilities in binary choice situations.
3.2. Individuals’ uncertainty
Figure 1 showed that many respondents stated probabilities between zero and one. We now investigate how many respondents stated positive probabilities for two, three or four alternatives, because these opportunities to express uncertainty about future outcomes is the main rationale for eliciting numerical probabilities for a polytomous choice situation.
10
Figure 2 presents alternatives for every person ranked by their stated probabilities.11
The figure depicts the probabilities given to the first, second, and third options. By construction, probabilities for the first option are defined on the interval [.25, 1], on [0, .5] for the second, and on [0, .33] for the third option.
Some 36.9 percent of the respondents gave a probability of one for their first, and thus only, choice alternative. Hence, only a minority expressed certainty about their future, which suggests that questions asking for the most likely option alone miss important information in many cases. A majority, 63.1 percent, of all respondents used the opportunity to distribute probabilities between at least two options, thus indicating uncertainty about their future career outcomes. The positive probability values for the alternative ranked second are spread rather evenly in the interval (0, .5]. Finally, 69.3 percent of all respondents did not state a positive probability for a third alternative, whereas 30.7 percent distributed probabilities over at least three alternatives. Some 11.8% even indicated positive probabilities for all four alternatives (not shown).
To characterize and analyze the uncertainty expressed by a person, we transform probability quadruplets into a scalar uncertainty measure that takes values between 0 (no uncertainty) to 1 (maximum uncertainty). This uncertainty coefficient is defined as a weighted sum of the probabilities of the ranked alternatives, giving more weight to the alternatives with lower rank:
0 ∗ ∗ ∗ 2 ∗
where u is the uncertainty coefficient, is the probability stated for the alternative in the first rank (i.e. the alternative with the highest probability of the four probabilities stated), the probability given to the alternative in the second rank, and so forth.
TABLE 1 Examples of expected probabilities and uncertainty coefficients Ranked probability quadruplet Uncertainty coefficient 1 0 0 0 0.000 .8 .2 0 0 0.133 .5 .5 0 0 0.333 .5 .3 .2 0 0.467 .5 .25 .25 0 0.500 .5 .2 .2 .1 0.600 .3 .3 .2 .2 0.867 .25 .25 .25 .25 1.000
11 In case of equal probabilities between two alternatives, we randomly assigned a higher and a lower rank
11
The idea behind this measure becomes obvious if we look at the two extreme cases: a person with a ranked probability quadruplet {1,0,0,0} expresses full certainty for one alternative and is assigned a u of 0. A person with a ranked probability quadruplet of {.25,.25,.25,.25} expresses maximum uncertainty and is assigned a u of 1. Table 1 gives further examples to illustrate the relationship between stated probabilities and the uncertainty measure.
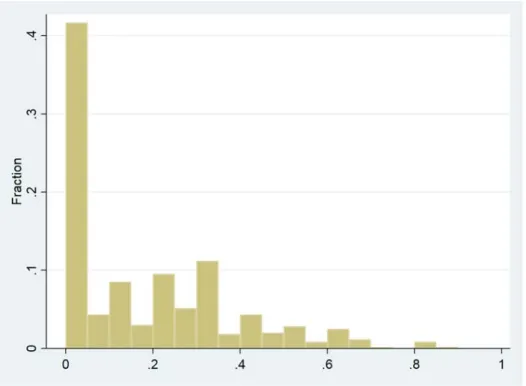
FIGURE 3 Uncertainty in stated probabilities (N = 962)
Figure 3 shows the distribution of the uncertainty coefficient for our sample of 962 respondents. The distribution shows a peak at zero12 and is skewed to the left, but the
uncertainty expressed by respondents is nonetheless considerable.
Next, we analyze whether stated probabilities and the amount of uncertainty are related to individuals’ characteristics. The regression models in these analyses need to take into account the particular nature of the dependent variables. The stated probabilities for four alternatives are polytomous fractions. Therefore, we analyze the conditional means of the four probabilities with the model developed in Mullahy (2015). He extends the regression model proposed by Papke and Wooldridge (1996) for a single fractional variable to multivariate fractions, assuming a multinomial logit functional form for the conditional means. This ensures that the conditional means lie between zero and one and sum to unity.
12 Note that all values below .05 are put together in the first bar of figure 3 due to the bin width of .05 on
12
Table 2 shows the results of this multivariate fractional regression: the first four columns show average marginal effects for the four career alternatives. As expected, career status in T2 is highly predictive of career expectations. HCAs below average age think that they are more likely to leave the occupation by 6.1 percentage points, whereas HCAs above average age more often expect to stay, as do those trained not in acute hospitals but in nursing homes or other institutions, mainly homecare. HCAs who have already earned a vocational baccalaureate or attended a preparatory course deem it much more likely that they will study at tertiary level, at the expense of working as HCAs or other options. Expectations of becoming a nurse are higher for respondents with high GPA at the HCA final exam and for respondents who particularly like patient contact. The GPA effect shows that nursing students are positively selected from the pool of HCAs, which is necessarily the case because GPA is an admission criterion for nursing studies. HCAs who want to work part time in the future think it much less likely that they will become nurses. Further notable results are that HCAs that are less risk averse in business matters expect to go on to tertiary studies other than nursing, that intrinsically motivated HCAs often expect to choose the “other” option, and that extrinsically motivated HCAs often expect not to work as HCAs but study nursing and other studies instead.
How does respondents’ uncertainty about their future careers relate to their characteristics? The uncertainty measure could also be regressed on explanatory variables with a fractional regression model. However, such a model does not take into account the large number of zeros, also known as excess zeros, visible in figure 3. Respondents who state absolute certainty could be a different type of person from those who acknowledge some degree of uncertainty. This would imply that the data process generating zeros in the uncertainty measure differed from the process generating positive values of uncertainty. This problem is taken into account by two-part models (Ramalho, Ramalho, & Murteira, 2011). Hence, we estimate a zero-inflated beta regression model, which is suited to the analysis of fractional variables and estimates the probability of value zero, the extensive margin, as a separate process.
The last two columns of table 2 show the results of the zero-inflated beta regression. The second-last column shows marginal effects at the extensive margin for the zero-one decision to express no uncertainty or some positive uncertainty. HCAs that have already entered nursing studies or another type of studies in T2 are much less likely to state uncertainty, as they are also on a specific career track. HCAs whose parents had at least five bookshelves at home are more uncertain, possibly because a wealthier and/or more stimulating family environment has encouraged them to consider a greater variety of career options. HCAs with lower time preferences express less uncertainty, as do HCAs who particularly like patient contact and those who were very satisfied with their HCA training. The reason for these findings can be deduced from the effects of the same
13
variables on career expectations in the first two columns of model 1: these HCAs are more likely to remain HCAs or become nurses but less likely to enter other studies or work in another occupation.
The last column in table 2 allows us to compare the effects of variables at the intensive margin of uncertainty with the effects at the extensive margin. In fact, almost all effects have the same sign, meaning that they work in the same direction for both margins. The two data generating processes do not seem to be fundamentally different. This also speaks in favor of interpreting zeros as expressing high certainty instead of as unwillingness to respond to a probabilistic item.
14
TABLE 2 Multivariate fractional logit and zero-inflated beta regression estimations (marginal effects) (1)
Expected probabilities (mflogit)
(2) Uncertainty (zib) Works as HCA Study/Work in nursing Study (other than nursing) Other option Uncertainty yes/no Uncertainty Ɛ (0,1) Career status in T2 (Ref. cat: Works as HCA): Study/work in -0.231*** 0.491*** -0.174*** -0.086*** -0.140*** -0.081*** nursing (0.015) (0.025) (0.018) (0.018) (0.038) (0.015) Study (other -0.135*** -0.046 0.176*** 0.005 -0.109** -0.046 than nursing) (0.027) (0.038) (0.040) (0.030) (0.051) (0.020) Other -0.007 0.013 -0.032 0.026 -0.051 -0.013 (0.036) (0.051) (0.036) (0.036) (0.062) (0.026) Age below 21 -0.061*** 0.040* 0.026 -0.006 -0.049 -0.013 (0.018) (0.023) (0.019) (0.017) (0.034) (0.013) Age 25+ 0.052** -0.021 -0.060 0.030 0.025 0.015 (0.025) (0.047) (0.047) (0.038) (0.081) (0.028) Woman 0.065* -0.021 -0.014 -0.030 0.038 0.057** (0.035) (0.056) (0.033) (0.040) (0.069) (0.028) Parents’ education 0.057* -0.060 0.006 -0.002 0.044 0.031 medium (0.030) (0.039) (0.030) (0.029) (0.055) (0.021) Parents’ education 0.046 -0.036 -0.008 -0.002 0.054 0.031 high (0.029) (0.036) (0.028) (0.027) (0.051) (0.020) 5+ bookshelves at 0.007 -0.002 -0.020 0.015 0.076** 0.028** parents’ home (0.016) (0.024) (0.019) (0.017) (0.035) (0.013) Lower track in 0.014 0.017 0.003 -0.035* -0.011 -0.002 lower secondary (0.016) (0.026) (0.021) (0.019) (0.038) (0.014) Voc. baccalaureate -0.076*** -0.022 0.161*** -0.063*** 0.024 -0.015 dur. HCA train. (0.022) (0.037) (0.034) (0.022) (0.049) (0.018) Pre-course for -0.089*** -0.030 0.090** 0.029 -0.009 0.000 voc. baccal. (0.023) (0.050) (0.045) (0.044) (0.069) (0.032) Host company: 0.039* -0.025 -0.047* 0.034 0.057 0.026 nursing home (0.021) (0.031) (0.025) (0.023) (0.045) (0.018) Host company: 0.048** -0.012 -0.040 0.004 0.035 0.017 other (0.022) (0.033) (0.028) (0.024) (0.048) (0.019)
GPA at final exam -0.040* 0.077** -0.036 -0.002 -0.039 -0.039* of HCA training (0.023) (0.038) (0.031) (0.028) (0.056) (0.022)
Time preference -0.009 0.031 -0.001 -0.020 -0.080** -0.019
low (0.015) (0.023) (0.019) (0.016) (0.034) (0.014)
Risk aversion (in -0.002 0.002 0.005 -0.005 0.000 -0.005
general) high (0.004) (0.006) (0.005) (0.005) (0.009) (0.003)
Risk aversion (in 0.009*** 0.008 -0.012*** -0.006 -0.005 0.003 business) high (0.004) (0.005) (0.004) (0.004) (0.008) (0.003) Intrinsic motiv. -0.016 -0.044* 0.017 0.043*** 0.035 0.003 high (0.016) (0.023) (0.019) (0.016) (0.034) (0.013) Extrinsic motiv. -0.032** 0.017 0.031* -0.016 -0.003 -0.012 high (0.016) (0.022) (0.018) (0.016) (0.033) (0.013) Likes patient 0.017 0.075*** -0.026 -0.066*** -0.086** -0.033** contact (0.016) (0.022) (0.018) (0.016) (0.034) (0.013) Satisfaction with 0.014* 0.023* -0.019* -0.018** -0.040** -0.013* HCA training (0.009) (0.012) (0.010) (0.009) (0.019) (0.007) Intention to work 0.012 -0.065*** 0.007 0.046*** 0.063* 0.020 part time (50-80) (0.015) (0.021) (0.017) (0.016) (0.033) (0.013) Intention to work 0.025 -0.132** 0.058 0.049 0.144 0.011 part time (-50%) (0.047) (0.058) (0.039) (0.033) (0.089) (0.031) N 962 962 Log pseudolikelih. -943.7 -319.1
15
Notes: Model (1) is a multivariate fractional logit model with numerical career expectations for 2014 stated in 2012 as dependent variable. Model (2) is a zero-inflated beta regression with the uncertainty measure explained in the main text as dependent variable. All estimates shown are average marginal effects. The models have been estimated with STATA commands fmlogit and zoib (Buis, 2010). Explanatory variables in both models (see section 2.1): career status in 2012, personal characteristics (age, sex, migrant, child, parental education, books at home), institutional characteristics (school tracks, training firm type, canton dummies, etc.), and cognitive and noncognitive skills (GPA at HCA final exam, time preference, risk aversion, motivations, self-efficacy, satisfaction with HCA training, etc.). Full results are in supporting information online. Standard errors are in parentheses, and asterisks indicate significance levels (* p < .1, ** p < .05, *** p < .01).
3.3. Career status and mobility
To compare career expectations and actual careers, we make use of the 600 respondents (out of the 962 that we have analyzed so far), who answered not only in survey T2 but also in T3 four years after T2. If sample attrition between T2 and T3 is nonrandom, it might bias the analyses. This concern will be addressed in section 3.4.
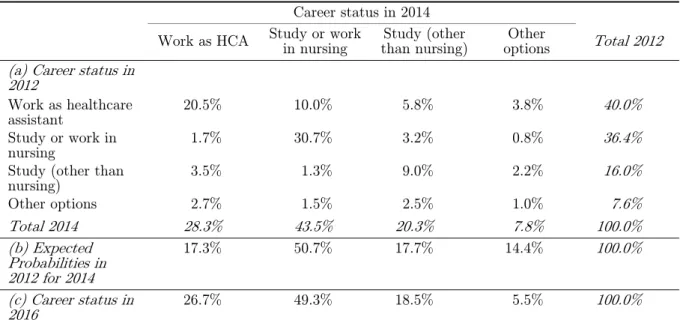
Table 3 presents the career status of our sample of HCAs in the two survey waves. While about 60% of the respondents have the same career status in both survey waves, about 40% have changed status between 2012 and 2014. This shows that individuals are in a transition phase with considerable mobility. We analyze this mobility in the multivariate models in section 3.4 by conditioning on the status in 2012.
The second-last row of table 3 shows the mean of probabilities expected for 2014 and stated in 2012. Comparison with actual careers in 2014 shows that HCAs’ expectations correctly predict that the proportion of people working as HCAs will drop and the proportion of nursing students and working nurses will increase. However, individuals overestimate both trends, such that the prediction means are not close to the actual shares in 2014. In the last row, we show actual proportions for 2016. Now the proportions for nurses and for other studies are very close to the expected proportions, while HCA still overpredict a move away from working as HCA to other alternatives, likely mainly work in other occupations.
A possible explanation for the seemingly better fit of expectations with outcomes in four instead of two years’ time could be that individuals are not good at accounting for the duration of changes. This explanation is in line with Loomes and Mehta (2007), who found that individuals were insensitive to the temporal scope of events when eliciting expectations for events with randomly varying time periods. In section 3.4, we analyze whether numerical probabilities help to predict future career status in regression models with additional controls.
16
TABLE 3 Career status in 2012, 2014, and 2016, and expectations in 2012 (N = 600) Career status in 2014
Work as HCA Study or work in nursing than nursing)Study (other options Other Total 2012 (a) Career status in
2012 Work as healthcare assistant 20.5% 10.0% 5.8% 3.8% 40.0% Study or work in nursing 1.7% 30.7% 3.2% 0.8% 36.4%
Study (other than nursing) 3.5% 1.3% 9.0% 2.2% 16.0% Other options 2.7% 1.5% 2.5% 1.0% 7.6% Total 2014 28.3% 43.5% 20.3% 7.8% 100.0% (b) Expected Probabilities in 2012 for 2014 17.3% 50.7% 17.7% 14.4% 100.0% (c) Career status in 2016 26.7% 49.3% 18.5% 5.5% 100.0%
Notes: Career status in 2012 and expectations are from survey T2, career status in 2014 and 2016 from survey T3. The upper panel of the table shows cell percentages and respective column and row totals.
3.4. Predicting career status with expectations
Using numerical probabilities
To assess the predictive value of numerical career expectations stated in 2012 for actual career outcomes in 2014, we use a conditional logit model, which allows alternative-specific explanatory variables (McFadden, 1974; Wooldridge, 2010). These variables include both individuals’ expectations about their future status, which is our primary variable of interest, and their actual status at the time of the interview. Estimation models also include case-specific controls for personal characteristics, cognitive and noncognitive skills, and information on education pathways and HCA training.
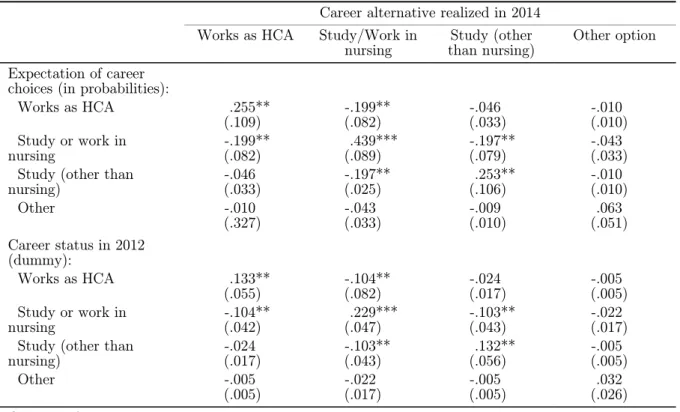
Table 4 presents marginal effects at the mean for the four career alternatives, which depend on the mean shares of these alternatives in the sample and on the values of the covariates (a description of all variables and full results can be found in the supporting information online). All effects of the subjective probabilities go in the expected direction, and many are sizeable and significant. For example, a 1 percentage-point increase in the expectation of studying or working as a nurse stated in 2012 is associated with a .44 percentage-points higher likelihood of actually studying nursing or working as nurse in 2014. A test of the joint significance of the expected probabilities is highly significant as well (p < .000).
We conclude that numerical subjective expectations are predictive of future career status, even when controlling for many case-specific variables. Note that prediction does not entail causality in our case. We could not use the estimates in table 2 to gauge the effect of an exogenous change in the likelihood of some alternatives, for instance due to
17
a change in admission rules for tertiary studies. This is because our expectations include information on preferences and on individuals’ future actions (see section 2.2), including behavioral responses to changes in exogenous probabilities (see van der Klaauw, 2012, for a discussion of the endogeneity of elicited expectations).
TABLE 4 Alternative-specific conditional logit (marginal effects)
Career alternative realized in 2014 Works as HCA Study/Work in
nursing
Study (other than nursing)
Other option Expectation of career
choices (in probabilities): Works as HCA
Study or work in nursing
Study (other than nursing) Other .255** (.109) -.199** (.082) -.046 (.033) -.010 (.327) -.199** (.082) .439*** (.089) -.197** (.025) -.043 (.033) -.046 (.033) -.197** (.079) .253** (.106) -.009 (.010) -.010 (.010) -.043 (.033) -.010 (.010) .063 (.051) Career status in 2012 (dummy): Works as HCA Study or work in nursing
Study (other than nursing) Other .133** (.055) -.104** (.042) -.024 (.017) -.005 (.005) -.104** (.082) .229*** (.047) -.103** (.043) -.022 (.017) -.024 (.017) -.103** (.043) .132** (.056) -.005 (.005) -.005 (.005) -.022 (.017) -.005 (.005) .032 (.026) Case-specific control variables: Personal characteristics Institutional charactist. Cogn. & noncogn. skills
Yes Yes Yes
N 2400 observations, 600 cases
Log pseudolikelihood -415.4
Notes: Dependent variable: career status in 2014. Estimates shown: a. marginal effects at the mean for the variable Expectations (stated numerical probabilities ranging from 0 to 1); b. effect of a discrete change from 0 to 1 for the variable Career status in 2012. Control variables (see section 2.1): personal characteristics (age, sex, migrant, child, parental education, books at home), institutional characteristics (school tracks, training firm type, canton dummies, etc.), and cognitive and noncognitive skills (GPA at HCA final exam, time preference, risk aversion, motivations, self-efficacy, satisfaction with HCA training, etc.). Full results are in supporting information online. Standard errors (in parentheses) are robust and corrected for clustering of respondents, and asterisks indicate significance levels (* p < .1, ** p < .05, *** p < .01).
Numerical vs. modal vs. ranked expectations
To assess the added value of probabilistic questions, we look more closely into the components of the information contained in elicited expectations. Table 5 shows goodness-of-fit statistics for model comparisons. Baseline model 0 contains status in 2012 and all other control variables, but no career expectations. In contrast, model 1 contains
18
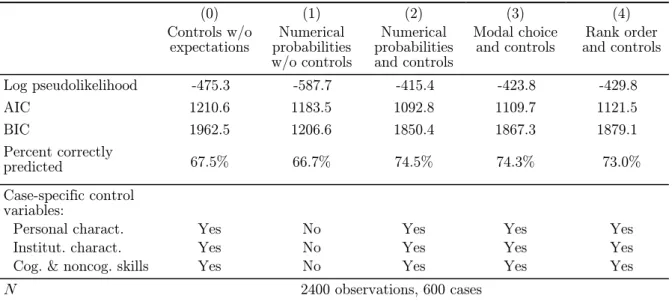
only career expectations as numerical probabilities, without any controls. Subjective probabilities in model 1 predict cases correctly almost as often as all controls together in model 0. Model 2 unites all of these variables: it is identical to the model shown in table 4 above. This model clearly scores better on the various measures than the models containing fewer variables.13
The predictive value of numerical career expectations in model 2 may stem purely from the arguably most important information in these probabilities, that of the most likely choice. As described in the introduction, extant literature typically asked for the most likely alternative and not for numerical probabilities. For instance, van der Klaauw (2012) modeled teacher career choice using expectations of high school graduates. In that study, respondents had to circle one option from several kinds of work that came closest to what they expected to be doing at age 30. Therefore, we want to check whether the information in our numerical probabilities can be reduced to identifying the most likely alternative without losing predictive power.
We follow the idea in de Bresser and van Soest (2019) of discretizing numerical probabilities. Model 3 in table 5 contains the same variables as model 2; the only difference is that the career expectations enter as a dummy variable that indicates the most likely alternative. Thus, it thus does not contain metric probability information anymore. The dummy variable is highly significant, but the Akaike and Bayesian information criteria (AIC and BIC) show that valuable information was lost compared to model 2 with numerical probabilities.14 This suggests that, in our setting, eliciting
numerical probabilities is superior to asking for the most likely alternative. However, this conclusion is only valid if we assume that respondents state the highest probability for the alternative that they would also choose if asked to select one most likely alternative. Indeed, authors who use the “most likely” format often assume that the chosen alternative is the mode of the underlying probability distribution (e.g., van der Klaauw, 2012). Likewise, we have to assume that the mode of the elicited numercial probabilities is identical with the mode of the respondents’ actual underlying expectations. De Bresser and van Soest (2019) randomly allocated both question formats in their survey on election polls and conclude that answers to deterministic questions and discretized information from polytomous answers have the same predictive power, which is smaller than that of the polytomous numerical answers.
If probabilities contain information beyond the most likely alternative, it may be that the additional information for prediction stems from the rank order between several alternatives, whereas the metric probability distances between alternatives are not
13 The sole exception is the favorable BIC score for model 1. As the BIC penalizes the number of explanatory
variables very strongly compared to the AIC, it prefers a model with almost no variables. The BIC is better suited to comparing models that diverge by one or few variables: models 0, 2, 3, and 4.
14 This is confirmed if we add the missing information as an alternative-specific regressor (the mode dummy
minus the numerical probability for every alternative) in model 3, this variable significantly predicts outcomes.
19
informative. In this case, surveys could ask respondents to rank alternatives according to their likelihood without bothering to elicit exact probabilities that have to sum to unity. Hence, model 4 contains the rank order of the alternatives as given by respondents’ probabilities.15 This model clearly underperforms model 2, which uses numerical
probabilities. Our results show that numerical probabilities contain valuable predictive information beyond information about the mode and rank of the alternatives.
TABLE 5 Alternative-specific conditional logits: model comparisons (0) Controls w/o expectations (1) Numerical probabilities w/o controls (2) Numerical probabilities and controls (3) Modal choice and controls (4) Rank order and controls Log pseudolikelihood -475.3 -587.7 -415.4 -423.8 -429.8 AIC 1210.6 1183.5 1092.8 1109.7 1121.5 BIC 1962.5 1206.6 1850.4 1867.3 1879.1 Percent correctly predicted 67.5% 66.7% 74.5% 74.3% 73.0% Case-specific control variables: Personal charact. Institut. charact. Cog. & noncog. skills
Yes Yes Yes No No No Yes Yes Yes Yes Yes Yes Yes Yes Yes N 2400 observations, 600 cases
Notes: Dependent variable: career status in 2014. Case-specific control variables (see section 2.1): personal characteristics (age, sex, migrant, child, parental education, books at home), institutional characteristics (school tracks, training firm type, canton dummies, etc.), and cognitive and noncognitive skills (GPA at HCA final exam, time preference, risk aversion, motivations, self-efficacy, satisfaction with HCA training, etc.). Full results are in supporting information online.
A final model comparison sheds light on expected and actual mobility patterns of HCAs. If we assume that the expectations data were generated by the same model governing outcomes (see van der Klaauw, 2012), control variables should have similar effects on career expectations and outcomes.16 Comparisons of the direction and
significance of the marginal effects can be performed between the regression models with expectations, with career status in 2014 and 2016 as dependent variables. However, because the estimation models for expectations and status differ, we do not compare the effects in a formal test.17 For space reasons, these models are shown in the supporting
information online.
15 If two alternatives had the same probability, we defined rank order randomly between these alternatives,
as surveys would typically force respondents to state different ranks for every alternative.
16 We may thus compare model 0 from table 5 either with model 1 presented in table 2, re-estimated with
the same sample of 600 respondents, or with a corresponding model using status in 2016 instead of 2014 as dependent variable, since career status in 2016 seemed more relevant in section 3.3. All three models are shown in the supporting information online (table S.6).
17 In the multivariate fractional regression model, marginal effects are on the expected value of the
fractional response (i.e., the stated probabilities), whereas in the conditional logit model, marginal effects are on the conditional probability of categorical responses.
20
The effects of many of the controls on the transition to nursing are similar for expectations and outcomes, particularly for outcomes in 2016. The positive effects of young age, GPA, and liking patient contact on expectations for nursing (see model 1 in table 2) are confirmed for actually being a nurse in 2016. In contrast to expectations, the intention to work part time no longer prevents HCAs from becoming nurses by 2016, and extrinsic motivation increases the likelihood of becoming a nurse. However, having parents with medium or high education decreases the likelihood of becoming a nurse, an unanticipated effect. Finally, an HCA’s professional commitment and self-efficacy at work tasks reduce the likelihood of the residual “other” alternative occurring, which respondents had not anticipated in expectations. This suggests that, compared to their initial expectations, more HCAs who already liked working as HCAs continued to do so instead of going to work in other occupations.
Panel attrition
Results on career outcomes in sections 3.3 and 3.4 have ignored sample attrition between the two surveys T2 and T3. If dropping out of the panel is correlated with expectations and career choices, our results may be biased. Therefore, we use a Heckman (1979) selection model to check for nonrandom attrition. The baseline model is a linear probability model (LPM) with a career in nursing as dependent dummy variable, and the expected probability of the nursing alternative as independent variable, plus controls. The coefficients in this model are very similar to the results in table 4 for the nursing career alternative.
We then compare the baseline LPM results to results from a selection model that accounts for individuals that answered in T2 but not in T3. In this estimation, we need a variable that shifts the probability of answering in survey T3 but does not affect the probability of choosing nursing. This variable, “contact”, indicates whether respondents were willing to give us their full name in the first survey, which we asked for with the purpose of re-contacting them. Respondents were not obliged to do so. Those who did not give their name were indeed less likely to answer in T3.18 It seems unlikely that the
propensity to state one’s name for a follow-up survey directly affects future career choices. The estimations included the contact variable in the selection equation but not in the nursing choice equation (exclusion restriction). Estimations result are accessible as Table S.7 in the supporting information online and show that the contact variable is significant for the probability to answer in T3. Yet, the inverse Mills ratio is not significant, which means that we cannot reject the null hypothesis that the error terms in the selection equation and in the nursing choice equation are uncorrelated. This speaks
18 We used the email address initially recorded to recontact individuals. Many of these addresses were no
longer valid four years later and did not provide full name information. In these cases, we were not able to find new contact information.
21
against selective attrition in our sample. Accordingly, the coefficient estimates in the nursing choice equation are similar to those in the LPM model. In particular, the expected probability of the nursing alternative strongly predicts the actual outcome.
4. Concluding discussion
This paper analyzes the career paths of apprentices after their healthcare assistant training, who are the main recruiting pool for nursing studies in Switzerland. We use the career expectations of HCAs to predict their future career paths into nursing or alternatives. Career expectations were elicited in an online survey as numerical probabilities for five alternatives two years ahead. The expectations item was answered correctly and meaningfully by a large majority of the respondents. More than 60 percent of the respondents expressed substantial uncertainty about their future career by giving positive probabilities to more than one career alternative.
Respondents correctly predicted the mean probability of becoming nurses and of starting other studies. However, expectations predict these outcomes correctly for 2016, not 2014, the year for which expectations had been elicited. This confirms findings in the literature that respondents have difficulties accounting for time frames when stating probabilities (Loomes & Mehta, 2007). Respondents also overstated their probability of leaving HCA work in favor of “other”, the residual category that includes working in other occupations and not working or studying. In the end, this is good news for the healthcare system, as it means that these HCAs remain part of its workforce.
The predictive power of numerical probabilities is substantial even when controlling for personal and institutional characteristics. Individuals thus hold private information about their future choices, especially on their choice of going to nursing college, beyond the information typically observed by researchers or policy makers. We also analyze whether the information in numerical probabilities can be reduced to information about the most likely outcome or the expected rank order of career alternatives. In line with de Bresser & van Soest’s (2019) results comparing probabilistic survey questions with questions on the most likely choice in the very different setting of polling analysis, the full distribution of numerical probabilities provides the most accurate prediction.
In sum, the quality of the numerical expectation data and its predictive value suggest that eliciting choice probabilities for polytomous choice situations is a viable and useful approach in online surveys, at least for outcomes of (partly) personal decisions such as career pathways.
Three main lessons emerge concerning the authorities’ declared aim of recruiting a high number of HCAs for nursing studies. Firstly, HCAs express considerable uncertainty even after successfully finishing their HCA training. While an extended period of job
22
search may be necessary to find optimal matches between individuals and careers, their uncertainty also indicates an important role for career advice during HCA training and afterwards. Such advice aims to help individuals find their way in a complex modern healthcare system with a multitude of jobs, grades, and careers.
Secondly, HCAs correctly expect that a higher GPA, younger age, and liking patient contact increase chances to become a nurse. However, they erroneously expect that working part time will keep them from nursing, and they do not anticipate that those with greater extrinsic motivation are more likely to become nurses and that those with parents with medium or higher education are less likely. These findings suggest that more information, in particular on childcare availability, earnings, and promotion opportunities in nursing could increase interest in the profession at an earlier stage, possibly speeding transitions. Of course, such information will only have the intended effects if these features of nursing jobs are and remain attractive relative to remaining a HCA or to choosing other studies.
Thirdly, HCAs correctly anticipate that they are less likely to become nurses if they trained in nursing homes or homecare than in acute hospitals. A likely explanation is that nursing homes and homecare institutions train and employ far fewer nurses than hospitals, a fact that authorities could change by tightening minimum staffing requirements. In addition, HCA training curricula should ensure that learners are acquainted with all aspects of healthcare beyond those of the institution in which they train.
23
References
Antonazzo, E., Scott, A., Skatun, D., & Elliott, R. F. (2003). The labour market for nursing: A review of the labour supply literature. Health Economics, 12(6), 465—478. https://doi.org/10.1002/hec.737
Armentier, O., Bruine de Bruin, W., Topa, G., van der Klaauw, W., & Zafar, B. (2015). Inflation expectations and behavior: do survey respondents act on their beliefs?
International Economic Review, 56(2), 505—536.
Bell, M. A., Dake, J. A., Price, J. H., Jordan, T. R., & Rega, P. (2014). A National survey of emergency nurses and avian influenza threat. Journal of Emergency Nursing, 40(3), 212—217. https://doi.org/10.1016/j.jen.2012.05.005
Bissonnette, L., Hurd, M. D., & Michaud, P. C. (2017). Individual survival curves comparing subjective and observed mortality risks. Health Economics, 26(12), e285—e303. https://doi.org/10.1002/hec.3506
Blass, A. A., Lach, S., & Manski, C. F. (2010). Using elicited choice probabilities to estimate random utility models: Preferences for electricity reliability. International Economic Review, 51(2), 421—440.
https://doi.org/10.1111/j.1468-2354.2010.00586.x
Brook, J., Aitken, L., Webb, R., MacLaren, J., & Salmon, D. (2019). Characteristics of successful interventions to reduce turnover and increase retention of early career nurses: A systematic review. International Journal of Nursing Studies, 91, 47—59. https://doi.org/10.1016/j.ijnurstu.2018.11.003
Brown, S., Ortiz-Nuñez, A., & Taylor, K. (2011). What will I be when I grow up? An analysis of childhood expectations and career outcomes. Economics of Education Review, 30(3), 493—506. https://doi.org/10.1016/j.econedurev.2010.12.003
Buis, M. L. (2010). Analyzing proportions. Presentation at the German Stata User Group Meeting 2010. Berlin.
de Bresser, J., & van Soest, A. (2019). The predictive power of subjective probabilities: probabilistic and deterministic polling in the Dutch 2017 election. Journal of the Royal Statistical Society, 182(2), 443—466. https://doi.org/10.1111/rssa.12409 Delavande, A., & Manski, C. F. (2012). Candidate preferences and expectations of
election outcomes. Proceedings of the National Academy of Sciences, 109(10), 3711—3715. https://doi.org/10.1073/pnas.1200861109
Delavande, A., & Manski, C. F. (2015). Using elicited choice probabilities in hypothetical elections to study decisions to vote. Electoral Studies, 38, 28—37. https://doi.org/10.1016/j.electstud.2015.01.006
Dickerson, A., & Green, F. (2012). Fears and realisations of employment insecurity.
24
Dominitz, J., & Manski, C. F. (1996). Eliciting Student Expectations of the Returns to Schooling. Journal of Human Resources, 31(1), 1—26.
https://doi.org/10.2307/146041
Eberth, B., Elliott, R. F., & Skåtun, D. (2016). Pay or conditions? The role of workplace characteristics in nurses’ labor supply. European Journal of Health Economics,
17(6), 771—785. https://doi.org/10.1007/s10198-015-0733-6
Elder, T. E. (2013). The Predictive Validity of Subjective Mortality Expectations: Evidence From the Health and Retirement Study. Demography, 50(2), 569—589. https://doi.org/10.1007/s13524-012-0164-2
Gong, Y., Stinebrickner, T., & Stinebrickner, R. (2019). Uncertainty about future income: Initial beliefs and resolution during college. Quantitative Economics, 10(2), 607—641. https://doi.org/10.3982/qe954
Grewenig, E., Lergetporer, P., Werner, K., & Woessmann, L. (2019). Incentives, Search Engines, and the Elicitation of Subjective Beliefs: Evidence from Representative Online Survey Experiments. In IZA Discussion Paper.
Grønning, M., & Trede, I. (2019). Does It Matter Where They Train? Transitions into Higher Education After VET and the Role of Labour Market Segments. Social Inclusion, 7(3), 65—78. https://doi.org/10.17645/si.v7i3.2043
Hammad, K. S., Arbon, P., Gebbie, K., & Hutton, A. (2012). Nursing in the emergency department (ED) during a disaster: A review of the current literature. Australasian Emergency Nursing Journal, 15(4), 235—244.
https://doi.org/10.1016/j.aenj.2012.10.005
Hanel, B., Kalb, G., & Scott, A. (2014). Nurses’ labour supply elasticities: The importance of accounting for extensive margins. Journal of Health Economics, 33, 94—112. https://doi.org/10.1016/j.jhealeco.2013.11.001
Heckman, J. J. (1979). Sample Selection Bias as a Specification Error. Econometrica,
47(1), 153—162.
Hurd, M. D. (2009). Subjective Probabilities in Household Surveys. Annual Review of Economics, 1(1), 543—562.
https://doi.org/10.1146/annurev.economics.050708.142955
Hurd, M. D., & McGarry, K. (2002). The Predictive Validity of Subjective Probabilities of Survival. Economic Journal, 112(482), 966—985.
https://doi.org/10.1111/1468-0297.00065
Huynh, K. P., & Jung, J. (2015). Subjective health expectations. Journal of Policy Modeling, 37(4), 693—711. https://doi.org/10.1016/j.jpolmod.2015.04.001
Khwaja, A., Sloan, F., & Chung, S. (2007). The relationship between individual expectations and behaviors: Mortality expectations and smoking decisions. Journal of Risk and Uncertainty, 35(2), 179—201.
25
https://doi.org/10.1007/s11166-007-9019-4
Koşar, G., Ransom, T., & van der Klaauw, W. (2020). Understanding Migration Aversion Using Elicited Counterfactual Choice Probabilities. In CESifo Working Papers. https://doi.org/10.2139/ssrn.3368408
Kunz, J., & Staub, K. E. (2016). Subjective Completion Beliefs and the Demand for Post-Secondary Education. In University of Zurich Working Paper Series. https://doi.org/10.2139/ssrn.2736955
Lin, H. (2014). Revisiting the relationship between nurse staffing and quality of care in nursing homes: An instrumental variables approach. Journal of Health Economics,
37(1), 13—24. https://doi.org/10.1016/j.jhealeco.2014.04.007
Lochner, L. (2007). Individual perceptions of the criminal justice system. American Economic Review, 97(1), 444—460. https://doi.org/10.1257/aer.97.1.444
Loomes, G., & Mehta, J. (2007). The sensitivity of subjective probability to time and elicitation method. Journal of Risk and Uncertainty, 34(3), 201—216. https://doi.org/10.1007/s11166-007-9012-y
Manski, C. F. (1999). Analysis of Choice Expectations in Incomplete Scenarios. Journal of Risk and Uncertainty, 19(1—3), 49—66.
https://doi.org/10.1007/978-94-017-1406-8˙3
Manski, C. F. (2004). Measuring expectations. Econometrica, 72(5), 1329—1376. https://doi.org/10.1111/j.1468-0262.2004.00537.x
Manski, C. F. (2018). Reasonable patient care under uncertainty. Health Economics,
27(10), 1397—1421. https://doi.org/10.1002/hec.3803
McFadden, D. (1974). The measurement of urban travel demand. Journal of Public Economics, 3(4), 303—328. https://doi.org/10.1016/0047-2727(74)90003-6
McHugh, M. D. (2010). Health Policy: Hospital Nurse Staffing and Public Health Emergency Preparedness: Implications for Policy. Public Health Nursing, 27(5), 442—449. https://doi.org/10.1111/j.1525-1446.2010.00877.x
Merçay, C., Burla, L., & Widmer, M. (2016). Gesundheitspersonal in der Schweiz. Bestandesaufnahme und Prognosen bis 2030. Neuchâtel: Swiss Health Observatory OBSAN.
Mora, T., & Lopez-Valcarcel, B. G. (2018). Breakfast choice: An experiment combining a nutritional training workshop targeting adolescents and the promotion of unhealthy products. Health Economics, 27(2), 306—319.
https://doi.org/10.1002/hec.3549
Mullahy, J. (2015). Multivariate Fractional Regression Estimation of Econometric Share Models. Journal of Econometric Methods, 4(1), 74—100.
https://doi.org/10.1515/jem-2012-0006
26
Economics, 20(4), 816—847. https://doi.org/10.1086/342039
Nicholson, S., & Propper, C. (2011). Medical Workforce. In Handbook of Health Economics (Vol. 2, pp. 873—925). https://doi.org/10.1016/B978-0-444-53592-4.00014-1
Papke, L. E., & Wooldridge, J. M. (1996). Econometric methods for fractional response variables with an application to 401 (k) plan participation rates. Journal of Applied Econometrics, 11(6), 619—632. https://doi.org/10.1002/(SICI)1099-1255(199611)11:6¡619::AID-JAE418¿3.0.CO;2-1
Pedersen, L. B., Mørkbak, M. R., & Scarpa, R. (2020). Handling resolvable uncertainty from incomplete scenarios in future doctors’ job choice — Probabilities vs discrete choices. Journal of Choice Modelling, 34, 100199.
https://doi.org/10.1016/j.jocm.2019.100199
Ramalho, E. A., Ramalho, J. J. S., & Murteira, J. M. R. (2011). Alternative estimating and testing empirical strategies for fractional regression models. Journal of Economic Surveys, 25(1), 19—68. https://doi.org/10.1111/j.1467-6419.2009.00602.x
Schweri, J., & Hartog, J. (2017). Do wage expectations predict college enrollment? Evidence from healthcare. Journal of Economic Behavior and Organization, 141, 135—150. https://doi.org/10.1016/j.jebo.2017.06.010
Schweri, J., Hartog, J., & Wolter, S. C. (2011). Do students expect compensation for wage risk? Economics of Education Review, 30(2), 215—227. https://doi.org/10.1016/j.econedurev.2010.12.001
Shields, M. A. (2004). Addressing nurse shortages: What can policy makers learn from the econometric evidence on nurse labour supply? Economic Journal, 114(499), F464—F498. https://doi.org/10.1111/j.1468-0297.2004.00255.x
Tong, P. K. (2011). The effects of California minimum nurse staffing laws on nurse labor and patient mortality in skilled nursing facilities. Health Economics, 20(7), 802—816. https://doi.org/10.1002/hec.1638
van der Klaauw, W. (2012). On the use of expectations data in estimating structural dynamic choice models. Journal of Labor Economics, 30(3), 521—554. https://doi.org/10.1086/664929
Wooldridge, J. M. W. (2010). Econometric Analysis of Cross Section and Panel Data. MIT Press.