Benefits of mercury controls for the United States
The MIT Faculty has made this article openly available.
Please share
how this access benefits you. Your story matters.
Citation
Giang, Amanda, and Noelle E. Selin. “Benefits of Mercury Controls
for the United States.” Proceedings of the National Academy of
Sciences 113.2 (2016): 286–291. © 2016 National Academy of
Sciences
As Published
http://dx.doi.org/10.1073/pnas.1514395113
Publisher
National Academy of Sciences (U.S.)
Version
Final published version
Citable link
http://hdl.handle.net/1721.1/106606
Terms of Use
Article is made available in accordance with the publisher's
policy and may be subject to US copyright law. Please refer to the
publisher's site for terms of use.
Benefits of mercury controls for the United States
Amanda Gianga,1and Noelle E. Selina,baInstitute for Data, Systems, and Society, Massachusetts Institute of Technology, Cambridge, MA 02139; andbDepartment of Earth, Atmospheric, and Planetary Sciences, Massachusetts Institute of Technology, Cambridge, MA 02139
Edited by Catherine L. Kling, Iowa State University, Ames, IA, and approved November 18, 2015 (received for review July 21, 2015) Mercury pollution poses risks for both human and ecosystem
health. As a consequence, controlling mercury pollution has become a policy goal on both global and national scales. We developed an assessment method linking global-scale atmospheric chemical trans-port modeling to regional-scale economic modeling to consistently evaluate the potential benefits to the United States of global (UN Minamata Convention on Mercury) and domestic [Mercury and Air Toxics Standards (MATS)] policies, framed as economic gains from avoiding mercury-related adverse health endpoints. This method attempts to trace the policies-to-impacts path while taking into account uncertainties and knowledge gaps with policy-appropriate bounding assumptions. We project that cumulative lifetime benefits from the Minamata Convention for individuals affected by 2050 are $339 billion (2005 USD), with a range from $1.4 billion to $575 billion in our sensitivity scenarios. Cumulative economy-wide benefits to the United States, realized by 2050, are $104 billion, with a range from $6 million to $171 billion. Projected Minamata benefits are more than twice those projected from the domestic policy. This relative benefit is robust to several uncertainties and variabilities, with the ratio of benefits (Minamata/MATS) ranging from≈1.4 to 3. However, we find that for those consuming locally caught freshwa-ter fish from the United States, rather than marine and estuarine fish from the global market, benefits are larger from US than global action, suggesting domestic policies are important for protecting these populations. Per megagram of prevented emissions, our do-mestic policy scenario results in US benefits about an order of mag-nitude higher than from our global scenario, further highlighting the importance of domestic action.
mercury
|
policy|
impacts assessment|
Minamata Convention|
economic benefitsT
oxic contamination from human activities is a global prob-lem. Although some countries have regulated toxic sub-stances such as heavy metals and persistent organic pollutants for several decades, chemical contamination has still been identified as a key planetary boundary at risk for exceedance in the context of global change (1). To address this challenge, existing global environmental treaties try to manage the entire life cycle of chemical contaminants (2). The newest of these is a global treaty on mercury, the Minamata Convention. In November 2013, the United States became the first country to fulfill the requirements necessary to become a party to the convention.In the United States, analyses to support domestic environ-mental decision-making include socioeconomic valuations of impacts as part of the regulatory process. However, these eval-uations can be both scientifically challenging and politically contentious, particularly given uncertainties and knowledge gaps (as noted in arguments in a recent case heard in the US Supreme Court, Michigan v. Environmental Protection Agency, 2015, addressing analysis of the costs and benefits of mercury regula-tion). These challenges are especially difficult for contaminants such as mercury, which cross temporal and spatial scales and have both domestic and global sources. The chain of analysis from policies, through emissions, to impacts involves a complex pathway, which for mercury includes industrial activities, atmo-spheric chemistry, deposition processes, bioaccumulation, and human exposure. Existing approaches have not fully combined information and knowledge from these disparate fields, and
substantial gaps exist in scientific understanding of the processes that mercury undergoes through long-range transport. Thus, it has historically been difficult to quantitatively estimate pro-spective domestic benefits from global environmental treaty-making in ways that can be compared with socioeconomic analyses designed to support domestic environmental decision-making. Here, we use an assessment approach that enables tracing this pathway, accounting for best-available scientific un-derstanding and addressing uncertainties and knowledge gaps with policy-appropriate assumptions.
Mercury is a naturally occurring element, but human activities such as mining and coal combustion have mobilized additional amounts, enhancing the amount of mercury circulating in the atmosphere and surface oceans by a factor of three or more (3, 4). Mercury previously deposited to land and water can revolatilize over decades to centuries. Thus, human activities have fundamentally altered the global biogeochemical cycle of mercury (5). Deposited mercury in aquatic systems can be con-verted to more toxic methylmercury (MeHg), which bio-accumulates. People are then exposed to MeHg by eating contaminated fish. Effects of MeHg exposure include IQ deficits in prenatally exposed children (6–8) and may include cardiovas-cular effects in adults (7, 9). Scientific uncertainty and variability are substantial throughout this pathway, including but not limited to atmospheric chemistry, deposition patterns, methylation pro-cesses, bioaccumulation and food web dynamics, dietary patterns of exposure, and dose–response relationships. Despite these uncer-tainties, scientific analyses have been conducted to support decision-making, and state-of-the-art models exist for many of these steps.
Some studies have previously traced the pathway from mer-cury emissions to human impacts. These studies are limited in how completely they have represented physical processes, and how they have accounted for knowledge gaps. First, many do not explicitly consider spatial transport through the environment on a global scale, and so do not explicitly link emissions to exposure changes (10–14). Timescales associated with bioaccumulation through ecosystems also are often not taken into account, making
Significance
Mercury is a globally transported pollutant with potent neu-rotoxic effects for both humans and wildlife. This study intro-duces an assessment method to estimate the potential human health-related economic benefits of global and domestic mer-cury control policies. It finds that for the US population as a whole, global mercury controls could lead to approximately twice the benefits of domestic action by 2050. This result is robust to several uncertainties and variabilities along the emissions-to-impacts path, although we find that those con-suming locally caught freshwater fish in the United States could benefit more from domestic action.
Author contributions: A.G. and N.E.S. designed research; A.G. performed research; A.G. and N.E.S. analyzed data; and A.G. and N.E.S. wrote the paper.
The authors declare no conflict of interest. This article is a PNAS Direct Submission.
Freely available online through the PNAS open access option. 1To whom correspondence should be addressed. Email: [email protected].
This article contains supporting information online atwww.pnas.org/lookup/suppl/doi:10. 1073/pnas.1514395113/-/DCSupplemental.
it difficult to evaluate how the timing of emissions changes affects benefits (15). Few studies have explicitly included more uncertain, but potentially important, health endpoints such as cardiovascular effects in their estimates (12, 16). For instance, the US Environ-mental Protection Agency (15) focused on only IQ-related MeHg effects in their analysis of the Mercury and Air Toxics Standards (MATS) in the United States. Finally, methods used for previous studies were not designed to highlight the relative importance of uncertainties throughout the policies-to-impacts path.
We explicitly incorporate uncertainty and sensitivity analysis for key steps along the policies-to-impacts pathway to assess the relative importance of policy-relevant uncertainties. We combine best available models to trace projected global mercury policy sce-narios to their US impacts. We use atmospheric modeling to project the amount of mercury depositing to the US and global seafood source regions with and without global policy. We incorporate as-sessment of timescales associated with bioaccumulation through ecosystems. We then link atmospheric mercury models to economic valuation models, generating a representation of mercury impacts that takes into account environmental and human response time-scales. We use this assessment approach to present what is, to our knowledge, a first assessment of potential US benefits, defined in economic terms, from the Minamata Convention. We explicitly compare benefits of global and US policies, using consistent methodology, and analyze the relative impacts of these policies on the US population. We first present results from a base case analysis of mercury policy to 2050, using our integrated model. We then present our sensitivity analyses, assessing the influence of uncer-tainties on our base case results.
Results and Discussion
Tracking the Policies-to-Impacts Pathway: Base Case.Globally, our emissions projections under the Minamata Convention will result in 2050 in emissions of 1,870 Mg·y−1, which is roughly
equivalent to the present-day level, but 2,270 Mg·y−1less than
our no policy (NP) scenario (17). The largest sources of an-thropogenic mercury emission are stationary coal combustion, artisanal and small-scale gold mining, and metals production (18). Under NP, emissions are projected to more than double, largely as a result of growth in coal use in Asia (19); thus, the main differences in policy and NP projections depend on as-sumptions about emission controls for coal (20). Air quality abatement technologies such as flue gas desulfurization can capture mercury as a cobenefit. For global emission projections under the Minamata Convention, which requires the application of best available technologies, taking into account technical and economic feasibility, we assume the application of flue gas de-sulfurization or similar technology outside of the United States (17, 19). In the United States, our policy scenario is based on MATS (currently under legal challenge), which was designed to control Hg emissions from power generation, with full imple-mentation by 2016 (15). In the United States, emissions in 2005 were∼90 Mg·y−1(15). Under our MATS projection, we extend
the US Environmental Protection Agency projected trend from 2016 to 2020 (15, 21) linearly, resulting in 2050 US emissions of 46 Mg·y−1. Our NP case for the United States includes no further
improvements in emissions control technology or policy, and thus results in an approximate doubling of 2005 emissions by 2050 (19). Benefits of the Minamata Convention to the United States are calculated as the difference between the global Minamata and NP scenarios, holding US emissions constant at the MATS scenario. Benefits of MATS to the US are calculated as the difference between the US NP and MATS scenarios, holding emissions in the rest of the world constant at the NP scenario.
Under our Minamata case, mercury deposition to the United States and to the global oceans are 19% and 57% less than under NP in 2050, respectively. Fig. 1 maps these deposition differences over the contiguous United States. We model the atmospheric transport and deposition of mercury using the global, 3D land-ocean-atmosphere mercury model GEOS-Chem v.9-02, at 4°× 5° resolution globally and 0.5° × 0.667° resolution over the United States (22–26). We use net total deposition as a measure of mercury ecosystem enrichment (27). SI Appendix, Chemical transport modeling gives additional details on the modeling ap-proaches. For our MATS case, deposition to the United States is 20% less than under NP, and deposition to the global oceans is 6% less. Although the modeled avoided deposition over the entire United States is similar under MATS and Minamata, the distribution of these differences varies, as shown in Fig. 1. Avoided deposition under MATS is more highly concentrated in the Northeast, where there are significant coal-fired emission sources. In contrast, US deposition benefits under the Minamata Convention follow precipitation patterns, as policy avoids in-creases in the global background mercury concentration.
Because mercury is persistent in the environment, anthropo-genic emissions also enrich reservoirs of mercury in the subsur-face ocean and soils. Mercury from these pools can enhance reemissions, contributing further to deposition. Our GEOS-Chem simulations take into account the effect of anthropogenic emis-sions changes on concentrations of mercury in surface reservoirs only, and consequently underestimate the total deposition benefits attributable to policy. To roughly estimate the extent of this un-derestimation, we use a seven-box, biogeochemical model de-veloped by Amos et al. (28, 29), which captures the deep ocean and soil reservoirs, but not the spatial distribution of impacts (SI Appendix, Chemical transport modeling). We find that globally, deposition reductions under policy are∼30% larger when taking into account enrichment of these subsurface pools.
Recent research suggests that fish concentrations in ocean (30–32) and freshwater (33–36) fish will likely respond proportionally to changes in atmospheric inputs over years to decades, although the magnitude and timing of a full response may be variable, depending on the region (see refs. 32 and 37–39 for examples). For our base case scenario, we assume that fish MeHg in both freshwater and marine ecosystems responds after 10 y to proportionally reflect changes in atmospheric inputs (we test the response to this assumption
Fig. 1. Projected net deposition benefits (Δμg/m2∙y) of MATS and the Minamata Convention over NP over the contiguous United States, at 0.5° × 0.667° resolution. Global results, at 4°× 5° resolution, are shown inSI Appendix, Fig. S4.
Giang and Selin PNAS | January 12, 2016 | vol. 113 | no. 2 | 287
SUSTAIN
ABILITY
SCIENC
in our sensitivity analysis) (30, 37). We specify base year blood MeHg, as a biomarker for MeHg exposure, by region, based on the National Health and Nutrition Examination Survey (40). We then scale blood concentrations based on the change in intake of fish MeHg (change in deposition plus time lag), taking into ac-count consumption of domestic freshwater and imported fish species from global fisheries, using data from US seafood market studies (41) and data compiled by the US Environmental Pro-tection Agency on noncommercial anglers (15, 42). Because of data limitations, we consider noncommercial mercury intake from local, freshwater fish only. We treat noncommercial marine an-glers as average US consumers of marine and estuarine fish. This may slightly underestimate the benefits of MATS in our work; however, further data are necessary to quantify the MeHg intake of noncommercial anglers in different US coastal regions (see
SI Appendix, Changes in human exposurefor detailed methods). Calculated average US mercury intake in 2050, assuming a 10-y time lag between deposition changes and fish response, as well as constant fish intake patterns, is 91% less under our Minamata scenario than under NP (SI Appendix, Fig. S5). Our MATS scenario reduces intake by 32% compared with the NP case. Although the deposition decreases over the United States are roughly equivalent between the MATS and Minamata scenarios, changes to modeled mercury intake are larger under the latter. More than 90% of the US commercial fish market, and the majority of US mercury intake, comes from marine and estuarine sources, particularly from Pacific and Atlantic Ocean basins (41, 43). These regions are heavily influenced by emissions from non-US sources, including East and South Asia. In addition, even locally caught freshwater fish are affected by the long-range transport of mercury emissions. Re-gional differences in the geographic source of dietary fish (SI Appendix, Changes in human exposure) and deposition lead to variations in intake change patterns across scenarios, as shown inSI Appendix, Fig. S4. The majority of modeled MeHg intake in the North Central region (SI Appendix, Fig. S5) is from self-caught, local freshwater fish, leading to a diminished intake benefit from the Minamata scenario relative to the MATS scenario. The opposite pattern holds for New York. These differences in intake lead to corresponding differences in IQ deficits and cardiovascular outcomes (see SI Appendix, IQ effects; Cardiovascular impacts; and Health impactsfor health impacts methods and results, respectively).
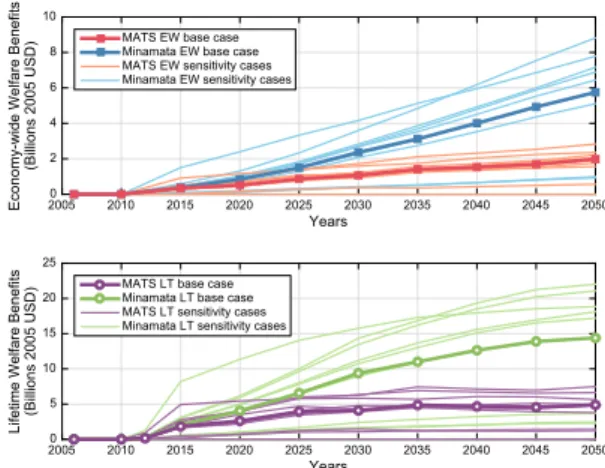
Annual US economic benefits to 2050 (applying a 3% discount rate) from avoided health impacts under domestic and global mercury policies under our base case assumptions, relative to NP, are presented in Fig. 2. We use two economic valuation approaches: the first, a cost-of-illness and value of statistical life
(VSL) approach, estimates projected lifetime (LT) benefits of avoided exposure for those born by 2050 and is consistent with US regulatory practice; the second, a human capital approach, estimates economy-wide (EW) benefits realized by 2050 from avoided labor productivity and wage losses. Given differences in methodology, results from these two approaches are not directly comparable (see SI Appendix, Economic modeling of health impacts for more details). To estimate LT benefits of avoided health effects, we apply estimates of projected lost wages and medical costs for IQ deficits and nonfatal acute myocardial infarctions (heart attacks), and VSL for premature fatalities resulting from myocardial infarctions (see ref. 12 and examples listed in ref. 44 of studies that use this approach), for each year’s projected birth cohort (IQ) and affected adult population (heart attacks). The second method uses the US Regional Energy Policy model, a computable general equilibrium model of the US econ-omy (45). Consistent with previous work valuing economic effects of air pollution through computable general equilibrium modeling (46), we take into account the effects of IQ deficits and fatal and nonfatal heart attacks on the labor force, and its cumulative effect over time. Base case cumulative EW benefits of the Minamata Convention to the United States by 2050 are $104 billion (2005 USD) (Fig. 2, Top, blue line), and cumulative LT benefits for those born by 2050 are $339 billion (Fig. 2, Bottom, green line). EW benefits from our MATS scenario (Fig. 2, Top, red line) are $43 billion by 2050, and LT benefits are $147 billion (Fig. 2, Bottom, purple line). Both EW and LT benefits are dominated (>90% for LT and>99% for EW) by avoided cardiovascular effects, consis-tent with previous studies, including these health endpoints (12, 16). Relative to US domestic action, estimated cumulative benefits from the Minamata Convention are more than twice as large.
Considered per unit of avoided emissions, however, the pro-jected benefits of MATS to the United States are larger than those of the Minamata Convention: $324 million/Mg compared with $46 million/Mg for EW benefits by 2050, and $1.1 billion/Mg compared with $150 million/Mg for LT benefits for those born by 2050. Given its global scope, the Minamata Convention is likely to prevent more emissions than MATS. However, as mercury pollu-tion has effects on both local and global scales, avoided emissions within the United States, on a per unit basis, lead to larger benefits.
Policies-to-Impacts Sensitivity Analysis.We assess uncertainty and variability along the policies-to-impacts pathway by identifying key drivers of uncertainty in our base case integrated model, and calculating how changes in assumptions affect our quantification of US benefits from the Minamata Convention, MATS, and relative benefits. Key assumptions addressed here include the ef-fect of atmospheric chemistry, ecosystem time lags, dietary choices, dose–response parameters linking MeHg exposure and health ef-fects, economic costs, and discount rates. We run the integrated model for realistic and policy-relevant low and high bounds for these assumptions. Fig. 2 shows the range of calculated benefits from these sensitivity scenarios, described further here. The un-certain range spanned by these cases is illustrated by the lines in Fig. 2; however, the bounds delineated by these lines for the Minamata (blue/green) and MATS (red/purple) scenarios are not independent. Some sensitivity scenarios lead to the same di-rectional change in benefits over the base case for both the do-mestic and global scenario, such that the magnitude of cumulative benefits for the Minamata scenario remain larger than for MATS. This result is illustrated in Fig. 3, which shows the range in ratio of benefits between Minamata and MATS, under different sensitivity scenarios. Details of the low and high cases addressed are pre-sented inSI Appendix, Table S7 and Sensitivity analysis.
Our low and high cases for atmospheric chemistry bound un-certainty about the form of mercury emissions and atmospheric redox reactions. Although policies address total mercury emis-sions, emissions of mercury occur as different chemical species with different atmospheric lifetimes. Mercury emitted in its elemental form, Hg(0), has an atmospheric lifetime of 6 mo to a year, enabling it to transport globally before its oxidation and
Fig. 2. Trajectories of welfare benefits under global and domestic policy until 2050, discounted at 3%. (Top) Modeled EW benefits realized in a given year. (Bottom) Projected LT benefits for that year’s affected population. Base cases are indicated with markers. Unmarked lines show the range of trajec-tories from sensitivity cases.
subsequent deposition. Mercury emitted in its oxidized form, Hg(II), in the gas phase, or Hg(P) in the particle phase, is more soluble and can deposit closer to its source. In addition, the speciation of present-day mercury emissions is uncertain. Reduction reactions may convert Hg(II) to Hg(0), lengthening its lifetime; this process may occur in the atmosphere in the aqueous phase (47), or in power plant plumes (48, 49). However, the mechanism of potential reduction is unknown. To bound this uncertainty, we assume for our low case that 90% of global Hg reductions over NP occur as Hg(II) or Hg(P), and for the high case, that 90% of reductions occur as Hg(0). This results in a range of cumulative EW benefits for Minamata between $102 billion (low) and $123 billion (high) in 2005 USD, and a range of LT benefits of $338 billion to $405 billion. That the low case results in only a small difference from the base case reflects the emphasis on control technologies that capture oxidized mercury in the base case assumptions (19). The relative benefits of Minamata versus our MATS case vary to a factor of 2.9 from the base case. If policy prevents primarily Hg(0) emissions, or there is a high rate of in-plume reduction, there is greater long-range benefit to the United States and global oceans from avoided emissions occurring elsewhere.
If fish MeHg responds rapidly and quantitatively to changes in deposition, cumulative EW and LT benefits to 2050 from Minamata are projected to be $171 billion and $575 billion (2005 USD), whereas a slower response reduces projected EW and LT benefits to $18 billion and $60 billion. Although reductions in mercury deposition, all else equal, will eventually result in decreased environmental and fish concentrations, benefits within a given time horizon, which in this case is 2050, will depend on how long ecosystems take to respond. Estimated economic
benefits are therefore highly sensitive to the temporal scope of analysis. For instance, EW benefits from IQ effects are primarily accrued when those in birth cohorts with reduced exposure are of working age (see SI Appendix, Economic modeling of health impacts), and consequently are not fully captured by our 2050 time horizon. Population growth and discounting assumptions (we use a 3% discount rate; seeSI Appendix, Economic valuationfor others) also influence our cumulative benefit assessment. Timing effects are further discussed inSI Appendix, Economic valuation. Our lower bound incorporates an instantaneous response, which is the as-sumption commonly used in regulatory analyses (15, 42), and that may be roughly consistent with the behavior of certain classes of freshwater bodies (37). Our upper bound is 50 y, consistent with the high range of estimated response times for surface open ocean waters (30), where MeHg production and biomagnification are hypothesized to occur (31), and midrange estimates for watershed-fed coastal ecosystems and some lake systems, which may be the slowest to respond to changes in atmospheric deposition (32, 36).
Population dietary choice between local freshwater and global market fish alters our Minamata base case cumulative EW ben-efits from $17 billion (2005 USD) to $127 billion, and cumulative LT benefits from $56 billion to $418 billion. Our base case as-sumes that population dietary choices between local fish and global market fish remain constant over time. For low and high bounds, respectively, we assume that people’s diets are 100% from either local freshwater or global sources. Where US seafood consumers eat a larger fraction of market marine and estuarine fish, benefits from Minamata are higher. Under the 100% local freshwater diet assumption, benefits from MATS exceed those of Minamata (Minamata/MATS ratio of 0.4 in Fig. 3).
With different assumptions about pharmacokinetics and dose– response functions between mercury intake and human health effects, our results for the Minamata scenario vary from $6 million to $160 billion (2005 USD) in EW benefits, and from $1.4 billion to $498 billion in LT benefits. Although convincing evidence is present to associate MeHg with adverse human ef-fects at low to medium doses, particularly for IQ deficits (7, 50), there may be variability in the magnitude of this effect; for in-stance, because of genetic variability (51). As a result, we use 95% confidence interval bounds for high and low cases for bio-marker and dose–response parameters (SI Appendix, Table S3). Associations between mercury exposure and cardiovascular im-pacts are less certain than IQ effects (9). Previous studies have expressed this uncertainty, using an expected value approach taking into account both the plausibility of a relationship be-tween MeHg and cardiovascular impacts and uncertainties in the parameters of the relationship (12). Our lower bound does not include cardiovascular impacts, whereas our base case and upper bound do, with the 97.5 percentile estimate of the relationship between hair mercury and heart attack risk used in the high case (SI Appendix, Sensitivity Analysis) (52). A more detailed review of the epidemiological evidence contributing to these parameteri-zations is given in SI Appendix, IQ effects and Cardiovascular impacts. Although using different exposure–response functions
leads to the largest absolute range in cumulative benefits among the sensitivity cases considered (Fig. 3), the relative benefits between Minamata and MATS do not change as substantially.
High and low assumptions for the economic valuation of mercury-related health effects lead to a range of $58 billion to $121 billion (2005 USD) in EW benefits from the Minamata scenario by 2050, and a range of $87 billion to $518 billion in LT benefits. Our sensitivity scenarios for EW benefits address only morbidity, and not mortality, effects: medical costs associated with heart attacks, and the relationship between IQ deficits and lost earnings. We use the 95% confidence interval for the IQ to income relationship and the range of estimates for medical costs from the literature as bounding cases (SI Appendix, Table S7). For LT valuations, we use central and range estimates for VSL and LT lost income from regulatory literature (15, 53). The valuation uncertainties considered have the smallest effect on the ratio of benefits between global and domestic scenarios (Fig. 3).
Fig. 3. (Top) Range in cumulative benefits of the Minamata scenario to 2050. Note the different scales for LT and EW benefits. (Bottom) Range in ratio of cumulative benefits to 2050 (Minamata Benefits/MATS Benefits). Blue and green lines show base case results for LT and EW benefits, re-spectively. Bars indicate the sensitivity of cumulative benefits to high and low case assumptions for uncertain parameters.
Giang and Selin PNAS | January 12, 2016 | vol. 113 | no. 2 | 289
SUSTAIN
ABILITY
SCIENC
Implications for Policy Evaluation.We developed and applied an assessment method to examine the complex pathways from policies to environmental effects for global toxic pollution from mercury that accounts for uncertainties and knowledge gaps in a structured way. We showed, using this method, that by 2050, the Minamata Convention could have approximately twice the benefit of our scenario simulating domestic actions ($104 billion compared with $43 billion in cumulative EW benefits, and $339 billion com-pared with $147 billion in cumulative LT benefits). The relative benefit is robust to several uncertainties assessed along the policies-to-impacts pathway, including atmospheric chemical processes, ecosystem time lags, and exposure–response relationships; how-ever, we find that domestic action has a larger benefit when dietary fish is sourced from local freshwater bodies. Per megagram of avoided emissions, the benefits to the United States of domestic action are nearly an order of magnitude larger than global action, highlighting that although mercury is a global pollutant, local pol-icies contribute strongly to local benefits. As shown inSI Appendix, Fig. S4, avoided emissions associated with the Minamata Conven-tion outside of the United States may lead to large benefits in Asia and Southern Europe. Abatement costs will also vary by region.
Although we have conducted what is, to our knowledge, the first global-scale attempt to link future emissions trajectories to domestic impacts, our ability to incorporate detailed models of the entire pathway is limited by existing scientific knowledge. In addition to these knowledge gaps, there are also variabilities in mercury’s behavior across ecosystems and regions, as well as in human responses (physical and social). Our approach uses bounding assumptions along the policies-to-impacts pathway as a proxy to assess the relative influence of various uncertainties, from a range of disciplines. In a number of previous analyses, range in the benefits of mercury reduction has been specified by the range in exposure–response functions (12, 13). Although our analysis underlines the importance of these uncertainties, particularly those related to cardiovascular effects, it also suggests that pre-vious approaches miss other potentially large contributors to uncertainty in economic effects (particularly within a given time horizon), such as marine and freshwater ecosystem dynamics and dietary intake variabilities.
Although, all else being equal, mercury emissions reductions will ultimately result in exposure reductions, our analysis in-dicates that uncertainties in ecosystem dynamics affecting the timescale of these reductions will strongly influence benefits within a given time horizon. Many of the processes affecting the conversion of inorganic mercury to MeHg and subsequent uptake in biota are poorly understood, particularly in marine ecosystems (54, 55). In addition, there is variability among eco-system types, both freshwater (37) and marine and estuarine (32), in how quickly these systems and biota within them respond to changes in deposition. As described previously, our analysis focuses on changes to mercury in surface reservoirs, and ac-counting for these effects could increase benefits estimates by ∼30%. Future research should more fully address the timescales of reemissions from subsurface reservoirs, both land and ocean, and their effects on benefits estimates. Better understanding of mercury cycling, methylation and bioaccumulation processes, their variability, and the potential effects of global changes to climate, land use, and other environmental contaminants will be critical for improving policy evaluation (56), particularly for better understanding the distribution of benefits between current and future generations.
Our analysis also reveals the importance of social factors in estimating the absolute and relative benefits of different policies. Dietary choices, including fish selection and consumption rate, can have a potentially larger influence on the ratio of benefits from global compared with domestic action than substantial scientific uncertainties about mercury′s environmental behavior. This sensitivity result suggests that domestic actions may be particularly important for reducing exposure for communities that consume mostly fish sourced from the contiguous United States, such as certain Indigenous peoples and immigrant groups,
subsistence fishers, and recreational anglers. In addition, it highlights the policy need for analysis and data collection on the evolving patterns in fisheries production and fish consumption (43). It has been noted that dietary guidance on fish selection and consumption frequency could be part of an adaptation strategy to minimize mercury exposure (57), and our results point toward their potentially large effect as a policy lever. However, dietary advice is highly complex. Fish consumption, and specific fish selection, can have substantial benefits, both nutritional (58, 59) and sociocultural (60). Balancing the risks and benefits of fish consumption therefore requires careful consideration of contextual factors. Even with such adaptive approaches, there is continued need to mitigate future emissions. Although uncertainties related to chemical speciation of emissions reductions led to the smallest range in cumulative benefits for the Minamata scenario, interactions between these uncertainties and variabilities in dietary fish source could affect the relative benefits of global versus domestic action. At this time, our ability to constrain these speciation uncertainties is partially limited by measurement challenges (61). Improved measurement techniques could provide insight into distributional aspects of control policies.
Differences in valuation methods for health endpoints could lead to substantial variation in benefits estimates. Our two val-uation approaches highlight some of these potential variations: Our EW approach emphasizes compounding economy-wide gains over time, but considers only effects to the economy (not individuals) realized within the 2050 time horizon; in contrast, our LT approach more closely resembles regulatory studies, taking into account projected lifetime and nonmarket effects to individuals (e.g., pain and suffering). As highlighted previously, economic benefits estimates are very sensitive to choices of temporal scope of analysis and discounting. Estimates are also sensitive to the endpoints considered: In addition to the health effects considered here, there may be other human and wildlife health endpoints not included in this study that, although not well characterized at this time (7), may also have economic ef-fects. No less important, there may be dimensions of individual and community health and well-being that are not quantifiable within this economic framework, which should be considered in a holistic assessment of policy benefits (62).
Our assessment of US benefits from global and domestic policy is designed to be illustrative, drawing attention to uncertainties in estimating economic benefits and methods to take these uncer-tainties into account. As a consequence, our estimates should not be taken as a comprehensive projection of impacts. However, as scientific knowledge evolves, many uncertainties can be addressed using similar methodology. Policies-to-impacts analyses similar to the one presented here can be valuable for synthesizing available information, identifying its limitations, and when combined with sensitivity analysis, suggesting areas where scientific data collec-tion to narrow uncertainty would lead to uncertainty reduccollec-tion of importance to policy-making.
Materials and Methods
Brief explanations of methods have been included throughout Results and Discussion. In theSI Appendix, Supplementary methods, we provide a detailed description of methodology and data sources for emissions projections, chemical transport modeling, translating changes in deposition to changes in human exposure, IQ and cardiovascular impacts modeling, economic modeling of health impacts, and sensitivity analysis. Institutional review and informed consent were not necessary for this modeling study, as all human health and ecosystem input data were drawn from published sources.
ACKNOWLEDGMENTS. This work was supported by the National Science Foundation (Awards 1053648 and 131755), the J. H. and E. V. Wade Fund (Massachusetts Institute of Technology), and fellowships from the Natural Science and Engineering Research Council of Canada and the MIT Sociotechnical Systems Research Center Stokes Fund (to A.G.). This work used a modeling tool (US Regional Energy Policy) developed by the MIT Joint Program on the Science and Policy of Global Change, which is supported by a number of federal agencies and a consortium of 40 industrial and foundation sponsors. A complete list of sponsors is available atglobalchange.mit.edu.
1. Rockström J, et al. (2009) A safe operating space for humanity. Nature 461(7263): 472–475.
2. Selin H (2014) Global Environmental Law and Treaty-Making on Hazardous Sub-stances: The Minamata Convention and Mercury Abatement. Glob Environ Politics 14(1):1–19.
3. Lamborg CH, et al. (2014) A global ocean inventory of anthropogenic mercury based on water column measurements. Nature 512(7512):65–68.
4. Amos HM, et al. (2015) Observational and modeling constraints on global anthro-pogenic enrichment of mercury. Environ Sci Technol 49(7):4036–4047.
5. Driscoll CT, Mason RP, Chan HM, Jacob DJ, Pirrone N (2013) Mercury as a global pollutant: Sources, pathways, and effects. Environ Sci Technol 47(10):4967–4983. 6. Grandjean P, Satoh H, Murata K, Eto K (2010) Adverse effects of methylmercury:
Environmental health research implications. Environ Health Perspect 118(8): 1137–1145.
7. Karagas MR, et al. (2012) Evidence on the human health effects of low-level meth-ylmercury exposure. Environ Health Perspect 120(6):799–806.
8. Sheehan MC, et al. (2014) Global methylmercury exposure from seafood consumption and risk of developmental neurotoxicity: A systematic review. Bull World Health Organ 92(4):254–269F.
9. Roman HA, et al. (2011) Evaluation of the cardiovascular effects of methylmercury exposures: Current evidence supports development of a dose-response function for regulatory benefits analysis. Environ Health Perspect 119(5):607–614.
10. Trasande L, Landrigan PJ, Schechter C (2005) Public health and economic conse-quences of methyl mercury toxicity to the developing brain. Environ Health Perspect 113(5):590–596.
11. Spadaro JV, Rabl A (2008) Global health impacts and costs due to mercury emissions. Risk Anal 28(3):603–613.
12. Rice GE, Hammitt JK, Evans JS (2010) A probabilistic characterization of the health benefits of reducing methyl mercury intake in the United States. Environ Sci Technol 44(13):5216–5224.
13. Bellanger M, et al.; DEMO/COPHES (2013) Economic benefits of methylmercury exposure control in Europe: Monetary value of neurotoxicity prevention. Environ Health 12:3. 14. Griffiths C, McGartland A, Miller M (2007) A comparison of the monetized impact of
IQ decrements from mercury emissions. Environ Health Perspect 115(6):841–847. 15. US Environmental Protection Agency (2011) Regulatory Impact Analysis for the Final
Mercury and Air Toxics Standards (US Environmental Protection Agency, Office of Air Quality and Planning Standards, Research Triangle Park, NC).
16. Rice GE, Hammitt JK (2005) Economic Valuation of Human Health Benefits of Con-trolling Mercury Emissions from U.S. Coal-Fired Power Plants. (Northeast States for Coordinated Air Use Management, Boston, MA).
17. Selin NE (2014) Global change and mercury cycling: Challenges for implementing a global mercury treaty. Environ Toxicol Chem 33(6):1202–1210.
18. United Nations Environment Programme. (2013) Global Mercury Assessment 2013: Sources, Emissions, Releases and Environmental Transport, (UNEP Chemicals Branch, Geneva, Switzerland).
19. Streets DG, Zhang Q, Wu Y (2009) Projections of global mercury emissions in 2050. Environ Sci Technol 43(8):2983–2988.
20. Giang A, Stokes LC, Streets DG, Corbitt ES, Selin NE (2015) Impacts of the minamata convention on mercury emissions and global deposition from coal-fired power gen-eration in Asia. Environ Sci Technol 49(9):5326–5335.
21. US Environmental Protection Agency. (2011) IPM Analysis of the Final Mercury and Air Toxics Standards (US Environmental Protection Agency, Clean Air Markets Division, Washington, DC).
22. Selin NE, et al. (2008) Global 3-D land-ocean-atmosphere model for mercury: Present-day versus preindustrial cycles and anthropogenic enrichment factors for deposition. Global Biogeochem Cycles 22(2):1–13.
23. Soerensen AL, et al. (2010) An improved global model for air-sea exchange of mer-cury: High concentrations over the North Atlantic. Environ Sci Technol 44(22): 8574–8580.
24. Holmes CD, et al. (2010) Global atmospheric model for mercury including oxidation by bromine atoms. Atmos Chem Phys 10(24):12037–12057.
25. Amos HM, et al. (2012) Gas-particle partitioning of atmospheric Hg(II) and its effect on global mercury deposition. Atmos Chem Phys 12(1):591–603.
26. Zhang Y, et al. (2012) Nested-grid simulation of mercury over North America. Atmos Chem Phys 12:6095–6111.
27. Corbitt ES, Jacob DJ, Holmes CD, Streets DG, Sunderland EM (2011) Global source-receptor relationships for mercury deposition under present-day and 2050 emissions scenarios. Environ Sci Technol 45(24):10477–10484.
28. Amos HM, Jacob DJ, Streets DG, Sunderland EM (2013) Legacy impacts of all-time anthropogenic emissions on the global mercury cycle. Global Biogeochem Cycles 27(2):410–421.
29. Amos HM, et al. (2014) Global biogeochemical implications of mercury discharges from rivers and sediment burial. Environ Sci Technol 48(16):9514–9522.
30. Sunderland EM, Mason RP (2007) Human impacts on open ocean mercury concen-trations. Global Biogeochem Cycles 21(4):GB4022.
31. Mason RP, et al. (2012) Mercury biogeochemical cycling in the ocean and policy im-plications. Environ Res 119:101–117.
32. Chen C, et al. (2012) Sources to Seafood: Mercury Pollution in the Marine Environment (Toxic Metals Superfund Research Program, Dartmouth College, Hano-ver, NH).
33. Harris RC, et al. (2007) Whole-ecosystem study shows rapid fish-mercury response to changes in mercury deposition. Proc Natl Acad Sci USA 104(42):16586–16591. 34. Evers DC, et al. (2011) Mercury in the Great Lakes region: Bioaccumulation,
spatio-temporal patterns, ecological risks, and policy. Ecotoxicology 20(7):1487–1499. 35. Drevnick PE, et al. (2012) Spatial and temporal patterns of mercury accumulation in
lacustrine sediments across the Laurentian Great Lakes region. Environ Pollut 161: 252–260.
36. Vijayaraghavan K, Levin L, Parker L, Yarwood G, Streets D (2014) Response of fish tissue mercury in a freshwater lake to local, regional, and global changes in mercury emissions. Environ Toxicol Chem 33(6):1238–1247.
37. Knightes CD, Sunderland EM, Craig Barber M, Johnston JM, Ambrose RBJ (2009) Application of ecosystem-scale fate and bioaccumulation models to predict fish mercury response times to changes in atmospheric deposition. Environ Toxicol Chem 28(4):881–893.
38. Selin NE, Sunderland EM, Knightes CD, Mason RP (2010) Sources of mercury exposure for U.S. seafood consumers: Implications for policy. Environ Health Perspect 118(1): 137–143.
39. Drenner RW, et al. (2013) Effects of mercury deposition and coniferous forests on the mercury contamination of fish in the South Central United States. Environ Sci Technol 47(3):1274–1279.
40. Mahaffey KR, Clickner RP, Jeffries RA (2009) Adult women’s blood mercury concen-trations vary regionally in the United States: Association with patterns of fish con-sumption (NHANES 1999-2004). Environ Health Perspect 117(1):47–53.
41. Sunderland EM (2007) Mercury exposure from domestic and imported estuarine and marine fish in the U.S. seafood market. Environ Health Perspect 115(2):235–242. 42. US Environmental Protection Agency(2005) Regulatory Impact Analysis of the Final
Clean Air Mercury Rule, (US Environmental Protection Agency, Office of Air Quality Planning and Standards, Research Triangle Park, NC).
43. Karimi R, Fitzgerald TP, Fisher NS (2012) A quantitative synthesis of mercury in commercial seafood and implications for exposure in the United States. Environ Health Perspect 120(11):1512–1519.
44. Bell ML, Morgenstern RD, Harrington W (2011) Quantifying the human health ben-efits of air pollution policies: Review of recent studies and new directions in ac-countability research. Environ Sci Policy 14(4):357–368.
45. Rausch S, Metcalf GE, Reilly JM (2010) Distributional Implications of Alternative U.S. Greenhouse Gas Control Measures, (National Bureau of Economic Research Working Paper 16053, Cambridge, MA).
46. Saari RK, Selin NE, Rausch S, Thompson TM (2015) A self-consistent method to assess air quality co-benefits from U.S. climate policies. J Air Waste Manag Assoc 65(1): 74–89.
47. Subir M, Ariya PA, Dastoor AP (2012) A review of the sources of uncertainties in at-mospheric mercury modeling II. Mercury surface and heterogeneous chemistry– A missing link. Atmos Environ 46:1–10.
48. Landis MS, Ryan JV, ter Schure AFH, Laudal D (2014) Behavior of mercury emissions from a commercial coal-fired power plant: The relationship between stack speciation and near-field plume measurements. Environ Sci Technol 48(22):13540–13548. 49. Tong Y, et al. (2014) Comparison of heterogeneous photolytic reduction of Hg(II) in
the coal fly ashes and synthetic aerosols. Atmos Res 138:324–329.
50. NRC (2000) Toxicological Effects of Methylmercury. (National Research Council, National Academy Press, Washington, DC).
51. Basu N, Goodrich JM, Head J (2014) Ecogenetics of mercury: From genetic polymor-phisms and epigenetics to risk assessment and decision-making. Environ Toxicol Chem 33(6):1248–1258.
52. Virtanen JK, et al. (2005) Mercury, fish oils, and risk of acute coronary events and cardiovascular disease, coronary heart disease, and all-cause mortality in men in eastern Finland. Arterioscler Thromb Vasc Biol 25(1):228–233.
53. RTI International. (2015) Environmental Benefits Mapping and Analysis Program -Community Edition: User’s Manual Appendices, (Research Triangle Park, NC). 54. Lamborg C, et al. (2014) Mercury in the Anthropocene Ocean. Oceanography (Wash
DC) 27(1):76–87.
55. Hsu-Kim H, Kucharzyk KH, Zhang T, Deshusses MA (2013) Mechanisms regulating mercury bioavailability for methylating microorganisms in the aquatic environment: A critical review. Environ Sci Technol 47(6):2441–2456.
56. Sundseth K, Pacyna JM, Banel A, Pacyna EG, Rautio A (2015) Climate change impacts on environmental and human exposure to mercury in the arctic. Int J Environ Res Public Health 12(4):3579–3599.
57. Xue J, et al. (2015) Modeling tribal exposures to methyl mercury from fish con-sumption. Sci Total Environ 533:102–109.
58. Oken E, et al. (2012) Which fish should I eat? Perspectives influencing fish con-sumption choices. Environ Health Perspect 120(6):790–798.
59. Mozaffarian D, Rimm EB (2006) Fish intake, contaminants, and human health: Eval-uating the risks and the benefits. JAMA 296(15):1885–1899.
60. O’Neill CA (2004) Mercury, Risk, and Justice. Environ Law Rev 34(12):11070–11115. 61. Jaffe DA, et al. (2014) Progress on understanding atmospheric mercury hampered by
uncertain measurements. Environ Sci Technol 48(13):7204–7206.
62. Ranco DJ, O’Neill CA, Donatuto J, Harper BL (2011) Environmental Justice, American Indians and the Cultural Dilemma: Developing Environmental Management for Tribal Health and Well-being. Environ Justice 4(4):221–230.
Giang and Selin PNAS | January 12, 2016 | vol. 113 | no. 2 | 291
SUSTAIN
ABILITY
SCIENC