EUROPEAN ORGANISATION FOR NUCLEAR RESEARCH (CERN)
Submitted to: Phys. Rev. D. CERN-EP-2016-061
31st May 2016
Search for pair production of gluinos decaying via stop and
sbottom in events with b-jets and large missing transverse
momentum in pp collisions at
√
s
= 13 TeV with the ATLAS
detector
The ATLAS Collaboration
Abstract
A search for Supersymmetry involving the pair production of gluinos decaying via third-generation squarks to the lightest neutralino ( ˜χ01) is reported. It uses an LHC proton–proton dataset at a center-of-mass energy √s = 13 TeV with an integrated luminosity of 3.2 fb−1 collected with the ATLAS detector in 2015. The signal is searched for in events contain-ing several energetic jets, of which at least three must be identified as b-jets, large misscontain-ing transverse momentum and, potentially, isolated electrons or muons. Large-radius jets with a high mass are also used to identify highly boosted top quarks. No excess is found above the predicted background. For ˜χ01masses below approximately 700 GeV, gluino masses of less than 1.78 TeV and 1.76 TeV are excluded at the 95% CL in simplified models of the pair pro-duction of gluinos decaying via sbottom and stop, respectively. These results significantly extend the exclusion limits obtained with the √s= 8 TeV dataset.
c
2016 CERN for the benefit of the ATLAS Collaboration.
Reproduction of this article or parts of it is allowed as specified in the CC-BY-4.0 license.
Contents
1 Introduction 2
2 ATLAS detector 4
3 Data and simulated event samples 4
4 Object reconstruction 5
5 Event selection 8
5.1 Signal regions 11
5.2 Background estimation and t¯t control regions 11
5.3 Validation regions 14 6 Systematic uncertainties 15 7 Results 16 8 Interpretation 18 9 Conclusion 22
1 Introduction
Supersymmetry (SUSY) [1–6] is a generalization of space-time symmetries that predicts new bosonic partners to the fermions and new fermionic partners to the bosons of the Standard Model (SM). If R-parity is conserved [7], SUSY particles are produced in pairs and the lightest supersymmetric particle (LSP) is stable. The scalar partners of the left- and right-handed quarks, the squarks ˜qL and ˜qR, can mix to form two mass eigenstates ˜q1 and ˜q2, ordered by increasing mass. SUSY can solve the hierarchy problem [8–11] by preventing “unnatural” fine-tuning in the Higgs sector provided that the superpartners of the top quark (stop, ˜t1and ˜t2) have masses not too far above the weak scale. Because of the SM weak isospin symmetry, the mass of the left-handed bottom quark scalar partner (sbottom, ˜bL) is tied to the mass of the left-handed top quark scalar partner (˜tL), and as a consequence the mass of the lightest sbottom ˜b1 is also expected to be close to the weak scale. The fermionic partners of the gluons, the gluinos ( ˜g), are also constrained by naturalness [12,13] to have a mass around the TeV scale in order to limit their contributions to the radiative corrections to the stop masses. For these reasons, and because the gluinos are expected to be pair-produced with a high cross-section at the Large Hadron Collider (LHC), the search for gluino production with decays via stop and sbottom quarks is highly motivated at the LHC.
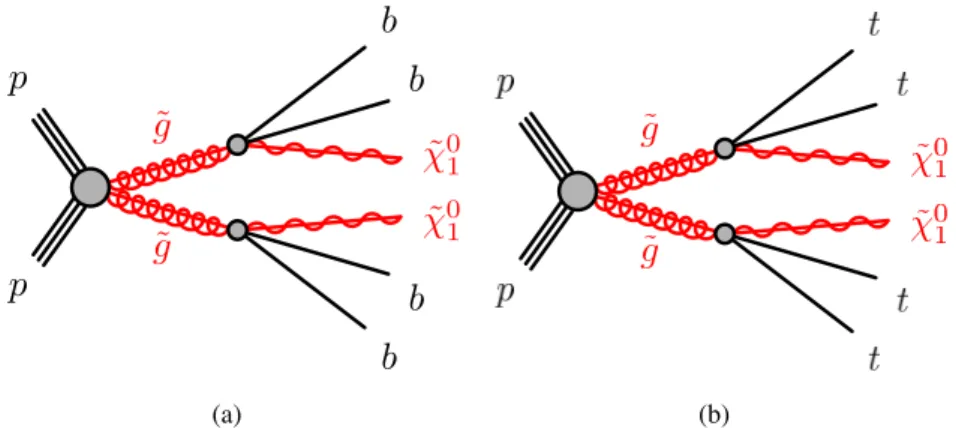
This paper presents the search for gluino pair production where both gluinos either decay to stops via ˜g → ˜t1t, or to sbottoms via ˜g → ˜b1b, using a dataset of 3.2 fb−1of proton–proton data collected with the ATLAS detector [14] at a center-of-mass energy of √s= 13 TeV. Each stop (sbottom) is then assumed to decay to a top (bottom) quark and the LSP: ˜t1 → t ˜χ01(˜b1→ b ˜χ01). The LSP is assumed to be the lightest neutralino ˜χ01, the lightest linear superposition of the superpartners of the neutral electroweak and Higgs bosons. The ˜χ01 interacts only weakly, resulting in final states with substantial missing transverse mo-mentum of magnitude EmissT . Diagrams of the simplified models [15,16] considered, which are referred
to as “Gbb” and “Gtt” in the following, are shown in Figures1(a) and1(b), respectively. The sbottom and stop are assumed to be produced off-shell such that the gluinos undergo the three-body decay ˜g → b¯b ˜χ01 or ˜g → t¯t˜χ01, and that the only parameters of the simplified models are the gluino and ˜χ
0 1masses.1
˜
g
˜
g
p
p
˜
χ
0 1b
b
˜
χ
01b
b
(a) (b)Figure 1: The decay topologies in the (a) Gbb and (b) Gtt simplified models.
The Gbb experimental signature consists of four energetic b-jets (i.e. jets containing b-hadrons) and large ETmiss. In order to maintain high signal efficiency, at least three of four required jets must be identified as b-jets (b-tagged). This requirement is very effective in rejecting t¯tevents, which constitute the main back-ground for both the Gbb and Gtt signatures, and which contain only two b-jets unless they are produced with additional heavy-flavor jets. The Gtt experimental signature also contains four b-jets and ETmiss, but yields in addition four W bosons originating from the top quark decays t → Wb. Each W boson can either decay leptonically (W → `ν) or hadronically (W → q ¯q0). A Gtt event would therefore possess a high jet multiplicity, with as many as 12 jets originating from top quark decays and, potentially, isolated charged leptons. In this paper, pair-produced gluinos decaying via stop and sbottom quarks are searched for using events with high jet multiplicity, of which at least three must be identified as b-jets, large EmissT , and either zero leptons (referred to as Gtt 0-lepton channel) or at least one identified charged lepton2 (referred to as Gtt 1-lepton channel). For both the Gbb and Gtt models, several signal regions are designed to cover different ranges of gluino and ˜χ01masses. For the Gtt models with a large mass difference (mass splitting) between the gluino and ˜χ01, the top quarks tend to be highly boosted and their decay products collim-ated. In the corresponding signal regions, at least one large-radius, trimmed [18] jet, which is re-clustered from small-radius jets [19], is required to have a high mass to identify hadronically decaying boosted top quarks.
Pair production of gluinos, with subsequent decays via sbottom quarks, was searched for in ATLAS Run 1 with a similar analysis requiring at least three b-tagged jets [17]. It excluded gluino masses below 1290 GeV for LSP masses below 400 GeV at 95% confidence level (CL). That analysis also searched for gluinos decaying via stop quarks in events with at least three b-tagged jets and either zero or at least one identified lepton and obtained the best ATLAS limits for the Gtt models with massless and moderately massive LSP [20]. Gluino masses below 1400 GeV were excluded at 95% CL for LSP masses below 400 GeV. Pair-produced gluinos with stop-mediated decays have also been searched for by ATLAS in events with high jet multiplicity [21], events with at least one lepton, many jets, and EmissT [22], and events containing pairs
1Models with on-shell sbottom and stop were studied in Run 1 [17] and the limits on the gluino and the ˜χ0
1masses were found
to be mostly independent of the stop and sbottom masses, except when the stop is very light.
of same-sign leptons or three leptons [23], the latter obtaining the best ATLAS limit for Gtt models with compressed mass spectra between the gluino and the LSP [20].
Similar searches performed in the CMS experiment [24–29] have produced comparable results to ATLAS searches.
2 ATLAS detector
The ATLAS detector is a multipurpose particle physics detector with a forward-backward symmetric cylindrical geometry and nearly 4π coverage in solid angle.3 The inner tracking detector (ID) consists of pixel and silicon microstrip detectors covering the pseudorapidity region |η| < 2.5, surrounded by a transition radiation tracker, which enhances electron identification in the region |η| < 2.0. Before the start of Run 2, the new innermost pixel layer, the Insertable B-Layer (IBL) [30], was inserted at a mean sensor radius of 3.3 cm. The ID is surrounded by a thin superconducting solenoid providing an axial 2 T magnetic field and by a fine-granularity lead/liquid-argon (LAr) electromagnetic calorimeter covering |η| < 3.2. A steel/scintillator-tile calorimeter provides coverage for hadronic showers in the central pseudorapidity range (|η| < 1.7). The endcap and forward regions (1.5 < |η| < 4.9) of the hadronic calorimeter are made of LAr active layers with either copper or tungsten as the absorber material. A muon spectrometer with an air-core toroid magnet system surrounds the calorimeters. Three layers of high-precision tracking chambers provide coverage in the range |η| < 2.7, while dedicated fast chambers allow triggering in the region |η| < 2.4. The ATLAS trigger system [31] consists of a hardware-based Level-1 trigger followed by a software-based High Level Trigger.
3 Data and simulated event samples
The data used in this analysis were collected by the ATLAS detector from pp collisions produced by the LHC at a center-of-mass-energy of 13 TeV and 25 ns proton bunch spacing. The full dataset corresponds to an integrated luminosity of 3.2 fb−1 with an associated uncertainty of ±5%, after requiring that all detector subsystems were operational during data recording. The measurement of the integrated lumin-osity is derived, following a methodology similar to that detailed in Ref. [32], from a calibration of the luminosity scale using a pair of x–y beam-separation scans performed in June 2015. Events are required to pass an EmissT trigger that is fully efficient for events passing the preselection defined in Section5. Each event includes on average 14 additional inelastic pp collisions (“pileup”) in the same bunch crossing. Simulated event samples are used to model the signal and background processes in this analysis. The signal samples for the Gbb and Gtt processes are generated with up to two additional partons using MadGraph5_aMC@NLO [33] v2.2.2 at leading order (LO) with CTEQ6L1 [34] Parton Density Function (PDF) sets and interfaced to Pythia v8.186 [35] for the modeling of the parton showering, hadronization and underlying event.
3ATLAS uses a right-handed coordinate system with its origin at the nominal interaction point in the center of the detector.
The positive x-axis is defined by the direction from the interaction point to the center of the LHC ring, with the positive y-axis pointing upwards, while the beam direction defines the z-axis. Cylindrical coordinates (r, φ) are used in the transverse plane, φ being the azimuthal angle around the z-axis. The pseudorapidity η is defined in terms of the polar angle θ by η= − ln tan(θ/2).
The dominant background in the signal regions is the production of t¯t pairs with additional high-pT jets. The sample for the estimation of this background is generated using the Powheg-Box [36,37] generator at next-to-leading order (NLO) with CT10 [38] PDFs and interfaced to Pythia v6.428 [39] for showering and hadronization. The decays of heavy-flavor hadrons are modeled using the EvtGen [40] package. The hdampparameter in Powheg, which controls the pT of the first additional emission beyond the Born level and thus regulates the pT of the recoil emission against the t¯t system, is set to the mass of the top quark (mtop = 172.5 GeV). This setting was found to give the best description of the pT of the t¯t system at √s = 7 TeV [41] and √s = 8 TeV [42]. All events with at least one semileptonically decaying top quark are included. Fully hadronic t¯t events do not contain sufficient ETmissto contribute significantly to the background.
Smaller backgrounds in the signal region come from the production of t¯t pairs in association with W/Z/h and additional jets, single-top production, production of t¯tt¯t, W/Z+jets and WW/WZ/ZZ (diboson) events. The production of t¯t pairs in association with electroweak vector bosons and t¯tt¯t production are modeled by samples generated using MadGraph [43] interfaced to Pythia v8.186, while samples to model t¯th production are generated using MadGraph5_aMC@NLO [33] v2.2.1 and showered with Herwig++ [44] v2.7.1. Single-top production in the s-, t- and Wt-channel are generated by Powheg-Box interfaced to Pythia v6.428. W/Z+jets and diboson processes are simulated using the Sherpa v2.1.1 [45] generator with CT10 PDF sets. Matrix elements for these processes are calculated using the Comix [46] and OpenLoops [47] generators and merged with the Sherpa parton shower [48] using the ME+PS@NLO prescription [49].
All simulated event samples, with the exception of the Gbb signals, are passed through full ATLAS de-tector simulation using Geant4 [50,51]. The Gbb signal samples are passed through a fast simulation that uses a parameterized description to simulate the response of the calorimeter systems [52]. The simulated events are reconstructed with the same algorithm as that used for data. All Pythia v6.428 samples use the PERUGIA2012 [53] set of tuned parameters (tune) for the underlying event, while Pythia v8.186 and Herwig++ showering are run with the A14 [54] and UEEE5 [55] underlying-event tunes, respectively. In-time and out-of-time pileup interactions from the same or nearby bunch-crossings are simulated by overlaying additional pp collisions generated by Pythia v8.186 on the hard-scattering events. Details of the sample generation and normalization are summarized in Table1. Additional samples with different generators and settings are used to estimate systematic uncertainties on the backgrounds, as described in Section6.
The signal samples are normalized using the best cross-sections calculated at NLO in the strong coupling constant, adding the resummation of soft gluon emission at next-to-leading-logarithmic (NLL) accuracy [56–60]. The nominal cross-section and the uncertainty are taken from an envelope of cross-section pre-dictions using different PDF sets and factorization and renormalization scales, as described in Ref. [61]. The cross-section of gluino pair-production in these simplified models is approximately 325 fb for a gluino mass of 1 TeV, falling to 2.8 fb for 1.8 TeV mass gluinos. All background processes are nor-malized to the best available theoretical calculation for their respective cross-sections. The order of this calculation in perturbative QCD (pQCD) for each process is listed in Table1.
4 Object reconstruction
Interaction vertices from the proton–proton collisions are reconstructed from at least two tracks with pT > 0.4 GeV, and are required to be consistent with the beamspot envelope. The primary vertex is
Process Generator Tune PDF set Cross-section
+ fragmentation/hadronization order
t ¯t Powheg-Box v2 PERUGIA2012 CT10 NNLO+NNLL [62]
+ Pythia-6.428
Single top Powheg-Box v2 PERUGIA2012 CT10 NNLO+NNLL [63–65]
+ Pythia-6.428
t ¯tW/t ¯tZ/4-tops MadGraph-2.2.2 A14 NNPDF2.3 [66] NLO
+ Pythia-8.186
t ¯th MadGraph5_aMC@NLO-2.2.1 UEEE5 CT10 NLO [67]
+ Herwig++-2.7.1
Dibosons Sherpa-2.1.1 Default CT10 NLO
WW, WZ, ZZ
W/Z+jets Sherpa-2.1.1 Default CT10 NNLO [68]
Table 1: List of generators used for the different background processes. Information is given about the pQCD
highest-order accuracy used for the normalization of the different samples, the underlying-event tunes and PDF sets
considered.
identified as the one with the largest sum of squares of the transverse momenta from associated tracks (P |pT,track|2) [69].
Basic selection criteria are applied to define candidates for electrons, muons and jets in the event. An overlap removal procedure is applied to these candidates to prevent double-counting. Further require-ments are then made to select the final signal leptons and jets from the remaining objects. The details of the object selections and of the overlap removal procedure are given below.
Candidate jets are reconstructed from three-dimensional topological energy clusters [70] in the calori-meter using the anti-kt jet algorithm [71] with a radius parameter of 0.4 (small-R jets). Each topological cluster is calibrated to the electromagnetic scale response prior to jet reconstruction. The reconstructed jets are then calibrated to the particle level by the application of a jet energy scale (JES) derived from simulation and corrections based on 8 TeV data [72, 73]. Quality criteria are imposed to reject events that contain at least one jet arising from non-collision sources or detector noise [74]. Further selections are applied to reject jets that originate from pileup interactions [75]. Candidate jets are required to have pT > 20 GeV and |η| < 2.8. Signal jets, selected after resolving overlaps with electrons and muons, are required to satisfy the stricter requirement of pT> 30 GeV.
A multivariate algorithm using information about the impact parameters of inner detector tracks matched to the jet, the presence of displaced secondary vertices, and the reconstructed flight paths of b- and c-hadrons inside the jet [76–78] is used to tag b-jets. The b-tagging working point with an 85% efficiency, as determined from a simulated sample of t¯t events, was found to be optimal. The corresponding rejection factors against jets originating from c-quarks, from τ-leptons and from light quarks and gluons in the same sample at this working point are 2.6, 3.8 and 27, respectively.
The candidate small-R jets are used as inputs for further jet re-clustering [19] using the anti-kt algorithm with a radius parameter of 1.0. These re-clustered jets are then trimmed [18,19] by removing subjets whose pT falls below fcut = 5% of the pT of the original re-clustered jet. The resulting large-R jets are
used to tag high-pTboosted top quarks in the event. Selected large-R jets are required to have pT> 300 GeV and to have |η| < 2.0. A large-R jet is tagged as a top candidate if it has a mass above 100 GeV. When it is not explicitly stated otherwise, the term “jets” in this paper refers to small-R jets.
Electron candidates are reconstructed from energy clusters in the electromagnetic calorimeter and inner detector tracks and are required to satisfy a set of “loose” quality criteria [79–81]. They are also required to have |η| < 2.47. Muon candidates are reconstructed from matching tracks in the inner detector and in the muon spectrometer. They are required to meet “medium” quality criteria, as described in Refs. [82, 83] and to have |η| < 2.5. All electron and muon candidates must have pT > 20 GeV and survive the overlap removal procedure. Signal leptons are chosen from the candidates with the following isolation requirement – the scalar sum of pTof additional inner detector tracks in a cone around the lepton track is required to be <5% of the lepton pT. The angular separation between the lepton and the b-jet ensuing from a semileptonic top quark decay narrows as the pTof the top quark increases. This increased collimation is accounted for by varying the radius of the isolation cone as max(0.2, 10/plep
T ), where p lep
T is the lepton pT expressed in GeV. Signal electrons are further required to meet the “tight” quality criteria, while signal muons are required to satisfy the same “medium” quality criteria as the muon candidates. Electrons (muons) are matched to the primary vertex by requiring the transverse impact parameter d0 to satisfy |d0|/σ(d0) < 5 (3), where σ(d0) is the measured uncertainty in d0, and the longitudinal impact parameter z0 to satisfy |z0sin θ| < 0.5 mm. In addition, events containing one or more muon candidates with |d0| (|z0|) > 0.2 mm (1 mm) are rejected to suppress cosmic rays.
The overlap removal procedure between muon and jet candidates is designed to remove those muons that are likely to have originated from the decay of hadrons and to retain the overlapping jet. Jets and muons may also appear in close proximity when the jet results from high-pTmuon bremsstrahlung, and in such cases the jet should be removed and the muon retained. Such jets are characterized by having very few matching inner detector tracks. Therefore, if the angular distance∆R between a muon and a jet is within min(0.4, 0.04+ 10 GeV/pT) of the axis of a jet,4 the muon is removed only if the jet has ≥3 matching inner detector tracks. If the jet has fewer than three matching tracks, the jet is removed and the muon is kept [84]. Overlap removal between electron and jet candidates aims to remove jets that are formed primarily from the showering of a prompt electron and to remove electrons that are produced in the decay chains of hadrons. Since electron showers within the cone of a jet contribute to the measured energy of the jet, any overlap between an electron and the jet must be fully resolved. A pT-dependent cone for the purpose of this overlap removal is thus impractical. Consequently, any non-b-tagged jet whose axis lies∆R < 0.2 from an electron is discarded. If the electron is within ∆R = 0.4 of the axis of any jet remaining after this initial overlap removal procedure, the jet is retained and the electron is removed. Finally, electron candidates that lie∆R < 0.01 from muon candidates are removed to suppress contributions from muon bremsstrahlung.
The missing transverse momentum (ETmiss) in the event is defined as the magnitude of the negative vec-tor sum transverse momentum ( ~pTmiss) of all selected and calibrated objects in the event, with an extra term added to account for soft energy that is not associated to any of the selected objects. This soft term is calculated from inner detector tracks matched to the primary vertex to make it more resilient to contamination from pileup interactions [85,86] .
Corrections derived from data control samples are applied to simulated events to account for differences between data and simulation in the reconstruction efficiencies, momentum scale and resolution of leptons [80–82,87] and in the efficiency and false positive rate for identifying b-jets [77,78].
5 Event selection
The event selection criteria are defined based on kinematic requirements on the objects defined in Sec-tion4and on the following event variables.
Two effective mass variables are used, which would typically have much higher values in pair-produced gluino events than in background events. The Gtt signal regions employ the inclusive effective mass mincleff : mincleff =X i pTjeti + X j pT`j + EmissT ,
where the first and second sums are over the signal jets and leptons, respectively. The signal regions for the Gbb models, for which four high-pTb-jets are expected, are defined using m4jeff:
m4jeff =X i≤4
pTjeti+ ETmiss,
where the sum is over the four highest-pT (leading) signal jets in the event.
In regions with at least one signal lepton, the transverse mass mTof the leading signal lepton (`) and ETmiss is used to discriminate between the signal and backgrounds from semileptonic t¯t and W+jets events:
mT = q
2p`TEmissT {1 − cos[∆φ( ~pTmiss, `)]}.
Neglecting resolution effects, mT is bounded from above by the W boson mass for these backgrounds and typically has higher values for Gtt events. Another useful transverse mass variable is mb−jetsT,min, the minimum transverse mass formed by EmissT and any of the three leading b-tagged jets in the event:
mb−jetsT,min = mini≤3 q 2pb−jeti T E miss T {1 − cos[∆φ( ~pT miss, b−jet i)]} ! .
It is bounded below the top quark mass for semileptonic t¯t events while peaking at higher values for Gbb and Gtt events.
The signal regions require either zero or at least one lepton. The requirement of a signal lepton, with the additional requirements on jets, EmissT and event variables described in Section5.1, render the multijet background negligible for the ≥ 1-lepton signal regions. For the 0-lepton signal regions, the minimum azimuthal angle between ~pTmiss and the leading four small-R jets in the event, ∆φ4jmin, is required to be greater than 0.4:
∆φ4j
min= min(|φjet1 −φp~Tmiss|, ..., |φjet4 −φp~Tmiss|) > 0.4.
This requirement ensures that the multijet background, which can produce large EmissT if containing poorly measured jets or neutrinos emitted close to the axis of a jet, is also negligible in the 0-lepton signal regions (along with the other requirements on jets, ETmissand event variables described in Section5.1).
Figure2shows the kinematic distributions of EmissT , mincleff , mb−jetsT,min and mT for a preselection that requires ETmiss > 200 GeV, at least four signal jets of which at least three must be b-tagged, and ∆φ4jmin > 0.4. Figure3 shows the multiplicity of signal jets, b-tagged signal jets, top-tagged large-R jets and signal leptons in the preselection. Good agreement between data and simulation is observed. Example signal models with enhanced cross-sections are overlaid for comparison.
Events / 50 GeV 1 10 2 10 3 10 4 10 5 10 ATLAS -1 = 13 TeV, 3.2 fb s Pre-selection Data 2015 Total background t t Single top + W/Z t t Z+jets W+jets Others 100) × = 1700, 200 ( 0 1 χ∼ , m g ~ Gbb: m 100) × = 1700, 200 ( 0 1 χ∼ , m g ~ Gtt: m [GeV] miss T E 200 300 400 500 600 700 800 Data / SM 0 1 2 (a) Events / 200 GeV 1 10 2 10 3 10 4 10 5 10 ATLAS -1 = 13 TeV, 3.2 fb s Pre-selection Data 2015 Total background t t Single top + W/Z t t Z+jets W+jets Others 100) × = 1700, 200 ( 0 1 χ∼ , m g ~ Gbb: m 100) × = 1700, 200 ( 0 1 χ∼ , m g ~ Gtt: m [GeV] incl eff m 500 1000 1500 2000 2500 3000 Data / SM 0 1 2 (b) Events / 25 GeV 1 10 2 10 3 10 4 10 5 10 ATLAS -1 = 13 TeV, 3.2 fb s Pre-selection Data 2015 Total background t t Single top + W/Z t t Z+jets W+jets Others 100) × = 1700, 200 ( 0 1 χ∼ , m g ~ Gbb: m 100) × = 1700, 200 ( 0 1 χ∼ , m g ~ Gtt: m [GeV] b-jets T,min m 0 50 100 150 200 250 300 350 400 Data / SM 0 1 2 (c) Events / 25 GeV 1 10 2 10 3 10 4 10 ATLAS -1 = 13 TeV, 3.2 fb s 1 lepton ≥ Pre-selection with Data 2015 Total background t t Single top + W/Z t t Z+jets W+jets Others 100) × = 1700, 200 ( 0 1 χ∼ , m g ~ Gtt: m ) [GeV] miss T (lepton,E T m 0 100 200 300 400 500 600 Data / SM 0 1 2 (d)
Figure 2: Distributions of kinematic variables in the preselection region described in the text: (a) EmissT , (b) mincleff ,
(c) mb−jetsT,min, and (d) mT (for preselected events with at least one signal lepton). The statistical and experimental
systematic uncertainties are included in the uncertainty band, where the systematic uncertainties are defined in
Section6. The lower part of each figure shows the ratio of data to the background prediction. All backgrounds
(including t¯t) are normalized using the best available theoretical calculation described in Section3. The background
category “Others” includes t¯th, t¯tt¯t and diboson events. Example signal models with cross-sections enhanced by a factor of 100 are overlaid for comparison.
Events 1 10 2 10 3 10 4 10 5 10 ATLAS -1 = 13 TeV, 3.2 fb s Pre-selection Data 2015 Total background t t Single top + W/Z t t Z+jets W+jets Others 100) × = 1700, 200 ( 0 1 χ∼ , m g ~ Gbb: m 100) × = 1700, 200 ( 0 1 χ∼ , m g ~ Gtt: m > 30 GeV T Number of jets with p
4 5 6 7 8 9 10 11 12 13 14 Data / SM 0 1 2 (a) Events 1 10 2 10 3 10 4 10 5 10 6 10 ATLAS -1 = 13 TeV, 3.2 fb s Pre-selection Data 2015 Total background t t Single top + W/Z t t Z+jets W+jets Others 100) × = 1700, 200 ( 0 1 χ∼ , m g ~ Gbb: m 100) × = 1700, 200 ( 0 1 χ∼ , m g ~ Gtt: m > 30 GeV T Number of b-tagged jets with p
3 4 5 6 7 Data / SM 0 1 2 (b) Events 1 10 2 10 3 10 4 10 5 10 6 10 ATLAS -1 = 13 TeV, 3.2 fb s Pre-selection Data 2015 Total background t t Single top + W/Z t t Z+jets W+jets Others 100) × = 1700, 200 ( 0 1 χ∼ , m g ~ Gbb: m 100) × = 1700, 200 ( 0 1 χ∼ , m g ~ Gtt: m
Number of top-tagged jets
0 1 2 3 4 Data / SM 0 1 2 (c) Events 1 10 2 10 3 10 4 10 5 10 6 10 ATLAS -1 = 13 TeV, 3.2 fb s Pre-selection Data 2015 Total background t t Single top + W/Z t t Z+jets W+jets Others 100) × = 1700, 200 ( 0 1 χ∼ , m g ~ Gbb: m 100) × = 1700, 200 ( 0 1 χ∼ , m g ~ Gtt: m
Number of signal leptons
0 1 2 3
Data / SM 0
1 2
(d)
Figure 3: Distributions of the number of: (a) signal jets, (b) b-tagged jets, (c) top-tagged large-R jets, and (d) signal leptons in the preselection region described in the text. The statistical and experimental systematic uncertainties
are included in the uncertainty band, where the systematic uncertainties are defined in Section6. The lower part
of each figure shows the ratio of data to the background prediction. All backgrounds (including t¯t) are normalized
using the best available theoretical calculation described in Section3. The background category “Others” includes
t¯th, t¯tt¯t and diboson events. Example signal models with cross-sections enhanced by a factor of 100 are overlaid for comparison.
5.1 Signal regions
The signal regions are designed by optimizing the expected signal discovery reach for the 2015 dataset. They are defined in the leftmost column of Tables2,3and4for the Gbb, Gtt 0-lepton and Gtt 1-lepton channels, respectively, and are discussed below. These tables also contain the definition of the control regions used to normalize the t¯t background, discussed in Section5.2, and the validation regions used to cross-check the background estimate and which are discussed in Section5.3. The following region nomenclature is used in the remainder of the paper. Signal, control and validation region names start with the prefix “SR”, “CR” and “VR”, respectively, and with the type of validation region specified for the Gtt validation regions. The name of the region is completed by the type of model targeted and a letter corresponding to the level of mass splitting between the gluino and the LSP. For example the validation region that cross-checks the extrapolation over mT for the Gtt 1-lepton region A is denoted by “VR-mT -Gtt-1L-A”.
The experimental signature for the Gbb model is characterized by four high-pTb-jets, large ETmissand no leptons (Figure1(a)). The following requirements are applied to all Gbb signal regions. Events containing a candidate lepton are vetoed and at least four signal small-R jets are required, of which at least three must be b-tagged. The remaining multijet background is rejected by requiring∆φ4jmin > 0.4. The Gbb signal regions are described in the leftmost column of Table2. The three signal regions A, B and C are designed to cover Gbb models with large (& 1 TeV), moderate (between ≈ 200 GeV and ≈ 1 TeV) and small (. 200 GeV) mass splittings between the gluino and the LSP, respectively. All regions feature stringent cuts on ETmiss, m4jeffand the jet transverse momentum pTjet.
The experimental signature for the Gtt model is characterized by several high-pT jets of which four are b-jets, large EmissT and potentially leptons (Figure1(b)). The Gtt signal regions are classified into regions with a signal lepton veto (0-lepton channel) and regions with at least one signal lepton (1-lepton channel). The Gtt 0-lepton signal regions are defined in the leftmost column of Table3. In all Gtt 0-lepton signal regions at least eight signal jets,∆φ4jmin > 0.4 and mb−jetsT,min > 80 GeV are required. Three Gtt 0-lepton signal regions are defined to cover Gtt models with decreasing mass splitting between the gluino and the sum of the mass of the two top quarks and the LSP: A (& 1 TeV), B (between ≈ 200 GeV and ≈ 1 TeV) and C (. 200 GeV). In the large and moderate mass splitting scenarios, the top quarks tend to have a large pT, and at least one top-tagged large-R jet is required (Ntop ≥ 1). The requirements on EmissT and mincleff decrease with the mass splitting between the gluino and the LSP. However, the required number of b-tagged jets Nb−jetis tightened to four for the lower mass splitting regions B and C in order to maintain a high background rejection despite the softer signal kinematics.
The Gtt 1-lepton signal regions are defined in the leftmost column of Table4. Two signal regions A and B are defined to cover Gtt models with decreasing mass difference between the gluino and the LSP. In all signal regions at least one signal lepton, at least six signal jets (pTjet > 30 GeV) and mT > 150 GeV are required. Region A has tighter requirements on mincleff (mincleff > 1100 GeV) and the number of top-tagged large-R jets (Ntop ≥ 1). Region B has a softer requirement on mincleff than region A, but it features a tighter cut on EmissT to achieve a satisfactory background rejection without requiring a top-tagged large-R jet.
5.2 Background estimation and t ¯t control regions
The largest background in all signal regions is t¯t produced with additional high-pTjets. The other relevant backgrounds are t¯tW, t¯tZ, t¯tt¯t, t¯th, single-top, W+jets, Z+jets and diboson events. All of these smaller
Criteria common to all Gbb regions: ≥ 4 signal jets, ≥ 3 b-tagged jets
Variable Signal region Control region Validation region
Criteria common to all regions of the
same type NCandidate Lepton = 0 − = 0 NSignal Lepton − = 1 − ∆φ4j min > 0.4 − > 0.4 mb−jetsT,min − − < 160 mT − < 150 − Region A (Large mass splitting)
pTjet > 90 > 90 > 90
EmissT > 350 > 250 > 250
m4jeff > 1600 > 1200 < 1400
Region B
(Moderate mass splitting)
pTjet > 90 > 90 > 90
EmissT > 450 > 300 > 300
m4jeff > 1400 > 1000 < 1400
Region C (Small mass splitting)
pTjet > 30 > 30 > 30
EmissT > 500 > 400 > 400
m4jeff > 1400 > 1200 < 1400
Table 2: Definitions of the Gbb signal, control and validation regions. The unit of all kinematic variables is GeV
except∆φ4jmin, which is in radians. The jet pTrequirement is also applied to b-tagged jets.
backgrounds are estimated with the simulated event samples normalized to the best available theory cal-culations described in Section3. The multijet background is estimated to be negligible in all regions. For each signal region, the t¯t background is normalized in a dedicated control region. The t¯t normalization factor required for the total predicted yield to match the data in the control region is used to normalize the t¯tbackground in the signal region. The control regions are designed to be dominated by t¯t events and to have negligible signal contamination, while being kinematically as close as possible to the corresponding signal region. The latter requirement minimizes the systematic uncertainties associated with extrapolating the normalization factors from the control to the signal regions.
The definitions of the control regions are shown next to the signal regions in Tables2,3and4for the Gbb, Gtt 0-lepton and Gtt 1-lepton channels, respectively. In both the Gbb and Gtt 0-lepton channels, exactly one signal lepton is required. This is motivated by background composition studies using simulated events which show that semileptonic t¯t events, for which the lepton is outside the acceptance or is a hadronically decaying τ-lepton, dominate the t¯t yield in the signal regions. An upper cut on mT is then applied to ensure orthogonality with the Gtt 1-lepton signal regions and to suppress signal contamination. The jet multiplicity requirement is reduced to seven jets in the Gtt 0-lepton control regions (from eight jets in the
Criteria common to all Gtt 0-lepton regions: pTjet> 30 GeV
Variable Signal region Control region VR1L VR0L
Criteria common to all regions of the
same type NSignal Lepton = 0 = 1 = 1 = 0 ∆φ4j min > 0.4 − − > 0.4 Njet ≥ 8 ≥ 7 ≥ 7 ≥ 8 mb−jetsT,min > 80 − > 80 < 80 mT − < 150 < 150 − Region A (Large mass splitting)
EmissT > 400 > 250 > 250 > 200
mincleff > 1700 > 1350 > 1350 > 1400
Nb−tag ≥ 3 ≥ 3 ≥ 3 ≥ 2
Ntop ≥ 1 ≥ 1 ≥ 1 ≥ 1
Region B
(Moderate mass splitting)
EmissT > 350 > 200 > 200 > 200
mincleff > 1250 > 1000 > 1000 > 1100
Nb−tag ≥ 4 ≥ 4 ≥ 4 ≥ 3
Ntop ≥ 1 ≥ 1 ≥ 1 ≥ 1
Region C (Small mass splitting)
EmissT > 350 > 200 > 200 > 200
mincleff > 1250 > 1000 > 1000 > 1250
Nb−tag ≥ 4 ≥ 4 ≥ 4 ≥ 3
Table 3: Definitions of the Gtt 0-lepton signal, control and validation regions. The unit of all kinematic variables is
GeV except∆φ4jmin, which is in radians. The jet pTrequirement is also applied to b-tagged jets.
signal regions), to accept more events and to obtain a number of jets from top quark decay and parton shower similar to that in the signal region. Approximately 40–60% of the signal region events contain a hadronically decaying tau-lepton that is counted as a jet. Orthogonality between Gtt 0-lepton and Gtt 1-lepton control regions is ensured by requiring exactly six jets in the Gtt 1-lepton control regions (as opposed to the requirement of at least six jets in the signal regions). For all Gbb and Gtt 0-lepton control regions, the number of b-tagged jets and top-tagged large-R jets is consistent with the signal region. The requirements on EmissT and meff are, however, relaxed in the control regions to achieve a sufficiently large t¯tyield and small signal contamination (. 15%). The Gtt 1-lepton control regions are defined by inverting the mT cut and removing the mb−jetsT,min requirement. All other requirements are exactly the same as for the signal regions.
Criteria common to all Gtt 1-lepton regions: ≥ 1 signal lepton, pTjet> 30 GeV Variable Signal region Control region VR-mT VR-mb−jetsT,min Criteria common
to all regions of the same type mT > 150 < 150 > 150 < 150 Njet ≥ 6 = 6 ≥ 5 ≥ 6 Nb−tag ≥ 3 ≥ 3 = 3 = 3 Region A (Large mass splitting) EmissT > 200 > 200 > 200 > 200 mincleff > 1100 > 1100 > 600 > 600 mb−jetsT,min > 160 − < 160 > 140 Ntop ≥ 1 ≥ 1 ≥ 1 ≥ 1 Region B (Moderate to small mass splitting) EmissT > 300 > 300 > 200 > 200 mincleff > 900 > 900 > 600 > 600 mb−jetsT,min > 160 − < 160 > 160
Table 4: Definitions of the Gtt 1-lepton signal, control and validation regions. The unit of all kinematic variables is
GeV. The jet pTrequirement is also applied to b-tagged jets.
5.3 Validation regions
Validation regions are defined to cross-check the background prediction in regions that are kinematically close to the signal regions but yet have a small signal contamination. They are designed primarily to cross-check the assumption that the t¯t normalization extracted from the control regions can be accurately extrapolated to the signal regions. Their requirements are shown in the rightmost column(s) of Tables2, 3and4for the Gbb, Gtt 0-lepton and Gtt 1-lepton channels, respectively. Their signal contamination is less than approximately 30% for the majority of Gbb and Gtt model points not excluded in Run 1. One validation region per signal region is defined for the Gbb model. They feature the same requirements as their corresponding signal region except that upper cuts are applied on mb−jetsT,min and m4jeff to reduce signal contamination and ensure orthogonality with the signal regions. In addition the requirement on EmissT is relaxed to obtain a sufficient t¯t yield.
For the Gtt 0-lepton channel, two validation regions per signal region are defined, one requiring exactly one signal lepton (VR1L) and one with a signal lepton veto (VR0L). The regions VR1L have exactly the same criteria as their corresponding control regions except that they require mb−jetsT,min > 80 GeV, similarly to the signal regions, in order to test the extrapolation over mb−jetsT,min between the control and the signal regions. Simulation studies show that the heavy-flavor fraction of the additional jets in the t¯t+jets events (i.e. t¯t+ b¯b and t¯t+ c¯c), which suffers from large theoretical uncertainties, is similar in the signal, control and VR1L regions. This is achieved by requiring the same number of b-tagged jets for all three types of regions.
While the theoretical uncertainties in the heavy-flavor fraction of the additional jets in the t¯t+jets events (i.e. t¯t+ b¯b and t¯t+ c¯c) are large, they affect signal, control and the 1-lepton validation regions in a similar way, and are thus largely canceled in the semi-data-driven t¯t normalization based on the observed control region yields.
The VR0L regions have similar requirements on their corresponding signal regions except that the re-quirements on ETmiss, mincleff and the number of b-tagged jets are loosened to achieve sufficient event yields. Furthermore, the criterion mb−jetsT,min < 80 GeV is applied to all VR0L regions to ensure orthogonality with the signal regions. The regions VR0L test the extrapolation of the t¯t normalization from a 1-lepton to a 0-lepton region. Simulation studies show that the VR0L regions have a composition of semileptonic t¯t events (in particular of hadronically decaying τ-leptons) similar to that in the signal regions, while the control and VR1L regions are by construction dominated by semileptonic t¯t events with a muon or an electron.
Two requirements are different between Gtt 1-lepton control regions and their corresponding signal re-gions: the requirement on mb−jetsT,min (absent in the control regions) and the requirement on mT(inverted in the control regions). Therefore, two validation regions per signal region are defined for the Gtt 1-lepton chan-nel, VR-mTand VR-mb−jetsT,min, which respectively test, one at a time, the extrapolations over mTand mb−jetsT,min. Exactly three b-tagged jets are required for all 1-lepton validation regions to limit the signal contamina-tion and to be close to the signal regions. For the VR-mT regions, the same requirement mT > 150 GeV as in the signal region is applied but the criterion on mb−jetsT,min is inverted. Other requirements are relaxed to achieve sufficiently large background yields and small signal contamination. For the VR-mb−jetsT,min regions, the signal region requirement on mb−jetsT,min is applied (slightly loosened to 140 GeV instead of 160 GeV in region A) and the criterion on mTis inverted. Again, other requirements are generally relaxed. Simulation studies show that t¯t dilepton events dominate in the signal regions, in particular due to the requirement on mT, while semileptonic t¯t events dominate in the control regions. This extrapolation is cross-checked by the VR-mTregions, which have a t¯t dileptonic fraction similar to that in the signal regions.
6 Systematic uncertainties
The largest sources of detector-related systematic uncertainties in this analysis relate to the jet energy scale (JES), jet energy resolution (JER) and the b-tagging efficiencies and mistagging rates. The JES uncertainties are obtained by extrapolating the uncertainties derived from √s = 8 TeV data and simula-tions to √s= 13 TeV [72]. The uncertainties in the energy scale of the small-R jets are propagated to the re-clustered large-R jets, which use them as inputs. The JES uncertainties are especially important in the Gtt signal regions, since these regions require high jet multiplicities. The impact of these uncertainties on the expected background yields in these regions is between 10% and 25%. Uncertainties in the JER are similarly derived from dijet asymmetry measurements in Run 1 data and extrapolated to √s = 13 TeV. The impact of the JER uncertainties on the background yields are in the range of 1–10%.
Uncertainties in the measured b-tagging efficiencies and mistagging rates are the subleading sources of experimental uncertainties in the Gtt 1-lepton signal regions and the leading source in the Gtt 0-lepton and Gbb regions. Uncertainties measured in √s= 8 TeV data are extrapolated to √s= 13 TeV , with the addition of the new IBL system in Run 2 taken into account. Uncertainties for jet pTabove 300 GeV are estimated using simulated events. The impact of the b-tagging uncertainties on the expected background
yields in the Gbb and Gtt 0-lepton signal regions is around 22–30%, and around 15% in the Gtt 1-lepton signal regions.
The uncertainties associated with lepton reconstruction and energy measurements have very small impact on the final results. All lepton and jet measurement uncertainties are propagated to the calculation of ETmiss, and additional uncertainties are included in the scale and resolution of the soft term. The overall impact of the EmissT soft term uncertainties is also small.
Uncertainties in the modeling of the t¯t background are evaluated using additional samples varied by each systematic uncertainty. Hadronization and parton showering uncertainties are estimated using a sample generated with Powheg and showered by Herwig++ v2.7.1 [44] with the UEEE5 underlying-event tune [55]. Systematic uncertainties in the modeling of initial- and final-state radiation are explored with two alternative settings of Powheg, both of which are showered by Pythia v6.428 as for the nominal sample. The first of these uses the PERUGIA2012radHi tune and has the renormalization and factoriza-tion scales set to twice the nominal value, resulting in more radiafactoriza-tion in the final state. It also has hdamp set to 2mtop. The second sample, using the PERUGIA2012radLo tune, has hdamp = mtop and the renor-malization and factorization scales are set to half of their nominal values, resulting in less radiation in the event. In each case, the uncertainty is taken as the deviation in the expected yield of t¯t background with respect to the nominal sample. The uncertainty due to the choice of generator is estimated by comparing the expected yields obtained using a t¯t sample generated with MadGraph5_aMC@NLO , and one that is generated with Powheg. Both of these samples are showered with Herwig++ v2.7.1. Finally, a 30% uncertainty is assigned to the cross-section of t¯t events with additional heavy-flavor jets in the final state, in accordance with the results of the ATLAS measurement of this cross-section at √s = 8 TeV [88]. Uncertainties in single-top and W/Z+jets background processes are similarly estimated by comparisons between the nominal sample and samples with different generators, showering models and radiation tunes. An additional 5% uncertainty is included in the cross-section of single-top processes [89]. A 50% con-stant uncertainty is assigned to each of the remaining small backgrounds. The variations in the expected background yields due to t¯t modeling uncertainties range between 10% and 30% for the Gbb signal re-gions, and between 47% and 57% in most Gtt signal regions. The impact of the modeling uncertainties for the smaller backgrounds on these yields is consistently below 10% in all signal regions. The uncertain-ties in the cross-sections of signal processes are determined from an envelope of different cross-section predictions, as described in Section3.
The cumulative impact of the systematic uncertainties listed above on the background yields ranges between 23% and 63%, depending on the signal region. The typical impact on the signal yields is in the range 10-30%.
7 Results
The SM background expectation is determined separately in each signal region with a profile likelihood fit [90], referred to as a background-only fit. The fit uses as a constraint the observed event yield in the associated control region to adjust the t¯t normalization, assuming that a signal does not contribute to this yield, and applies that normalization factor to the number t¯t events predicted by simulation in the signal region. The numbers of observed and predicted events in each control region are described by Poisson probability density functions. The systematic uncertainties in the expected values are included in the fit as nuisance parameters. They are constrained by Gaussian distributions with widths corresponding to the sizes of the uncertainties and are treated as correlated, when appropriate, between the various regions.
The product of the various probability density functions forms the likelihood, which the fit maximizes by adjusting the t¯t normalization and the nuisance parameters. The inputs to the fit for each signal region are the number of events observed in its associated control region and the number of events predicted by simulation in each region for all background processes.
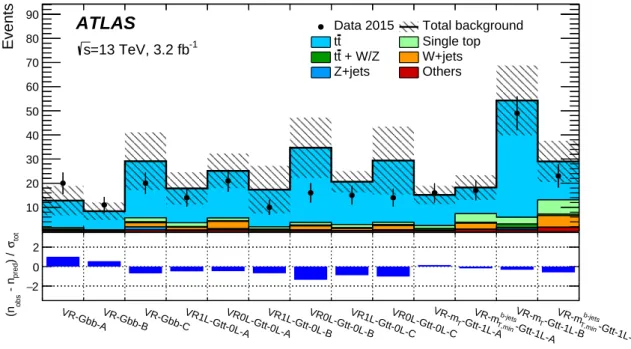
Figure4shows the results of the background-only fit to the control regions, extrapolated to the validation regions. The number of events predicted by the background-only fit is compared to the data in the upper panel. The pull, defined by the difference between the observed number of events (nobs) and the predicted background yield (npred) divided by the total uncertainty (σtot), is shown for each region in the lower panel. No evidence of significant background mismodeling is observed in the validation regions. There is a certain tendency for the predicted background to be above the data, in particular for the Gtt-0L validation regions, but the results in the validations regions of a given channel are not independent. The validation and control regions of different mass splittings can overlap, with the overlap fraction ranging from approximately 30% to 70% for Gtt-0L. Furthermore, the uncertainties in the predicted yield are dominated by the same (correlated) systematic uncertainties.
VR_Gbb_AVR_Gbb_BVR_Gbb_CVR1_Gtt_0l_AVR2_Gtt_0l_AVR1_Gtt_0l_BVR2_Gtt_0l_BVR1_Gtt_0l_CVR2_Gtt_0l_CVR2_Gtt_1l_AVR4_Gtt_1l_AVR2_Gtt_1l_BVR4_Gtt_1l_B
Events 10 20 30 40 50 60 70 80 90
Data 2015 Total background t t Single top + W/Z t t W+jets Z+jets Others -1 =13 TeV, 3.2 fb s ATLAS VR-Gbb-AVR-Gbb-BVR-Gbb-CVR1L-Gtt-0L-AVR0L-Gtt-0L-AVR1L-Gtt-0L-BVR0L-Gtt-0L-BVR1L-Gtt-0L-CVR0L-Gtt-0L-C -Gtt-1L-A T VR-m -Gtt-1L-A b-jets T,min VR-m -Gtt-1L-B T VR-m -Gtt-1L-B b-jets T,min VR-m tot σ ) / pred - n obs (n 2 − 0 2
Figure 4: Results of the likelihood fit extrapolated to the validation regions. The t¯t normalization is obtained from the fit to the control regions. The upper panel shows the observed number of events and the predicted background yield. The background category “Others” includes t¯th, t¯tt¯t and diboson events. The lower panel shows the pulls in each validation region.
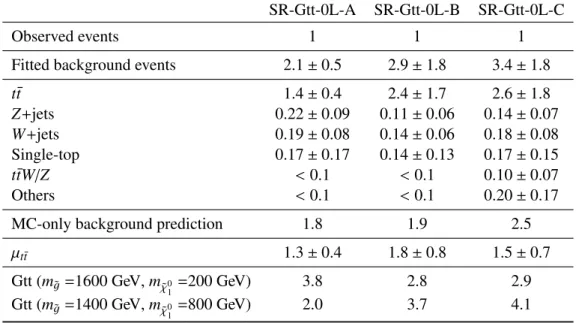
Tables5,6and7show the observed number of events and predicted number of background events from the background-only fit in the Gbb, Gtt 0-lepton and Gtt 1-lepton signal regions, respectively. In addition, the tables show the numbers of signal events expected for some example values of gluino and LSP masses in the Gtt and Gbb models. The event yields in the signal regions are also shown in Figure5, where the pull is shown for each region in the lower panel. No excess is found above the predicted background. The background is dominated by t¯t events in all Gbb and Gtt signal regions. The subdominant contributions in the Gbb and Gtt 0-lepton signal regions are Z(→ νν)+jets and W(→ `ν)+jets events, where for W+jets
events the lepton is a nonidentified electron or muon or is a hadronically decaying τ-lepton. In the Gtt 1-lepton signal regions, the subdominant backgrounds are single-top, t¯tW and t¯tZ.
SR-Gbb-A SR-Gbb-B SR-Gbb-C
Observed events 0 0 5
Fitted background events 1.3 ± 0.4 1.5 ± 0.6 7.6 ± 1.7
t¯t 0.63 ± 0.30 0.9 ± 0.5 4.3 ± 1.5 Z+jets 0.23 ± 0.08 0.23 ± 0.09 1.2 ± 0.5 W+jets 0.17 ± 0.06 0.13 ± 0.05 0.82 ± 0.28 Single-top 0.25 ± 0.14 0.15 ± 0.14 0.65 ± 0.33 t¯tW/Z < 0.1 < 0.1 0.22 ± 0.12 Others < 0.1 < 0.1 0.39 ± 0.22
MC-only background prediction 1.7 1.5 6.7
µt¯t 0.64 ± 0.33 1.0 ± 0.4 1.2 ± 0.4
Gbb (m˜g=1700 GeV, mχ˜01 =200 GeV) 3.8 3.5 4.2
Gbb (m˜g=1400 GeV, mχ˜0
1 =800 GeV) 5.3 7.2 10.5
Table 5: Results of the likelihood fit extrapolated to the Gbb signal regions. The uncertainties shown include all systematic uncertainties. The data in the signal regions are not included in the fit. The row “MC-only background prediction” provides the total background prediction when the t¯t normalization is obtained from a theoretical
calcu-lation [62]. The t¯t normalization factor µt¯tobtained from the corresponding t¯t control region is also provided. The
background category “Others” includes t¯th, t¯tt¯t and diboson events. Expected yields for two example Gbb models are also shown.
Figure6shows the ETmiss distributions in data and simulated samples for SR-Gbb-B, SR-Gtt-0L-C and SR-Gtt-1L-A, after relaxing the EmissT threshold to 200 GeV.
8 Interpretation
Since no significant excess over the expected background from SM processes is observed, the data are used to derive one-sided upper limits at 95% CL. Model-independent limits on the number of beyond-the-SM (Bbeyond-the-SM) events for each signal region are derived with pseudoexperiments using the CLsprescription [91]. They can be translated into upper limits on the visible BSM cross-section (σvis), where σvis is defined as the product of acceptance, reconstruction efficiency and production cross-section. The results are given in Table8, where the observed (S95obs) and expected (S95exp) 95% CL upper limits on the number of BSM events are also provided.
The measurement is used to place exclusion limits on gluino and LSP masses in the Gbb and Gtt simplified models. The results are obtained using the CLsprescription in the asymptotic approximation [92]. The signal contamination in the control regions and the experimental systematic uncertainties in the signal are taken into account for this calculation. For the Gbb models, the results are obtained from the Gbb signal region with the best expected sensitivity at each point of the parameter space of each model. For the Gtt models, the 0- and 1-lepton channels both contribute to the sensitivity, and they are combined in a simultaneous fit to enhance the sensitivity of the analysis. This is performed by considering all possible
SR-Gtt-0L-A SR-Gtt-0L-B SR-Gtt-0L-C
Observed events 1 1 1
Fitted background events 2.1 ± 0.5 2.9 ± 1.8 3.4 ± 1.8
t¯t 1.4 ± 0.4 2.4 ± 1.7 2.6 ± 1.8 Z+jets 0.22 ± 0.09 0.11 ± 0.06 0.14 ± 0.07 W+jets 0.19 ± 0.08 0.14 ± 0.06 0.18 ± 0.08 Single-top 0.17 ± 0.17 0.14 ± 0.13 0.17 ± 0.15 t¯tW/Z < 0.1 < 0.1 0.10 ± 0.07 Others < 0.1 < 0.1 0.20 ± 0.17
MC-only background prediction 1.8 1.9 2.5
µt¯t 1.3 ± 0.4 1.8 ± 0.8 1.5 ± 0.7
Gtt (m˜g=1600 GeV, mχ˜01 =200 GeV) 3.8 2.8 2.9
Gtt (m˜g=1400 GeV, mχ˜0
1 =800 GeV) 2.0 3.7 4.1
Table 6: Results of the likelihood fit extrapolated to the Gtt 0-lepton signal regions. The uncertainties shown in-clude all systematic uncertainties. The data in the signal regions are not inin-cluded in the fit. The row “MC-only background prediction” provides the total background prediction when the t¯t normalization is obtained from a
the-oretical calculation [62]. The t¯t normalization factor µt¯tobtained from the corresponding t¯t control region is also
provided. The category “Others” includes t¯th, t¯tt¯t and diboson events. Expected yields for two example Gtt models are also shown.
SR-Gtt-1L-A SR-Gtt-1L-B
Observed events 2 0
Fitted background events 1.2 ± 0.6 1.2 ± 0.8
t¯t 0.8 ± 0.6 0.8 ± 0.7 Z+jets – < 0.1 W+jets < 0.1 < 0.1 Single-top 0.18 ± 0.14 0.14 ± 0.12 t¯tW/Z 0.14 ± 0.08 0.15 ± 0.09 Others < 0.1 < 0.1
MC-only background prediction 1.3 1.2
µt¯t 0.86 ± 0.28 1.0 ± 0.4
Gtt (m˜g=1600 GeV, mχ˜0
1 =200 GeV) 3.4 3.3
Gtt (m˜g=1400 GeV, mχ˜0
1 =800 GeV) 3.8 4.6
Table 7: Results of the likelihood fit extrapolated to the Gtt 1-lepton signal regions. The uncertainties shown in-clude all systematic uncertainties. The data in the signal regions are not inin-cluded in the fit. The row “MC-only background prediction” provides the total background prediction when the t¯t normalization is obtained from a
the-oretical calculation [62]. The t¯t normalization factor µt¯tobtained from the corresponding t¯t control region is also
provided. The category “Others” includes t¯th, t¯tt¯t and diboson events. Expected yields for two example Gtt models are also shown.
SR_Gbb_A SR_Gbb_B SR_Gbb_C SR_Gtt_0l_A SR_Gtt_0l_B SR_Gtt_0l_C SR_Gtt_1l_A SR_Gtt_1l_B Events 2 4 6 8 10 12
Data 2015 Total background t t Single top + W/Z t t W+jets Z+jets Others -1 =13 TeV, 3.2 fb s ATLAS
SR-Gbb-A SR-Gbb-B SR-Gbb-C SR-Gtt-0L-A SR-Gtt-0L-B SR-Gtt-0L-C SR-Gtt-1L-A SR-Gtt-1L-B
tot σ ) / pred - n obs (n 2 − 0 2
Figure 5: Results of the likelihood fit extrapolated to the signal regions. The data in the signal regions are not included in the fit. The upper panel shows the observed number of events and the predicted background yield. The background category “Others” includes t¯th, t¯tt¯t and diboson events. The lower panel shows the pulls in each signal region.
Signal channel σvis[fb] S95obs S95exp
SR-Gbb-A 0.94 3.0 3.9+1.3−0.7 SR-Gbb-B 0.94 3.0 3.8+1.4−0.8 SR-Gbb-C 1.74 5.6 7.2+2.6−1.8 SR-Gtt-1L-A 1.49 4.8 3.9+1.4−0.5 SR-Gtt-1L-B 0.91 3.0 3.0+1.4−0.0 SR-Gtt-0L-A 1.13 3.6 4.4+1.7−1.0 SR-Gtt-0L-B 1.16 3.7 4.4+1.9−0.9 SR-Gtt-0L-C 1.10 3.5 4.5+2.0−1.2
Table 8: The 95% CL upper limits on the visible cross-section (σvis), defined as the product of acceptance,
re-construction efficiency and production cross-section, and the observed and expected 95% CL upper limits on the
number of BSM events (S95
obsand S
95
[GeV] miss T E 200 300 400 500 600 700 800 Events/ 50 GeV 1 2 3 4 5 6 7 ATLAS -1 = 13 TeV, 3.2 fb s SR-Gbb-B Data 2015 Total background t t Single top + W/Z t t Z+jets W+jets Others = 1700, 200 0 1 χ∼ , m g ~ Gbb: m = 1400, 800 0 1 χ∼ , m g ~ Gbb: m SR (a) [GeV] miss T E 200 300 400 500 600 700 800 Events/ 50 GeV 1 2 3 4 5 6 7 ATLAS -1 = 13 TeV, 3.2 fb s SR-Gtt-0L-C Data 2015 Total background t t Single top + W/Z t t Z+jets W+jets Others = 1600, 200 0 1 χ∼ , m g ~ Gtt: m = 1400, 800 0 1 χ∼ , m g ~ Gtt: m SR (b) [GeV] miss T E 200 300 400 500 600 700 800 Events/ 50 GeV 1 2 3 4 ATLAS -1 = 13 TeV, 3.2 fb s SR-Gtt-1L-A Data 2015 Total background t t Single top + W/Z t t Z+jets W+jets Others = 1600, 200 0 1 χ∼ , m g ~ Gtt: m = 1400, 800 0 1 χ∼ , m g ~ Gtt: m SR (c)
Figure 6: Distributions of Emiss
T for (a) SR-Gbb-B, (b) SR-Gtt-0L-C and (c) SR-Gtt-1L-A. The E
miss
T threshold is
set to 200 GeV for these plots, with the red lines indicating the threshold values in the actual signal regions for
SR-Gbb-B and SR-Gtt-0L-C (the Emiss
T threshold in SR-Gtt-1L-A is 200 GeV). The statistical and experimental
permutations between the three Gtt 0-lepton and the two Gtt 1-lepton signal regions for each point of the parameter space, and the best expected combination is used. The 95% CL observed and expected exclusion limits for the Gbb and Gtt models are shown in the LSP and gluino mass plane in Figures7(a) and (b), respectively. The ±1σSUSYtheorylines around the observed limits are obtained by changing the SUSY cross-section by one standard deviation (±1σ), as described in Section3. The yellow band around the expected limit shows the ±1σ uncertainty, including all statistical and systematic uncertainties except the theoretical uncertainties in the SUSY cross-section. It has been checked that the observed exclusion limits obtained from pseudoexperiments differ by less than 25 GeV from the asymptotic approximation in gluino or LSP mass in the combined limits in Figure7, although the difference can be up to 50 GeV when using single analysis regions. The two methods of computation produce equivalent expected limits. For the Gbb models, gluinos with masses below 1.78 TeV are excluded at 95% CL for LSP masses below 800 GeV. At high gluino masses, the exclusion limits are driven by the SR-Gbb-A and SR-Gbb-B signal regions. The best exclusion limit on the LSP mass is approximately 1.0 TeV, which is reached for a gluino mass of approximately 1.6 TeV. The exclusion limit is dominated by SR-Gbb-C for high LSP masses. For the Gtt models, gluino masses up to 1.8 TeV are excluded for massless LSP. For LSP masses below 700 GeV, gluino masses below 1.76 TeV are excluded. For large gluino masses, the exclusion limits are driven by the combination of SR-Gtt-1L-B and SR-Gtt-0L-A. The LSP exclusion extends up to approximately 975 GeV, corresponding to a gluino mass of approximately 1.5 TeV–1.6 TeV. The best exclusion limits are obtained by the combination of SR-Gtt-1L-B and SR-Gtt-0L-C for high LSP masses. The ATLAS exclusion limits obtained with the full √s = 8 TeV dataset are also shown in Figure7. The current results largely improve on the √s = 8 TeV limits despite the lower integrated luminosity. The exclusion limit on the gluino mass is extended by approximately 500 GeV and 400 GeV for the Gbb and Gtt models for massless LSP, respectively. This improvement is primarily attributable to the increased center-of-mass energy of the LHC. The addition of the IBL pixel layer in Run 2, which improves the capability to tag b-jets [30], also particularly benefits this analysis that employs a dataset requiring at least three b-tagged jets. The sensitivity of the data analysis is also improved with respect to the √s= 8 TeV analysis [17] by using top-tagged large-R jets, lepton isolation adapted to a busy environment, and the mb−jetsT,min variable.
9 Conclusion
A search for pair-produced gluinos decaying via sbottom or stop is presented. LHC proton–proton colli-sion data from the full 2015 data-taking period were analyzed, corresponding to an integrated luminosity of 3.2 fb−1 collected at √s = 13 TeV by the ATLAS detector. Several signal regions are designed for different scenarios of gluino and LSP masses. They require several high-pT jets, of which at least three must be b-tagged, large EmissT and either zero or at least one charged lepton. For the gluino models with stop-mediated decays in which there is a large mass difference between the gluino and the LSP, large-R jets identified as originating from highly boosted top quarks are employed. The background is dominated by t¯t+jets, which is normalized in dedicated control regions. No excess is found above the predicted background of each signal region. Model-independent limits are set on the visible cross-section for new physics processes. Exclusion limits are set on gluino and LSP masses in the simplified gluino mod-els with stop-mediated and sbottom-mediated decays. For LSP masses below approximately 700 GeV, gluino masses of less than 1.78 TeV and 1.76 TeV are excluded at the 95% CL for the gluino models with sbottom-mediated and stop-mediated decays, respectively. These results significantly extend the exclusion limits obtained with the √s= 8 TeV dataset.
) [GeV] g ~ m( 1000 1200 1400 1600 1800 2000 ) [GeV] 1 0 χ∼ m( 0 200 400 600 800 1000 1200 1400 1600 -1 ATLAS 8 TeV, 20.1 fb ) exp σ 1 ± Expected limit ( ) theory SUSY σ 1 ± Observed limit ( b + 2m 0 1 χ ∼ < m g ~ m ) g ~ ) >> m( q ~ , m( 0 1 χ∼ + b b → g ~ production, g ~ g ~ All limits at 95% CL ATLAS -1 =13 TeV, 3.2 fb s -1 ATLAS 8 TeV, 20.1 fb ) exp σ 1 ± Expected limit ( ) theory SUSY σ 1 ± Observed limit ( (a) ) [GeV] g ~ m( 1000 1200 1400 1600 1800 2000 ) [GeV] 1 0 χ∼ m( 0 200 400 600 800 1000 1200 1400 1600 -1 ATLAS 8 TeV, 20.1 fb ) exp σ 1 ± Expected limit ( ) theory SUSY σ 1 ± Observed limit ( t + 2m 0 1 χ ∼ < m g ~ m ) g ~ ) >> m( q ~ , m( 0 1 χ∼ + t t → g ~ production, g ~ g ~ All limits at 95% CL ATLAS -1 =13 TeV, 3.2 fb s -1 ATLAS 8 TeV, 20.1 fb ) exp σ 1 ± Expected limit ( ) theory SUSY σ 1 ± Observed limit ( (b)
Figure 7: Exclusion limits in the ˜χ01and ˜g mass plane for the (a) Gbb and (b) Gtt models. The dashed and solid bold
lines show the 95% CL expected and observed limits, respectively. The shaded bands around the expected limits show the impact of the experimental and background theoretical uncertainties. The dotted lines show the impact on the observed limit of the variation of the nominal signal cross-section by ±1σ of its theoretical uncertainty. The
95% CL observed limits from the √s = 8 TeV ATLAS search requiring at least three b-tagged jets [17] are also
shown.
Acknowledgments
We thank CERN for the very successful operation of the LHC, as well as the support staff from our institutions without whom ATLAS could not be operated efficiently.
We acknowledge the support of ANPCyT, Argentina; YerPhI, Armenia; ARC, Australia; BMWFW and FWF, Austria; ANAS, Azerbaijan; SSTC, Belarus; CNPq and FAPESP, Brazil; NSERC, NRC and CFI, Canada; CERN; CONICYT, Chile; CAS, MOST and NSFC, China; COLCIENCIAS, Colombia; MSMT CR, MPO CR and VSC CR, Czech Republic; DNRF and DNSRC, Denmark; IN2P3-CNRS, CEA-DSM/IRFU, France; GNSF, Georgia; BMBF, HGF, and MPG, Germany; GSRT, Greece; RGC, Hong Kong SAR, China; ISF, I-CORE and Benoziyo Center, Israel; INFN, Italy; MEXT and JSPS, Japan; CNRST, Morocco; FOM and NWO, Netherlands; RCN, Norway; MNiSW and NCN, Poland; FCT, Por-tugal; MNE/IFA, Romania; MES of Russia and NRC KI, Russian Federation; JINR; MESTD, Serbia; MSSR, Slovakia; ARRS and MIZŠ, Slovenia; DST/NRF, South Africa; MINECO, Spain; SRC and Wallenberg Foundation, Sweden; SERI, SNSF and Cantons of Bern and Geneva, Switzerland; MOST, Taiwan; TAEK, Turkey; STFC, United Kingdom; DOE and NSF, United States of America. In addition, individual groups and members have received support from BCKDF, the Canada Council, CANARIE, CRC, Compute Canada, FQRNT, and the Ontario Innovation Trust, Canada; EPLANET, ERC, FP7, Ho-rizon 2020 and Marie Skłodowska-Curie Actions, European Union; Investissements d’Avenir Labex and Idex, ANR, Région Auvergne and Fondation Partager le Savoir, France; DFG and AvH Foundation, Ger-many; Herakleitos, Thales and Aristeia programmes co-financed by EU-ESF and the Greek NSRF; BSF, GIF and Minerva, Israel; BRF, Norway; Generalitat de Catalunya, Generalitat Valenciana, Spain; the Royal Society and Leverhulme Trust, United Kingdom.
The crucial computing support from all WLCG partners is acknowledged gratefully, in particular from CERN and the ATLAS Tier-1 facilities at TRIUMF (Canada), NDGF (Denmark, Norway, Sweden),
CC-IN2P3 (France), KIT/GridKA (Germany), INFN-CNAF (Italy), NL-T1 (Netherlands), PIC (Spain), ASGC (Taiwan), RAL (UK) and BNL (USA) and in the Tier-2 facilities worldwide.
References
[1] Yu. A. Golfand and E. P. Likhtman,
Extension of the Algebra of Poincare Group Generators and Violation of p Invariance, JETP Lett. 13 (1971) 323–326, [Pisma Zh. Eksp. Teor. Fiz. 13 (1971) 452].
[2] D. V. Volkov and V. P. Akulov, Is the Neutrino a Goldstone Particle?, Phys. Lett. B 46 (1973) 109–110.
[3] J. Wess and B. Zumino, Supergauge Transformations in Four-Dimensions, Nucl. Phys. B 70 (1974) 39–50.
[4] J. Wess and B. Zumino, Supergauge Invariant Extension of Quantum Electrodynamics, Nucl. Phys. B 78 (1974) 1.
[5] S. Ferrara and B. Zumino, Supergauge Invariant Yang-Mills Theories, Nucl. Phys. B 79 (1974) 413.
[6] A. Salam and J. A. Strathdee, Supersymmetry and Nonabelian Gauges, Phys. Lett. B 51 (1974) 353–355.
[7] G. R. Farrar and P. Fayet, Phenomenology of the Production, Decay, and Detection of New Hadronic States Associated with Supersymmetry,Phys. Lett. B 76 (1978) 575–579. [8] N. Sakai, Naturalness in Supersymmetric Guts,Z. Phys. C 11 (1981) 153.
[9] S. Dimopoulos, S. Raby and F. Wilczek, Supersymmetry and the Scale of Unification, Phys. Rev. D 24 (1981) 1681–1683.
[10] L. E. Ibanez and G. G. Ross, Low-Energy Predictions in Supersymmetric Grand Unified Theories, Phys. Lett. B 105 (1981) 439.
[11] S. Dimopoulos and H. Georgi, Softly Broken Supersymmetry and SU(5), Nucl. Phys. B 193 (1981) 150.
[12] R. Barbieri and G. F. Giudice, Upper Bounds on Supersymmetric Particle Masses, Nucl. Phys. B 306 (1988) 63.
[13] B. de Carlos and J. A. Casas, One loop analysis of the electroweak breaking in supersymmetric models and the fine tuning problem,Phys. Lett. B 309 (1993) 320–328.
[14] ATLAS Collaboration, The ATLAS Experiment at the CERN Large Hadron Collider, JINST 3 (2008) S08003.
[15] J. Alwall, P. Schuster and N. Toro,
Simplified Models for a First Characterization of New Physics at the LHC, Phys. Rev. D 79 (2009) 075020.
[16] D. Alves, Simplified Models for LHC New Physics Searches, J. Phys. G 39 (2012) 105005, ed. by N. Arkani-Hamed et al.
[17] ATLAS Collaboration, Search for strong production of supersymmetric particles in final states with missing transverse momentum and at least three b-jets at √s= 8 TeV proton-proton collisions with the ATLAS detector,JHEP 10 (2014) 24.
[18] D. Krohn, J. Thaler and L.-T. Wang, Jet Trimming,JHEP 02 (2010) 084.
[19] B. Nachman et al., Jets from Jets: Re-clustering as a tool for large radius jet reconstruction and grooming at the LHC,JHEP 02 (2015) 075.
[20] ATLAS Collaboration, Summary of the searches for squarks and gluinos using √s= 8 TeV pp collisions with the ATLAS experiment at the LHC,JHEP 10 (2015) 054.
[21] ATLAS Collaboration, Search for new phenomena in final states with large jet
multiplicities and missing transverse momentum at √s= 8 TeV proton-proton collisions using the ATLAS experiment,JHEP 10 (2013) 130.
[22] ATLAS Collaboration, Search for squarks and gluinos in events with isolated leptons, jets and missing transverse momentum at √s= 8 TeV with the ATLAS detector,JHEP 04 (2015) 116. [23] ATLAS Collaboration, Search for supersymmetry at √s= 8 TeV in final states with jets and two
same-sign leptons or three leptons with the ATLAS detector,JHEP 06 (2014) 035.
[24] CMS Collaboration, Search for gluino mediated bottom- and top-squark production in multijet final states in pp collisions at 8 TeV,Phys. Lett. B 725 (2013) 243–270.
[25] CMS Collaboration, Search for supersymmetry in pp collisions at √s= 8 TeV in events with a single lepton, large jet multiplicity, and multiple b jets,Phys. Lett. B 733 (2014) 328–353. [26] CMS Collaboration, Search for Supersymmetry Using Razor Variables in Events with b-Tagged
Jets in pp Collisions at √s= 8 TeV,Phys. Rev. D 91 (2015) 052018.
[27] CMS Collaboration, Search for new physics in the multijet and missing transverse momentum final state in proton-proton collisions at √s= 8 TeV,JHEP 06 (2014) 055.
[28] CMS Collaboration,
Search for new physics in events with same-sign dileptons and jets in pp collisions at √s= 8 TeV, JHEP 01 (2014) 163, [Erratum: JHEP01,014(2015)].
[29] CMS Collaboration, Searches for supersymmetry based on events with b jets and four W bosons in pp collisions at 8 TeV,Phys. Lett. B 745 (2015) 5–28.
[30] ATLAS Collaboration, ATLAS Insertable B-Layer Technical Design Report, CERN-LHCC-2010-013, ATLAS-TDR-19 (2010),
url:https://cds.cern.ch/record/1291633.
[31] ATLAS Collaboration, Performance of the ATLAS Trigger System in 2010, Eur. Phys. J. C 72 (2012) 1849.
[32] ATLAS Collaboration, Improved luminosity determination in pp collisions at √s= 7 TeV using the ATLAS detector at the LHC,Eur. Phys. J. C 73 (2013) 2518.
[33] J. Alwall et al., The automated computation of tree-level and next-to-leading order differential cross sections, and their matching to parton shower simulations,JHEP 07 (2014) 079.
[34] P. M. Nadolsky et al., Implications of CTEQ global analysis for collider observation, Phys. Rev. D 78 (2008) 013004.
[35] T. Sjostrand, S. Mrenna and P. Z. Skands, A Brief Introduction to PYTHIA 8.1, Comput. Phys. Commun. 178 (2008) 852–867.
[36] S. Alioli et al., A general framework for implementing NLO calculations in shower Monte Carlo programs: the POWHEG BOX,JHEP 06 (2010) 043.