Environmental Engineering and Management Journal September 2018, Vol.17, No. 9, 2165-2178 http://www.eemj.icpm.tuiasi.ro/; http://www.eemj.eu
“Gheorghe Asachi” Technical University of Iasi, Romania
EXPLORING THE POTENTIAL OF EO DATA AND GIS
FOR ECOSYSTEM HEALTH MODELING IN RESPONSE TO WILDFIRE:
A CASE STUDY IN CENTRAL GREECE
Aaron Evans
1, Salim Lamine
1,3, Dionissios P. Kalivas
2, George P. Petropoulos
1,4∗1Department of Geography and Earth Sciences, University of Aberystwyth, SY23 3DB, UK
2Department of Land Resources Management and Agricultural Engineering, Agricultural University of Athens, Athens, 11855, Greece
3Department of Ecology and Environment, Faculty of Biological Sciences, University of Sciences and Technology Houari Boumediene, BP 32, El Alia, Bab Ezzouar, Algiers, Algeria
4Department of Soil & Water Resources, Institute of Industrial & Forage Crops, Hellenic Agricultural Organization“Demeter” (former NAGREF), Directorate General of Agricultural Research, 1 Theofrastou St., 41335, Larisa, Greece
Abstract
In this study, the development of a suitable methodology for establishing and monitoring indicators of Ecosystem Health (EH) and its responses to wildfire using Earth Observation (EO) data synergistically with Geographical Information Systems (GIS) is investigated. The proposed methodology combined GIS and Landsat Thematic Mapper (TM) and Enhanced Thematic Mapper Plus (ETM+) data to assess ecosystem characteristics, including its vigor, organization and resilience, for a case study in Central Greece. These parameters were quantified primarily by utilizing EO-based techniques focusing on the analysis of the Normalized Difference Vegetation Index (NDVI). Topographic features, including slope, aspect and a Compound Topographic Index (CTI) were also derived from the Advanced Spaceborne Thermal Emission and Reflection Radiometer (ASTER) Global Digital Elevation Model (GDEM), and integrated in a modeling scheme to assess EH. The developed modeling scheme illustrates the effect of wildfires on EH accurately, demonstrating correlations between areas of past wildfires and their associated recovery. Our findings thus provide useful information to land managers and policy makers of fire affected regions alike, and could provide important contributions to the potential development of an operational estimation of EH recovery after wildfire.
Key words: earth observation, ecosystem health modeling, GIS, resilience, wildfire
Received: July, 2014; Revised final: December, 2014; Accepted: December, 2014; Published in final edited form: September, 2018
1. Introduction
Human society benefits from a multitude of resources and processes that are supplied by ecosystems (Crossman et al., 2013). They provide various goods and services to society, varying from the production of food, timber or clean water, to regulating climate and diminishing natural hazards. Furthermore, they also offer non-material cultural assets, which in turn can all directly contribute to our well-being and economic wealth (Burkhard et al.,
∗Author to whom all correspondence should be addressed: e-mail: petropoulos.george@gmail.com; Phone: +44-0-1970-621861
2009). Such products and services are generally termed Ecosystem Services (ES) (Bagstad et al., 2013a).
The Earth’s ecosystems are thus extremely valuable to humanity, economically, socially and ecologically (Grec, 2016; Henke and Petropoulos, 2013; Rapport et al., 1998). For example, plant or wooded resources which can be used for the production of medication have a natural capital based upon their price within the commodity markets, providing an economic avenue for their exploitation
(Costanza et al., 1997). Their production can also have a direct influence on human health through meeting, or not meeting, patient demands, where, in addition, ecosystems can provide a state of mental well-being through providing non-material cultural assets for social enjoyment (Pretty et al., 2007). Thus, it is important to consider the direct and indirect effects of the sustainability of ES for various aspects of human society. However, due to the influences of anthropogenic factors and also an increase in the frequency and magnitude of natural disasters, the distribution of healthy ecosystems has become fragmented, and sustainability is difficult. Consequently, a sustainable approach for protecting and managing ecosystems is thus of high importance for the future sustainability of viable ES (Kandziora et al., 2013).
Indeed, as population increases the demands for goods and services provided by ecosystems have risen dramatically, leading to unsustainable use of ecosystems and natural resources. The consequences of this over-exploitation can result in the degradation of ecosystems, which in turn decreases the ability of such ecosystems to provide the goods and services humanity relies upon (Vitousek et al., 1997). Indeed, Vitousek et al. (1997) has noted that ecosystems over the world are more frequently displaying signs of stress and dysfunction. According to Costanza (1992), an ecological system is healthy and free from the “distress syndrome” if it is stable and sustainable, i.e. if it is active and maintains its organization and autonomy over time, and is resilient to stress. Ecosystem Health (EH) is thus closely linked to the idea of sustainability. The latter implies the ability of the system to maintain its structure (organization) and function (vigor) over time in the face of external stress (resilience); these three elements are the indicators of a healthy ecosystem and they are measurable characteristics (Costanza and Mageau, 1999). For instance, ecosystem vigor is the simplest of the three, and can be measured by assessing its activity, metabolism or productivity. Organization refers to the number and diversity of interactions between the components of a system and it can be assessed by estimating its biodiversity exchange and structure. Resilience on the other hand, is more complex and encompasses the previous two. It is essentially, the ability of an ecosystem to maintain its structure and function in the presence of external stress, this is also known as the counteractive capacity. Resilience is an important aspect of EH as it shows how well a particular ecosystem responds to external stress and can allude to a number of health issues (Costanza, 2012; Mitsch, 2012; Rapport et al., 1998; Yi et al., 2016).
Over the past decade there have been a number of highly destructive wildfires throughout the Mediterranean region (Pausas et al., 2009), causing a range of issues such as the loss of homes, poor air quality and economic losses. When considering the effects upon an ecological level, wildfire is an essential process. However, when fundamental
components of an ecosystem are out of balance, wildfire can have serious negative impacts. These primarily include expansive biodiversity loss, where for example, wildfire causes the destruction of over one million hectares of forests globally each year (Bagstad et al., 2013b). Within the Mediterranean, wildfire causes significant ecosystem fragmentation, resulting in economic losses and a number of environmental problems. Arguably, Greece has experienced some of the most devastating wildfires within the Mediterranean region, as over the last decade there have been a number of large highly destructive wildfires. Moreover, as a result of unplanned development and anarchic urban growth taking place within fire affected regions, the country has experienced significant loss of infrastructure (Hendersonet, 2005). Therefore, it is important to monitor the natural recovery of an ecosystem after wildfire to identify the management and policy making requirements for such areas. EH mapping is one potential method that could be utilized to help identify techniques to trigger the counteractive capacity of ecosystems to recover from increasingly frequent, larger and intense wildfires.
A number of approaches have previously been proposed for evaluating the extent of wildfire damage and post-fire recovery (Davis et al., 2014). Traditionally, such approaches have been undertaken in the field at local scales. At present, with the advent of Earth Observation (EO) technology, the assessment of damage and recovery has more recently been undertaken using remotely sensed data (Colson et al., 2018; Knorr et al., 2011; Kalivas et al., 2013; Kyzirakosa et al., 2014; Ireland et al., 2015; Petropoulos et al., 2010, 2011; Said et al., 2015). EO data has become extremely valuable for wildfire management and has made it possible to assess wildfire risk over large areas with relative ease (Brown et al., 2018). EO has many other applications including detection of active fires (Giglio et al., 2008), as well as calculating burn severity (Amos et al., in press) or mapping post-fire vegetation re-growth (Petropoulos et al., 2014).
EO technology is able to provide
unprecedented spatial coverage from local to global scale applications, which plays a significant role in mapping ES (Henke and Petropoulos, 2013; Xiao et al., 2004). It has also several benefits for ecosystem monitoring since large areas, sometimes inaccessible at ground level, can be assessed with relative ease and at low cost (Chambers et al., 2007; Cohen and Goward, 2004). The recent advancement in this technology has evolved considerably and new sophisticated techniques have developed for the purpose of wildfire assessment (Petropoulos et al., 2010).
The mapping of EH is an area of study which has not received as much attention in the scientific literature in comparison to ES. However, there are a number of studies that have assessed the indicators of health using EO data; including description of ecosystem structure (organization) using
Geographical Information Systems (GIS) in combination with satellite imagery (Asner et al., 2005; Mokpidie et al., 2014), understanding the ecosystem function (vigor) by implementing the Normalized Difference Vegetation Index (NDVI) (Kerr and Ostrivsky, 2003; Pettorelli et al., 2005) and also resilience assessment using satellite images (Dı´Az-delgado et al., 2002). In purview of the above, this study aims to propose a methodology to model EH by applying a set of straightforward methods that will be validated within Central Greece. The specific objectives of this study were: First, to validate the suitability of some NDVI-based methods as a tool for the evaluation of each key variable related to EH (vigor, organization and resilience). Second, to develop a GIS-based system to model and map the EH using the products derived from the first objective. Third, to consider the different responses of EH in response to wildfire in Central Greece.
2. Study area
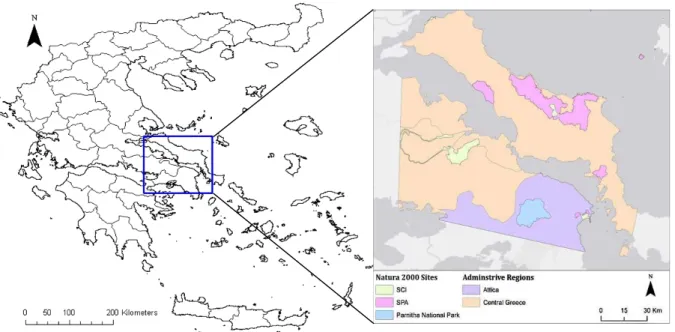
Our study region is located within Central Greece, where the methods are applied upon an entire Landsat scene (path 183 and row 033 of the World Reference System). The surface area is about 15,250 km2, covering three administrative regions including most of Central Greece and smaller sections of South East Thessaly and Northern Attica (Fig.1).
The area includes 11 NATURA 2000 conservation sites, 4 of them are Sites of Community Importance (SCI) and 6 of them are Special Protection Areas (SPA) (NATURA2000, 2013). In addition, there are several public parks and preserved zones in the selected area, as well as the National Park of Parnitha which is both an SCI and SPA. The land cover of the region was assessed in 2000 for the Coordination of Information on the Environment (CORINE) program (JRC-EEA, 2005
http://reports.eea.europa.eu/COR0-landcover/en), in which the datasets reveal that the study region is dominated by Sclerophyllous vegetation and woodlands of various types, followed by agricultural areas. The region exhibits typical Mediterranean weather patterns and presents large variability in topography, with significant mountainous areas, and also a small number of lowland areas. All the aforementioned factors subsequently mean that Greece is particularly susceptible to wildfire and is considered to be a prominent location to demonstrate the importance of EH mapping due to the increased wildfire events and unplanned urban development (Henderson et al., 2005; Pausas et al., 2009).
3. Datasets
3.1. Landsat images
A total of eight Landsat images, acquired from 1999 to 2011, were used including 5 Landsat Thematic Mapper (TM) and 3 Landsat Enhanced Thematic Mapper Plus (ETM+). Numerous scenes were considered. However only a small selection met all the following criteria required for implementation in this study; i) the use of anniversary dates to address issues related to inter-annual changes and phenological differences, and, ii) cloud coverage of less or equal to 5% in each scene. An overview of the Landsat scenes utilized in this study is provided in Table 1. Only one scene (21/08/1999, ETM+) was used during the final analysis, and the rest of images were used to create a gap-filled product. All images were obtained from the United Stated Geological Survey (USGS) archive (http://glovis.usgs.gov/) at no cost. They were acquired geometrically corrected, geographically resampled, and registered to a geographic map projection with elevation correction applied (Level-1T processing level).
Fig. 1. Location of the study area within central Greece (left) and the location of the NATURA 2000 sites
Atmospheric correction and cloud masking were undertaken, except for the 14th of August 2002 scene. For the year 2004, a Landsat ETM+ scene was acquired. The Landsat gap fill script was used within the ENVI image processing software ver. 4.8 to produce the gap filled images. The process of correction was relatively straightforward and a comprehensive overview of the gap filling procedure can be found in Scaramuzza et al. (2004).
Table 1. List of Landsat images used in the study
for both gap filling and data analysis Acquisition Date Sensor Cloud Cover (%) 21/08/1999** ETM+ N/A 24/08/2000 ETM+ 0 14/08/2002 ETM+ 2.49 03/08/2004* ETM+ SLC OFF 0.73 24/07/2006* ETM+ SLC OFF 0.51 20/08/2007 TM 0 24/07/2009 TM 0 15/08/2011 TM 2.24
*Scenes were used to create a gap filled product **Used in analysis only
3.2. CORINE land cover
Land use/cover (LULC) classification data from the CORINE2000 land cover project was utilized in the present study. CORINE was created in 1985 by the European Union with the aim to create a European wide LULC map derived primarily from the interpretation of satellite images and ancillary data. CORINE2000 consists of an updated version of the initial CORINE product, providing LULC maps of 29 European countries derived from the processing of orthorectified Landsat images.
3.3. ASTER Digital Elevation Model
Spatial information on topography obtained from the Global Digital Elevation Model (GDEM) provided by the Advanced Spaceborne Thermal Emission and Reflection Radiometer (ASTER) sensor was also included in our study. The ASTER GDEM product was released in 2009 as a result of the collaboration between the Ministry of Economy, Trade and Industry of Japan (METI) and the National Aeronautics and Space Administration (NASA). The products geographic coverage lies between 83°N and 83°S with geographic latitude–longitude coordinates at 1 arc sec (30m) grid. Estimated accuracies of the product are at 95 % confidence at 20 meters for vertical data, and at 95 % confidence at 30 meters for horizontal data (ASTER GDEM Validation, 2009). The dataset is projected to geographic latitude/longitude projection and WGS84/EGM96 datum. It is provided in GEOTIFF format at no cost to users via electronic download from the Earth Remote Sensing Data Analysis Center (ERSDAC) of Japan or
NASA’s REVERB archive (http://reverb.echo.nasa.gov/reverb/). In our study, the
ASTER GDEM tiles covering our study site were acquired from the REVERB platform.
3.4. Burnt area estimates
Additionally, to study the different reactions of EH in response to wildfire, four wildfire events were chosen: two from different years (2000, 2001) and two from 2007. These were chosen from the National Observatory of Athens (NOA) using the Diachronic Inventory of Forest Fires web service (http://ocean.space.noa.gr/diachronic_bsm/). The fires were chosen based on their proximity to a certain year, this was particularly problematic due to the need for anniversary dates, for example one fire occurred in Late August 2007 but the closest date of the available scene was in September 2007. Burn scar shape files were obtained from European Forest Fire Information System for Rapid Damage Assessment (EFFIS RDA). EFFIS provides two operational modules with respect to burnt area mapping (Barbosa et al., 2006, 2009). In Rapid Damage Assessment (RDA) burnt area estimates are derived from the daily processing of MODIS Terra and Aqua MODIS visible-near infrared (VNIR) and shortwave (SWIR) data, at 250 m and 500 m respectively. Burnt area detection is assisted by the MODIS 1 km active fire product (Giglio et al., 2003; Barbosa et al., 2009) which is used to detect the active fires. Burnt areas occurring in agricultural land as defined by the CORINE 2000 land cover map (JRC-EEA, 2005) are masked out during the algorithm implementation (Boschetti et al., 2008). The whole process is also assisted by visual image interpretation and by the systematic collection of fire news from various European media sources (Barbosa et al., 2006). The EFFIS RDA has been implemented since 2003 and provides daily updates of the perimeters of burnt areas in Europe for fires of about 40 ha or larger, although the product may also include the perimeters of burned areas of smaller dimensions. Burnt area products are provided by EFFIS online via a web interface (http://effis-viewer.jrc.ec.europa.eu/wmi/viewer.html). In the present study, the burnt area estimates from the EFFIS RDA product was acquired after a direct communication with EFFIS. The acquired dataset was delivered in vector format (shape file) with WGS-84 projection system. The EFFIS burn scar vectors were then used to mask the burn scars and statistical tools were implemented to generate statistics for the coverage area of each CLC2000 class.
4. Methodology
The entire process for this research including all the steps and their inter-relationships is illustrated in the methodology flowchart (Fig. 2). In summary, the first step involved the estimation of NDVI to quantify the key factors of EH (vigor, structure and
resilience), as well as how they were implemented within the model for its validation. Besides the pre-processing of the Remote Sensing (RS) data as described in the previous section, the methodology included two more steps. The first one involved the transformation of all datasets into raster format, required to compute the EH map. Following this, each raster layer was reclassified and given a weighting before being combined in ArcGIS to produce a final map of EH. The model was calibrated with high resolution EO data within Google Earth.
The EH model was developed from the assimilation of the Compound Topographic Index (CTI), derived from the ASTER GDEM dataset, and the derivation of the indicators of EH, namely the vigor, structure and resilience datasets, from the estimation of NDVI, into a single EH model.
4.1. Deriving the Compound Topographic Index
Previous studies have demonstrated that CTI correlates well with horizon depth, silt percentage, organic matter content and phosphorus (Yang et al., 2005).
Mediterranean landscape may be resilient to wildfire, allowing for the growth and re-colonisation of forestry in regions affected by wildfire (Shakesby et al., 2011). However, it may be prudent to evaluate soil quality rather than assuming complete resilience as it is the case for Mediterranean landscape. Two key derived datasets including Aspect and Slope were generated from the DEM using ArcMap 10.1 software. CTI also known as a Topographic Wetness Index (TWI) was calculated based upon slope and upstream contributing area (Gessler et al., 1995; Moore et al., 1993; Yang et al., 2005) using Eq. (1).
=
β
α
tan In CTI (1) where: α represents the catchment area per pixel; β refers to the slope in radians (Jeffrey and Oakleaf, 2012).A python script written for ArcGIS ver.10 obtained from ESRI’s ArcGIS website (http://www.arcgis.com) was used for the calculation of the CTI raster layer.
Fig. 2. Flowchart of the research methodology with three different stages including data pre-processing,
4.2. Quantifying vigor, structure & resilience
NDVI was computed from the corrected Landsat scenes, using near-infrared (NIR) and red (RED) bands (4 and 3 band respectively) in ENVI using the band math option, as (Eq. 2):
[ ]
[ ]
(
)
[ ]
[ ]
(
4 3)
3 4 B RED B NIR B RED B NIR NDVI + − = (2) The method implemented to quantify vigor was based on classifying the NDVI results with threshold values for each year EH was to be assessed. The thresholds used were 0.1 intervals from 0 to 1. This technique demonstrates the different levels of vegetation density within the study region. The classification was completed in ArcMap software using the reclassify tool where each 0.1 interval was assigned to a single class, the result was a raster with 11 classes -1-0 and ten 0.1 intervals, each of these intervals was then assigned with new values from 0 to 1.Assessing ecosystem structure was undertaken by calculating the Fractional Vegetation Cover (FVC), computed from the NDVI images as proposed by Carlson and Ripley (1997). Essentially, the first step was to scale the NDVI images as follow (Eq. 3):
(
)
(
NDV ax NDVIlow)
NDVIlow NDVI NDVIs − − = Im (3)where: NDVIlow is the value for bare soil, approximately 0.14-0.18 for the images used within this study, and NDVImax the value for full vegetation cover.
The final step was to square the NDVIs, the result of the equation is a range of values from 0 to 1, where 0 is very little vegetation cover and 1 is a highly vegetated area (Eq. 4):
2
) (NDVIs
FVC= (4)
Numerous examples of quantifying resilience based upon NDVI are available in the relevant scientific literature (Abdel Malak and Pausas, 2006; Cuevas-gonzález et al., 2009; Fitterer et al., 2012). In the present study, this was done following a variant of method adopted previously by Stow et al. (2003) and Vicente-Serrano et al. (2011) where a linear regression analysis was used. In particular, a similar method was implemented in our study where the linear trend for each pixel of each NDVI image was calculated using ordinary least-squares regression. The Slope is defined as the coefficient of the fitted regression line at each pixel (Eq. 5), where:
n is the number of years, 11 for our study (2000 to
2011); i is a particular year from 2000 to 2011; Nndvi corresponds to the NDVI value from the first year (2000).
(
)(
)
(
)
2 1 1∑
∑
= = − − − = n i i i n i i N N Nndvi Nndvi N N Slop (5) Positive values denote an increase in the vegetation where negative values denote its reduction; this was calculated upon the NDVI image in ESRI’s ArcMap software using the raster calculator tool.4.3. Implementing the EH model
The EH model developed in our study was created by assimilating the data acquired from each of the previous steps into a single EH model. Initially, before implementation of the model, all datasets were initially reclassified, and each reclassified raster layer was subsequently assigned weighting functions related to the amount of influence each parameter had on EH. Each of the EH indicators were weighted from 0-1 following the methodology described in Costanza (1992).
(
CTIij Aij)
Rij Sij Vij Health ystem Ecos = + + + + (6)where: V corresponds to Vigor; S for structure; R for resilience; CTI for Compound Topographic Index; A for aspect; i and j refer to the pixel location.
CTI was used in place of slope, as slope is included within its calculation and provides an improved description of where vegetation should be present based upon the predicted water availability in particular regions (Yang et al., 2005). CTI was reclassified from 0-0.5, where higher values were assigned a lower weighting as these regions had access to a more abundant water supply.
Aspect was reclassified to three classes with weightings from 0-0.25 based upon which slopes received the most sunlight. Slopes that did not receive as much sunlight were given a higher weighting to remove the bias in the NDVI (Jin et al., 2008). Based on this assumption, the 0.25 value was assigned to N-S (00 -1800) aspect class, 0.125 to S-NW (1800 -2800) class and 0 to NW-N (2800 -3600) class. The rasters used within the model were reclassified using the ArcGIS reclassify tool. To produce a final raster describing EH, each reclassified raster dataset was assimilated together using the weighted sum tool in ArcGIS (Eq. 6).
4.4. Model accuracy assessment
Model validation was undertaken using Google Earth software package. This software allows a three dimensional (3D) visualization of the study area at a high enough resolution to be compared to the EH model’s output map. The output maps were initially exported from ArcMap as a KML file. In this format the datasets were then uploaded on Google Earth and
a visual comparison of regions of interest was undertaken, for example healthily regions were expected to correlate well with regions of dense vegetation coverage (Abbas et al., 2010).
5. Results
5.1. EH maps
The derived data sets include the topographic features extracted from the GDEM as well as the creation of the CTI, and most importantly the raster data that were used for the creation of the EH map. Figures 3a and 3b illustrate the main results of the vigor and FVC indicator maps respectively. The datasets don’t reveal a significant amount of information on their own, however, when compared; correlations can be seen between both indicators, in particular in the westerly section of each indicator map where both vigor and FVC are high. From these elements it is apparent that there is variability in productivity, vegetation cover and resilience throughout the region.
Fig. 3c illustrates the overall resilience in the region. Again, high variability is apparent through the region, with the northwestern area of the study site demonstrates high resilience, whereas more central to western areas show the lowest. Highest resilience is within the region affected by the 2000 fire. However, this can be considered incorrect as the imagery used did not include the NDVI scene pre-fire. A more accurate observation of resilience of fire over the time period is the location of the 2001 fire where the region exhibits relatively good resilience.
The final EH map produced as the model output is illustrated in Fig. 3d. The fire affected regions of the four wildfires are outlined; these areas were used to describe the effect of wildfire upon EH. Considering the full extent of EH for the study area, the healthiest region is the area near the northwestern coastline, with a gradual reduction in health as you move from northeast to southwest. Poor EH near Athens (South East) has been registered. Considering the fires at this scale, it should be noted that the regions affected by fires in 2000 and 2001 are in a healthier state than those of 2007.
5.2. EH and wildfire
The state of EH in the year 2011 for regions affected by four major past fire events is highlighted in Fig. 4. For the region which included the 2001 fire event, EH increases from moderate to good from west to east, showing a region in overall relatively good EH by 2011. There were two fire affected regions in the year 2000, a larger fire located to the east of the study region and another smaller fire to the west. As indicated by Fig. 4, EH varies between both fires. Notably, the area of the larger fire located to the east of the study region indicates a largely homogenous region of moderate EH by 2011, whereas the smaller fire to the west reveals a region, which in the majority,
consists of good EH. In contrast to these results, the region affected by the 2007a fire shows moderate EH for a significant expanse of the fire affected region, with exceptions for the southern extremities which display poor EH. The area affected by the 2007b fire is generally of poor health by 2011, particularly in the eastern region. Evidently, ecosystem response to each fire varies considerably; with an obvious contrast in EH following the 2000 fire in comparison to the 2007 fires. However, when comparing the regions affected by the 2000 and 2001 fires, there are some correlations, with both regions showing variable moderate to good EH recovery. Similar conclusions can be made for the 2007 fires (Fig. 4). Such results indicate a correlation between level of post-fire recovery and time since the fire.
The changes in mean NDVI throughout the study period for each burn scar are depicted in Fig. 5. Graphs reveal how the NDVI dynamics are reflected within the ecosystem. However, these changes are not directly comparable as they do not take into account variations in pre-fire NDVI between the fire affected regions. Nevertheless, the patterns of NDVI change within each individual region can be observed. As expected, each region exhibits a large decrease in mean NDVI during the initial period following the year of the fire, with the mean NDVI for the region which experienced the 2007b fire exhibiting the largest decrease. Both the regions affected by the 2000 and 2001 fires showed a general trend of significant recovery in the initial years following the fire and returning to a more gradual recovery back to pre-fire levels over a longer time period, with the 2001 fire affected region in particular exceeding its pre-fire average NDVI by 2011. It is important to note that the 2007 fires have only had a 4 year recovery period and thus a comparison of recovery trends between all fire affected regions is unavailable. The data set is thus not robust enough to make assumptions on how recovery will proceed with the 2007 fires, yet there are similar trends of significant early recovery.
6. Discussion
6.1. NDVI as a proxy for EH
In this study, three variables of EH, namely, the vigor, structure and resilience were quantified using a number of NDVI based methods to evaluate EH and its responses to wildfire using a region in Greece as a case study. The approach implemented was specifically chosen due to its straightforward implementation and due to the fact it could be easily incorporated into an automated model within a GIS product.
Vigor was the simplest of the methods to implement, where a thresholding technique separated ten different classes of NDVI from 0-1. This system of classification gave a good representation of vegetation productivity within the regions. High correlations were observed between the thresholding values and the land cover types derived from the
CORINE land cover map, where, for example, agricultural regions which contained denser biomass correlated well with the higher thresholding classes, and in contrast, low threshold values correlated well with the more urbanized regions on the outskirts of Athens. The classes also exhibited good correlation with the GDEM, as the higher threshold classes were closely linked to regions of increased elevation. This was due to the fact that within this specific study site, forest land cover types were predominantly found within the higher elevations, whereas most low lying flat land had been cleared for urban expansion or
agriculture, and thus contained a higher percentage of lower threshold classes.
NDVI has frequently been used as a representation for vegetation vigor (Maxwell and Sylvester, 2012; Seto et al., 2004; Wang et al., 2004). For example, in relation to EH, Chen et al. (2010) indicated that NDVI was lower around the regions where economic activity was higher, for example near cities or coastal areas. Suo et al. (2008) also used NDVI as a substitute for vegetation productivity; his observations were similar to those of Chen et al. (2010).
Fig. 3. a. Vigor map derived from the reclassification of NDVI in 2011, b. Fractional Vegetation Cover map used as proxy for
ecosystem structure, c. Result of the linear regression applied to NDVI scenes from 2000-2011, used as proxy for ecosystem resilience, d. Final EH Map generated from the weighted assimilation of the three EH indicators and the CTI
3c 3d
Fig. 4. Detailed maps of EH for the four major fire events studied
Fig. 5. Average NDVI of four fire events investigated in this research
However, his study added further elements to evaluate vigor, and thus NDVI only accounted for a third of the quantified vigor element (Costanza, 1992).
Based upon the findings and interpretations from comparisons to ancillary data sets such as the CLC2000 cover, as well as the literature, vigor derived
from the NDVI values played a significant role in this research. Similar interpretations can be made in regards to the organization element of EH where FVC was used as a representation for a structure raster. The results here are similar to vigor since coastal and urban zones exhibited low vegetation density and agricultural areas and forested mountainsides high vegetation density (Fig. 3). This raster describes further the area of low density such as grasslands and shrublands, as within these environments vegetation cover is more sporadic (Zeng et al., 2000; Asner and Heidebrecht, 2002). This can be seen in Fig. 3 where low density was registered from southwest to northeast. Unfortunately, the FVC raster does not allow for an interpretation of the species diversity thus possibly an additional data set may be required to provide a more robust quantification of structure. Regardless of the limitations of the derived data set the layer is useful in understanding the variations in vegetated areas as well as the density of the vegetation, thus as a basic element of structure it is of value to include in an EH model. Previous studies have also used the FVC is a similar way (Chen et al., 2010), with some (e.g. Luo et al., 2003) also finding some use in FVC as an element of EH, however a different model was utilized in such studies.
The method provided by Vicente-Serrano et al. (2011) was effective in providing a raster data set for quantifying resilience, as the 2007 wildfires were picked out well as areas of negative NDVI change over the decade. The 2007b fire affected region showed relatively good resilience compared to the 2007b region, which appeared to exhibit very poor resilience likely attributed to the pre fire land cover. Areas that have recovered from wildfire since 2001 showed a positive increase of NDVI, demonstrating good resilience. The resilience values for the agricultural land in the west of the study area are likely to be attributed to the cultivation of the crops grown there.
Arguably, the resilience component of the model is the most important parameter as it encompasses the other key indicators of EH. Considering the time of recovery for certain land covers, grassland and many sclerophyllous vegetation species can recover in relatively short time frames whereas forestry will take over a decade to recover (Díaz-Delgado et al., 2002). Vicente-Serrano et al. (2011) deduced that recovery of Pinus halepensis would take at least 13 years. Thus, poor recovery registered in some parts of the study area is related mainly to species domination. However, the resilience data provided an insight on how recovery is progressing in fire affected regions and inferences can be made despite the lack of a sufficient data set to make a concrete conclusion.
6.2. Wildfire and EH
Fig. 4 illustrates the derived EH maps of the four investigated fires. There is a great deal of variations of EH within each fire; understanding why
there are differences within these burn scars will be useful when considering management and recovery options. The fires from the beginning of the decade obviously demonstrated better EH and this could be a sign on how long EH would take to recover. NDVI-based methodology will always demonstrate moderate EH as forestry is more productive and exhibits higher percentages of FVC. However, forestry does take longer to recover than agriculture and shrublands (Díaz-Delgado et al., 2002; Vicente- Serrano et al., 2011).
The difference is evidently more extensive in 2007a and 2007b fires where there has been a return to moderate health throughout most of the burn scar; however, the 2007b fire is still in relative poor EH. When comparing the CLC2000 with EH map, it appears that areas of coniferous forest within the 2007b fire affected region is slow to recover, and this is reflected in the poorer EH recovery of those regions. The pre-fire land cover of the region affected by the 2007a fire consisted predominantly of agricultural land and sclerophyllous vegetation, and thus faster recovery times of such vegetation are reflected in the EH recovery of the regions. Again, this interpretation agrees with the findings of Díaz-Delgado et al. (2002) who previously reported slower post-fire recovery times for forested regions. Despite the observations made within this research and from the literature there are many factors that can affect EH directly after fire. Díaz-Delgado et al. (2002) provided evidence that resilience can be decreased in the presence of recurrent wildfires. Considering the four fires studied, two have seen more than one fire event, the western part of 2001 and the northwestern zone of the 2007a fire. The relatively short recovery period for the 2007a confirmed all the information stated previously. For instance, the 2001 fire may illustrate this phenomenon where the eastern zone within the fire affected region shows better EH recovery in comparison to the western zone (the zone that has been burned twice within the last 30 years). As the 2007b fire was the first in the region it is worth considering aspects other than the pre-fire land cover, for instance the fire severity and the colonization by gorse shrub lands could be another possible explanation about the speed of recovery as suggested by other researchers (Broncano and Retana., 2004; De Luis et al., 2006).
7. Conclusions
The basic aim of the study was to develop a map of EH by applying a set of straight forward methods using EO-data and GIS methodologies. Large regions have been mapped for EH with a set of straightforward methods. The use of Landsat TM & ETM+ data along with the ASTER DEM has made it possible to conduct this research at no cost.
One of the main objectives was the use of NDVI as the main element to evaluate each of three EH indicators (resilience, organization, and vigor). The products derived from NDVI were relatively successful. For instance, basic NDVI thresholding was
as expected; an excellent representation of vigor, where productivity was well illustrated in most regions. FVC expressed as a percentage of vegetation cover derived from the NDVI, provided a detailed account of the vegetation structure, yet was limited in its ability to map species diversity within an ecosystem. Resilience was represented by linear regression upon the NDVI time series, the method precisely illustrated regions with a significant change in NDVI over the years and it was well placed to exemplify resilience. The implications of these findings are relatively clear as vigor and resilience were well-represented by NDVI and easily quantifiable, thus well-placed to be used objectively within an EH model. The structure dataset required some interpretations, thus, to further its usefulness as a component of an objective EH model, additional data may be required to improve the effectiveness of FVC as an indicator of EH.
Another objective was the development of a GIS-based system to model and map EH using the assimilation of the weighted EH indicator datasets. The results of this investigation have demonstrated that GIS software is suitable and robust enough to use, thus offering all the tools required to map EH with relative ease. An implication of this is that using a GIS-based approach can lead to a fast and efficient modeling of EH. This research has ambitions for assessing EH in the presence of wildfire in regions throughout the world and therefore this study has proven the quality that a GIS methodology provides a straightforward accurate model for EH that may be applied to other regions of the world with relative ease. Yet also, with further work, automated methods could be implemented to further increase the efficiency at which EH could be derived. The development of automated or operational tools would be extremely useful for post-fire managers and policy makers with regards to achieving cost-effective, efficient ecosystem recovery systems.
The last objective of this study was the determination of the response of EH to wildfire events within Central Greece. This location was chosen due to the number of large scale fire events which have affected this region. The four fires chosen provided an insight into the response of EH over two time scales, the first of which showed that regions affected by wildfire have registered some reduction in EH initially, but over different time frames have showed clear signs of recovery. This was more evident within the 2000-2001 fires and somewhat evident in 2007a fire. One of the increasingly significant findings that emerged from this research is that pre-fire land cover will have an effect upon the response of EH over time, as areas previously covered by forests will exhibit a slower recovery of EH in comparison to regions covered by shrublands or agricultural crops. An implication of this is the possibility that our current EH model cannot be transferred to areas of different land cover types. On the other hand, it may be argued that forestry is more important ecologically and thus a
loss of this land cover to fire is more devastating to EH than that of shrublands.
One of the conclusions that we made from this study is that fire recurrence has a negative impact on the resilience. The current findings are significant to obtaining a better understanding of EH in the presence of wildfire. As a consequence, measures can be put in place by those such as policy makers to aid recovery. Further work needs to be done to establish the indicators of EH, despite NDVI and NDVI-derived products being useful indicators, adding further datasets such as precipitation data, land cover classifications and soil erosion models would result in increasingly sensitive proxies for the indicators of EH. Finally, it is recommended that a focus upon understanding the different responses of EH in regards to wildfire throughout the world will be a big step forward in developing an operational estimation of EH recovery after wildfire.
Acknowledgments
We acknowledge the data providers for the free access to the satellite images used in the present study. We also thank the anonymous reviewers for their constructive comments which helped improving the manuscript. We thank Antony Smith for his help with the preparation of some of the illustrations.
References
Abbas I.I., Muazu K.M., Ukoje J.A., (2010), Mapping land use-land cover and change detection in Kafur local government, Katrina, Nigeria (1995-2008) using remote sensing and GIS, Research Journal of Environmental and Earth Sciences, 2, 6-12.
Abdel Malak D., Pausas J.G., (2006), Fire regime and post-fire Normalized Difference Vegetation Index changes in the eastern Iberian peninsula (Mediterranean basin), International Journal of Wildland Fire, 15, 407-413. Amos C., Petropoulos G.P., Feredinos K.P., (2018),
Determining the use of Sentinel-2A MSI for wildfire burning and severity detection, International Journal of
Remote Sensing, DOI: 10.1080/01431161.2018.1519284.
Asner G.P., Heidebrecht K.B., (2002), Spectral unmixing of vegetation, soil and dry carbon cover in arid regions: Comparing multispectral and hyperspectral observations, International Journal of Remote Sensing,
23, 3939-3958.
Asner G.P., Knapp D.E., Cooper A.N., Bustamante M.M., Olander L. P., (2005), Ecosystem structure throughout the Brazilian Amazon from Landsat observations and automated spectral unmixing, Earth Interactions, 9, 1-31.
ASTER GDEM, (2009) ASTER Global Digital Elevation ModelGDEM, (2009), ASTER GDEM Version 1, Readme File, Accessed on July 24th, 2011, On line at: http://www.gdem.aster.ersdac.or.jp.
Baeza M., De Luıs M., Raventós J., Escarré A., (2002), Factors influencing fire behaviour in shrublands of different stand ages and the implications for using prescribed burning to reduce wildfire risk, Journal of Environmental Management, 65, 199-208.
Bagstad K.J., Johnson G.W., Voigt B., Villa F., (2013b), Spatial dynamics of ecosystem service flows: a
comprehensive approach to quantifying actual services, Ecosystem Services, 4, 117-125.
Bagstad K.J., Semmens D.J., Waage S., Winthrop R., (2013a), A comparative assessment of decision-support tools for ecosystem services quantification and valuation, Ecosystem Services, 5, 27-39.
Barbosa P., Camia A., Kucera J., Liberta G., Palumbo I., San-Miguel J., Schmuck G., (2009), Assessment of Forest Fire Impacts and Emissions in the European Union Based on the European Forest Fire Information System, in: Developments in Environmental Science, Bytnerowicz A., Arbaugh M., Riebau A., Andersen C. (Eds.), Elsevier, 8, 197.
Barbosa P., Kusera J., Strobl P., Vogt P., Camia A., San-Miguel-Ayanz J., (2006), European Forest Fire information System (EFFIS) - rapid damage assessment: appraisal of burnt area maps in southern Europe using MODIS data (2003 to 2005), Forest Ecology and Management, 1, 218-232.
Benoit G., Comeau A., (2005), A Sustainable Future for the Mediterranean: the Blue Plan's Environment and Development Outlook, Earthscan.
Boschetti L., Roy D., Barbosa P., Boca R., Justice C., (2008), A MODIS assessment of the summer 2007 extent burned in Greece, International Journal of Remote Sensing, 29, 2433-2436.
Broncano M.J., Retana J., (2004), Topography and forest composition affecting the variability in fire severity and post-fire regeneration occurring after a large fire in the Mediterranean basin, International Journal of Wildland Fire, 13, 209-216.
Brown R.A, Petropoulos G.P., Ferentinos K., (2018), Appraisal of the Sentinel-1 & 2 use in a large-scale wildfire assessment: A case study from Portugal’s fires of 2017, Applied Geography, 100, 78-89.
Burkhard B., Kroll F., Müller F., Windhorst W., (2009), Landscapes’ capacities to provide ecosystem services-a concept for land-cover based assessments, Landscape Online, 15, 22.
Burkhard B., Kroll F., Nedkov S., Müller F., (2012), Mapping ecosystem service supply, demand and budgets, Ecological Indicators, 21, 17-29.
Carlson T.N., Ripley D.A., (1997), On the relation between NDVI, fractional vegetation cover and leaf area index, Remote Sensing of Environment, 62, 241-252. Chambers J.Q., Asner G.P., Morton D.C., Anderson L.O.,
Saatchi S.S., Espírito- Santo F.D., Palace M., Souza C., (2007), Regional ecosystem structure and function: ecological insights from remote sensing of tropical forests, Trends in Ecology & Evolution, 22, 414-423. Chen Z., Yin Q., Li L., Xu H., (2010), Ecosystem Health
Assessment by Using Remote Sensing Derived Data: A Case Study of Terrestrial Region along the Coast in Zhejiang Province, Geoscience and Remote Sensing Symposium (IGARSS) IEEE International, 4526-4529. Cohen W.B., Goward S.N, (2004), Landsat's role in
ecological applications of remote sensing, Bioscience,
54, 535-545.
Colson D., Petropoulos G.P., Ferentinos K., (2018), Exploring the Potential of Sentinels-1 & 2 of the Copernicus Mission in Support of Rapid and Cost-effective Wildfire Assessment, International Journal of Applied Earth Observation & Geoinformation, 73, 262-276.
Costanza R., (1992), Toward an Operational Definition of Ecosystem Health, In: Ecosystem Health New Goals for Environmental Management, Costanza R., Norton B., Haskell B.J. (Eds.), Island Press, Washington DC, 239-256.
Costanza R., (2012), Ecosystem health and ecological engineering, Ecological Engineering, 45, 24-29. Costanza R., d’Arge R., de Groot R., Farber S., Grasso M.,
Hannon B., Limburg K., Naeem S., ONeill R.V., Paruelo J., Raskin R.G., Sutton P., Vanden Belt M., (1997), The value of the world’s ecosystem services and natural capital, Nature, 387, 253-260.
Costanza R., Mageau M., (1999), What is a healthy ecosystem?, Aquatic Ecology, 33, 105-115.
Crossman N.D., Burkhard B., Nedkov S., Willemen L., Petz K., Palomo I., Drakou E.G., Martín-López B., McPhearson T., Boyanova K., Alkemade R., Egoh B., Dunbar M., Maes J., (2013), A blue print for mapping and modeling ecosystem services, Ecosystem Services,
4, 4-14.
Cuevas-González M., Gerard F., Balzter H., Riaño D., (2009), Analyzing forest recovery after wildfire disturbance in boreal Siberia using remotely sensed vegetation indices, Global Change Biology, 3, 561-577. Davis E.J., Moseley C., Nielsen-pincus M., Jakes P.J.,
(2014), The community economic impacts of large wildfires: a case study from trinity county California, Society and Natural Resources, 27, 983-993.
De Luis M., Raventós J., González-Hidalgo J.C., (2006), Post-fire vegetation succession in Mediterranean gorse shrublands, Acta Oecologica, 30, 54-61.
Díaz-Delgado R., Lloret F., Pons X., Terradas J., (2002), Satellite evidence of decreasing resilience in Mediterranean plant communities after recurrent wildfires, Ecology, 83, 2293-2303.
Dillon G.K., Holden Z.A., Morgan P., Crimmins M.A., Heyerdahl E.K., Luce C.H., (2011), Both topography and climate affected forest and woodland burn severity in two regions of the western US, 1984 to 2006, Ecosphere, 2, 130.
EFFIS RDA, European Forest Fire Information System for Rapid Damage Assessment, On line at: http://effis-viewer.jrc.ec.europa.eu/wmi/viewer.html.
Fan L., Zizhen L., (2003), A model of ecosystem health and its application, Ecological Modeling, 170, 55-59. Fitterer J.L., Nelsona T.A., Coops N.C., Wulder M.A.,
(2012), Modelling the ecosystem indicators of British Columbia using Earth observation data and terrain indices, Ecological Indicators, 20, 151-162.
Gessler P.E., Moore I., McKenzie N., Ryan P., (1995), Soil-landscape modeling and spatial prediction of soil attributes, International Journal of Geographical Information Systems, 9, 421-432.
Giglio L., Csiszar I., Restás Á., Morisette J.T., Schroeder W., Morton D., Justice C.O., 2008. Active fire detection and characterization with the advanced spaceborne thermal emission and reflection radiometer (ASTER), Remote Sensing of Environment, 112, 3055-3063. Giglio L., Descloitres J., Justice CO., Kaufman Y., (2003),
An enhanced contextual fire detection algorithm for MODIS, Remote Sensing of Environment, 87, 273-282. Grec A., (2016), Sustainable management of biodiversity
within a nature reserve - site of community interest from north-west Romania, Environmental Engineering and Management Journal, 15, 1427-1435.
Haines-Young R., Potschin M., Kienast F., (2012), Indicators of ecosystem service potential at European scales: Mapping marginal changes and trade-offs, Ecological Indicators, 21, 39-53.
Henderson M., Kalabokidis K., Marmaras E., Konstantinidis P., Marangudakis M., (2005), Fire and society: a comparative analysis of wildfire in Greece and the United States, Human Ecology Review, 12, 169.
Henke J., Petropoulos G.P., (2013), A GIS-based Exploration of the relationships between human health social deprivation and ecosystem services for Wales, UK Applied Geography, 45, 77-88.
Ireland G., Petropoulos G.P., (2015), Exploring the relationships between post-fire vegetation regeneration dynamics, topography and burn severity: a case study from the Montane Cordillera Ecozones of Western Canada, Applied Geography, 56, 232-248.
Jeffrey S.E., Oakleaf J., (2012), Geomorphometry & Gradient Metrics Toolbox, On line at: http://www.arcgis.com/home/item.html?id=8ec8f5cc3 c8b48f080746c52ddc2fadd.
Jin X., Zhang Y., Schaepman M., Clevers J., Su Z., (2008), Impact of elevation and aspect on the spatial distribution of vegetation in the Qilian mountain area with remote sending data, The International Archives of the Photogrammetry, Remote Sensing and Spatial Information Sciences, 37, 1385-1390.
JRC-EEA., (2005), CORINE land cover updating for the year 2000: image 2000 and CLC2000, In: Products and Methods, Lima V. (Eds.), Report EUR 21757, ENJRC-Ispra, On line at: http://reports.eea.europa.eu/COR0-landcover/en.
Kalivas D., Petropoulos G.P., Athanasiou I., Kollias V., (2013), An intercomparison of burnt area estimates derived from key operational products: analysis of Greek wildland fires 2005-2007, Non-linear Processes in Geophysics, 20, 1-13.
Kandziora M., Burkhard B., Müller F., (2013), Mapping provisioning ecosystem services at the local scale using data of varying spatial and temporal resolution, Ecosystem Services, 4, 47-59.
Karamesouti M., Petropoulos G.P., Papanikolaou I.D., Kairis O., Kosmas K., (2016), An evaluation of the PESERA and RUSLE in Predicting erosion rates at a mediterranean site before and after a wildfire: comparison & implications, Geoderma, 261, 44-58. Kerr J.T., Ostrovsky M., (2003), From space to species:
ecological applications for remote sensing, Trends in Ecology & Evolution, 18, 299-305.
Knorr W., Pytharoulis I., Petropoulos G.P., (2011), Combined use of weather forecasting and satellite remote sensing information for fire risk, fire and fire impact monitoring, Ecological Modeling and Software,
1, 112-120.
Kyzirakosa K., Karpathiotakisa M., Garbisa G., Nikolaoua C., Beretaa K., Papoutsisb I., Herekakisb T., Michailc D., Koubarakisa M., Kontoesb C., (2014), Wildfire monitoring using satellite images, ontologies and linked geospatial data, Web Semantics: Science, Services and Agents on the World Wide Web, 24, 18-26.
Lillesand T.M., Kiefer R.W., Chipman J.W., (2008), Remote Sensing and Image Interpretation, John Wiley & Sons Ltd.
Luo Y.C., Zhou Z.X., Sun Y., Deng H.B., Zhang P., Wu G., (2003), Assessment methods of watershed ecosystem health, Acta Ecologica Sinica, 8, 019.
Maxwell S., Schmidt G., Storey J., (2007), A multi‐scale segmentation approach to filling gaps in Landsat ETM+ SLC‐off images, International Journal of Remote Sensing, 28, 5339-5356.
Millennium Ecosystem Assessment, (2005), Ecosystems and Human Well-Being, Island Press Washington, DC, USA.
Mitsch W.J., (2012), What is ecological engineering?, Ecological Engineering, 45, 5-12.
Mokpidie D., Lazar G., Faciu E., Mossoa L., Ngoufo R., Koko M., Ouessebanga A.M., (2014), Contribution of
GIS to forestry management in central African republic, Environmental Engineering and Management Journal,
13, 1623-1629.
Moore I., Gessler P., Nielsen G.A., Peterson G., (1993), Soil attribute prediction using terrain analysis, Soil Science Society of America Journal, 57, 443-452.
NASA, (2000), REVERB archive, Greenbelt, MD, USA, On line at: http://reverb.echo.nasa.gov/reverb/ Landsat 7 science data users handbook, Greenbelt, MD, USA. NATURA2000 (n.d)., (2013), Natura 2000, Retrieved 2nd
August., (2013), On line at: http://natura.org/. NOA, National Observer for Athens, Diachronic Inventory
of Forest Fires, On line at: http://ocean.space.noa.gr/diachronic_bsm/
Palmer M.A., Filoso S., Fanelli R.M., (2014), From ecosystems to ecosystem services: Stream restoration as ecological engineering, Ecological Engineering, 65, 62-70.
Pausas J.G., Llovet J., Rodrigo A., Vallejo R., (2009), Are wildfires a disaster in the Mediterranean basin? A review, International Journal of Wildland Fire, 17, 713-723.
Petropoulos G.P, Griffiths H.M., Kalivas D., (2014), Spatial and Temporal Ecosystem Recovery Dynamics following a wildfire event in a Mediterranean landscape using EO data and GIS Techniques, Applied Geography, 50, 120-131.
Petropoulos G.P., Knorr W., Scholze M., Boschetti L., Karantounias G., (2010), Combining ASTER multispectral imagery analysis and support vector machines for rapid and cost-effective post-fire assessment: A case study from the Greek Fires of 2007, Natural Hazards and Earth Systems Science, 10, 305-317.
Petropoulos G.P., Kontoes C., Keramitsoglou I., (2011), Burnt area delineation from a uni-temporal perspective based on Landsat TM imagery classification using support vector machines, International Journal of Applied Earth Observation and Geoinformation, 13, 70-80.
Pettorelli N.J, Vik O., Mysterud A., Gaillard J.M., Tucker C.J., Stenseth N.C., (2005), Using the satellite-derived NDVI to assess ecological responses to environmental change, Trends in Ecology & Evolution, 20, 503-510. Preisler H.K., Brillinger D.R., Burgan R.E., Benoit J.,
(2004), Probability based models for estimation of wildfire risk, International Journal of Wildland Fire,
13, 133-142.
Pretty J., Peacock J., Hine R., Sellens M., South N., Griffin M., (2007), Green exercise in the UK countryside: Effects on health and psychological well-being, and implications for policy and planning, Journal of Environmental Planning and Management, 50, 211-231.
Rapport D., Costanza R., McMichael A., (1998), Assessing ecosystem health, Trends in Ecology & Evolution, 13, 397-402.
Said Y.A., Petropoulos G.P., Srivastava P.K., (2015), Assessing the influence of atmospheric and topographic correction on burnt scars identification from high resolution, Natural Hazards, DOI 10.1007/s11069-015-1792-9.
Scaramuzza P., Micijevic E., Chander G., (2004), SLC gap-filled products phase one methodology, Landsat Technical Notes, On line at: http://landsathandbook.gsfc.nasa.gov/data_prod/prog_ sect11_3.html
Seto K., Fleishman E., Fay J., Betrus C., (2004), Linking spatial patterns of bird and butterfly species richness
with Landsat TM derived NDVI, International Journal of Remote Sensing, 25, 4309-4324.
Shakesby R.A., (2011), Post-wildfire soil erosion in the Mediterranean: Review and future research directions, Earth-Science Reviews, 105, 71-100.
Stow D., Daeschner S., Hope A., Douglas D., Petersen A., Myneni R., Zhou L., Oechel W., (2003), Variability of the seasonally integrated normalized difference vegetation index across the north slope of Alaska in the 1990s, International Journal of Remote Sensing, 24, 1111-1117.
Suo A.N, Xiong Y.C, Wang T.M, Yue D.X, Ge J.P., (2008), Ecosystem health assessment of the Jinghe River watershed on the Huangtu Plateau, EcoHealth, 5, 127-136.
Vicente-Serrano S.M., Pérez-Cabello F., Lasanta T., (2011), Pinus halepensis regeneration after a wildfire in a semiarid environment: assessment using multitemporal Landsat images, International Journal of Wildland Fire, 20, 195-208.
Vitousek P.M., Mooney H.A., Lubchenco J., Melillo J.M., (1997), Human domination of earth’s ecosystems, Science, 227, 494-499.
Wang J., Rich P., Price K., Kettle W., (2004), Relations between NDVI and tree productivity in the central
Great Plains, International Journal of Remote Sensing,
25, 3127-3138.
Xiao F., Ouyang H., Zhang Q., Fu B., Zhang Z., (2004), Forest ecosystem health assessment and analysis in China, Journal of Geographical Sciences, 14, 18-24. Xu F.L., Jørgensen S.E., Shu T., (1999), Ecological
indicators for assessing freshwater ecosystem health, Ecological Modeling, 116, 77-106.
Yang X., Chapman G., Young M., Gray J., (2005), Using Compound Topographic Index to Delineate Soil Landscape Facets from Digital Elevation Models for Comprehensive Coastal Assessment, MODSIM 2005 Int. Congress on Modeling and Simulation, Modeling and Simulation Society of Australia and New Zealand. Yi L.Y., Zhao H.H., Yuan Z., Zhou D.L., Liang Y.T.,
(2016), Depression of soil microbial respiration, ammonification and cellulose degradation under the stress of antibiotic residuals, Environmental Engineering and Management Journal, 15, 2189-2194. Zeng X., Dickinson R.E., Walker A., Shaikh M., DeFries R.S., Qi J., (2000), Derivation and evaluation of global 1-km fractional vegetation cover data for land modeling, Journal of Applied Meteorology, 39, 826-839.