Engineering Lessons from the 28 September 2018 Indonesian Tsunami: Scouring 1
Mechanisms and Effects on Infrastructure 2
Clemens Krautwald, M.Sc.1*; Jacob Stolle, Ph.D.2; Ian Robertson, Ph.D., S.E.3, Hendra 3
Achiari, Dr.Eng.4, Takahito Mikami, Dr.Eng.5, Ryota Nakamura, Ph.D.6, Tomoyuki 4
Takabatake, Ph.D.7, Yuta Nishida8, Tomoya Shibayama, Ph.D.9, Miguel Esteban, Ph.D.10, 5
Nils Goseberg, Dr.Eng.11, Ioan Nistor, Ph.D.12. 6
1
Research Associate, Department of Architecture, Civil Engineering and Environmental
7
Sciences, TU Braunschweig, Beethovenstr. 51a, 38106, Braunschweig, Germany, E-Mail:
8
9
2
Assistant Professor, Eau Terre Environment, INRS, 490, Rue de la Couronne, G1K 9A9,
10
Québec, Canada, E-Mail: [email protected]
11
3
Professor of Civil and Environmental Engineering, Department of Civil and
12
Environmental Engineering, University of Hawaii at Manoa, 2540 Dole St, 96822, Hawaii,
13
USA, E-Mail: [email protected]
14
4
Assistant Professor, Faculty of Civil and Environmental Engineering, Institut Teknologi
15
Bandung, Jl. Ganesa No.10, Lb. Siliwangi, Kecamatan Coblong, Kota Bandung, Jawa
16
Barat 40132, Indonesia, E-Mail: [email protected]
17
5
Associate Professor, Department of Urban and Civil Engineering, Tokyo City University,
18
1 Chome-28-1 Tamazutsumi, Setagaya City, Tokyo, 158-0087, Japan, E-Mail:
19
20
6
Associate Professor, Faculty of Engineering, Niigata University, Ikarashi 2 Nocho, Nishi
21
Ward, Niigata, 950-2102, Japan, E-Mail: [email protected]
22
7
Assistant Professor, Department of Civil and Environmental Engineering, Waseda
23
University, 4-1 Okubo 3, Shinjuku-ku, Tokyo, 169-8555, Japan, E-Mail:
24
8
Research Assistant, Department of Civil and Environmental Engineering, Waseda
26
University, 4-1 Okubo 3, Shinjuku-ku, Tokyo, 169-8555, Japan, E-Mail:
27
28
9
Professor, Department of Civil and Environmental Engineering, Waseda University, 4-1
29
Okubo 3, Shinjuku-ku, Tokyo, 169-8555, Japan, E-Mail: [email protected]
30
10
Professor, Department of Civil and Environmental Engineering, Waseda University, 4-1
31
Okubo 3, Shinjuku-ku, Tokyo, 169-8555, Japan, E-Mail: [email protected]
32
11
Professor, Department of Architecture, Civil Engineering and Environmental Sciences,
33
TU Braunschweig, Beethovenstr. 51a, 38106, Braunschweig, Germany, E-Mail:
34
35
12
Professor, Department of Civil Engineering, University of Ottawa, 115
Séraphin-36
Marion, Room HGN215, Ottawa, K1N 6N5, Ontario, Canada, E-Mail: [email protected]
37
38
* Corresponding author: Clemens Krautwald, ORCiD: 0000-0001-8928-1352
Engineering Lessons from the 28 September 2018 Indonesian Tsunami:
40Scouring Mechanisms and Effects on Infrastructure
41The 28th of September 2018 earthquake and tsunami north of Palu, Indonesia, 42
attracted widespread interest from the scientific community due to the unusually 43
large tsunami which occurred after a strike slip earthquake with a relatively small 44
moment magnitude (MW = 7.5). To understand the structural performance of
45
buildings and infrastructure under hydrodynamic loads and its associated effects the 46
authors conducted field surveys of Palu City. Light wooden frame constructions and 47
masonry infill walls were common in the area, some of which were severely 48
damaged by the earthquake and tsunami. Reinforced concrete structures remained 49
predominantly intact, though suffered soil-related issues such as scour around rigid 50
building members. Local structural failures caused by the loss of supporting soil were 51
also observed during the field survey, resulting in an overall reduction in the stability 52
of the inspected structures. Based on the observations made, knowledge gaps and 53
research needs concerning coastal and structural scouring are discussed. These are 54
tied into the latest community research activities and put in the context of the 55
published tsunami design standard in Chapter 6 of ASCE 7-16 (2017). 56
Keywords: Palu tsunami; field survey; scouring mechanisms; hydrodynamic forces; 57
coastal engineering; engineering lessons 58
1 Introduction 59
Palu City is situated on the southern shore of a bay on the northwest side of the Central 60
Sulawesi province of Indonesia. The bay has a length of about 30 km, widths of between 6 61
and 7 km and depths of up to 700 m (Takagi et al. 2019). The province is in a region that is 62
vulnerable to earthquakes that is surrounded by multiple subduction zones and faults, 63
including the active Palu-Koro strike-slip fault, which traverses Palu City (Bahar et al. 64
1997). Prasetya et al. (2001) reported two tsunami events originating from this fault in Palu 65
Bay, the first of which occurred on December 1st 1927 and the second one on August 14th 66
1968. The moment magnitudes of these earthquake events were relatively small: MW = 6.3
67
in 1927 and MW = 7.4 in 1968. However, these events triggered tsunami wave heights of
68
15 m and 10 m in 1927 and 1968, respectively (Prasetya et al. 2001). Both tsunamis were 69
triggered by a strike-slip tectonic rupture motion, which usually does not favor the 70
generation of such phenomena (Papadopoulos 2016), demonstrating that tectonic rupture 71
motions and resulting tsunami magnitudes sometimes diverge. 72
A strike-slip earthquake with a MW = 7.5 occurred near Palu City on the 28th of
73
September 2018, at 18:02:43 local time. The epicentre was located approximately 100 km 74
north east of the city at a depth of 20 km (USGS 2018). Tsunami waves were triggered and 75
were reported to have unusually high inundation depths and rapid arrival times, despite the 76
relatively modest magnitude and tectonic motion of the earthquake. Aránguiz et al. (2019) 77
numerically analysed possible secondary landslide generation mechanisms using measured 78
bathymetry data and visual observation of possible locations of underwater landmass 79
movements. Numerical simulations were performed to assess the sequence of this tsunami 80
event, which indicated that a superposition of the seismic event and waves generated by a 81
series of landslides led to the tsunami impact in Palu City. Sassa and Takagawa (2018), 82
stressed that liquefaction due to the earthquake was observed not only inland but also along 83
the coastline. Therefore, the submarine landslides were characterized as liquefied gravity 84
flows. Overall, the scientific community is in good agreement that coastal landslides played 85
an important contribution to the generation mechanism of this tsunami phenomenon and 86
found evidence for them at 6 (Arikawa et al. 2018), 12 (Omira et al. 2019, Widiyanto et al. 87
2019) and 13 (Robertson et al. 2019) locations. Additionally, energy focusing due to the 88
offshore bathymetry and shape of Palu Bay contributed to the high wave heights near Palu 89
City (Ulrich et al. 2019). 90
A reconnaissance team led by the Waseda University, Japan, consisting of members 91
from Japan, USA, Indonesia, Canada and Germany, visited Palu Bay from the 27th to 31st 92
of October 2018. The objectives of this post-tsunami survey were to investigate the tsunami 93
generation mechanisms, to collect data concerning the flooding extent, and to reveal 94
knowledge gaps in tsunami-driven structural failure modes. The present work focuses on 95
the hydrodynamic loading and scouring around structures, comparing them with recent 96
tsunami design practices. The ultimate goal is to provide insights that tie knowledge from 97
the post-hazard survey to current design standards, and to specifically elucidate relevant 98
knowledge gaps pertaining to soil instability uncovered during the literature review, field 99
campaign, and analysis. 100
The paper is structured as follows: Section 2 describes the current state-of-the-art in 101
tsunami-resistant design, including uplift forces on structures, soil stability, and the 102
geotechnical considerations. This literature review is specifically provided to lay the basis 103
to interpret the observations made during the post-disaster survey. Section 3 focuses on the 104
methodology of the field survey and the general characteristics of the tsunami event and 105
site-specific structures. Structural failures observed during the post-tsunami survey are 106
categorized according to uplift forces, soil stability and scour-induced structural failures, 107
which are presented in Section 4. The engineering lessons learned during the post-tsunami 108
survey are summarized in Section 5. Conclusions are presented Section 6. 109
2 Review of Relevant Tsunami-Resistant Design Aspects 110
2.1 Uplift Forces 111
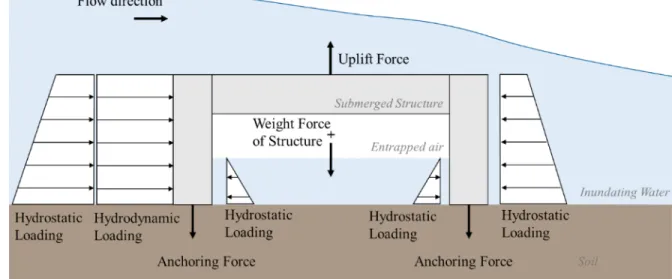
ASCE 7-16 Chapter 6 (2017) distinguishes between hydrostatic and hydrodynamic uplift 112
forces (see Figure 1). Hydrostatic uplift forces are mainly induced by buoyancy, which 113
depends on the displaced water volume by structural components, enclosed air-tight 114
volumes below the inundation level, floor soffits and structural slabs. Entrapped air under 115
girders should also be considered in the displaced water volume. Structural components 116
which are expected to collapse during inundation decrease the buoyancy forces as result of 117
the increased air outflow (ASCE 7-16 2017). Hydrodynamic forces are generally divided 118
into drag forces, hydrodynamic uplift forces and impulsive forces (Palermo et al. 2013). 119
120
Figure 1: Vertical forces and horizontal pressure distributions on a submerged structure during tsunami inundation. 121
Additional uplift forces occur when a tsunami inundates a structure with entrapped 122
air in it. Seiffert et al. (2014) and Seiffert et al. (2015) investigated nonlinear wave loading 123
on coastal bridge decks, either using simplified plates only or including girders. When 124
waves inundate a bridge deck with girders, air can be trapped in the gap between two 125
girders. Dynamic water motion leads to the compression of the entrapped air and to impulse 126
pressure peaks at the bridge decks. Seiffert et al. (2015) experimentally analysed the effects 127
of air relief openings and found a significant reduction of vertical uplift forces when large 128
openings are present. Further, Moideen et al. (2019) built upon the experimental data to 129
perform a parametric study on vertical impact forces with the computational fluid dynamics 130
(CFD) model REEF3D (Bihs et al. 2016), analysing the effect of wave heights, girders 131
spacing and depth for varying air gaps. That study confirmed higher vertical impact forces 132
for bridge decks with girders where air can be trapped. Furthermore, vertical impact forces 133
were found to increase for larger air gaps and for smaller girder spacing. Whereas the 134
ASCE 7-16 Chapter 6 (2017) mentions entrapped air as a potential source of uplift force, 135
the current version of the standard does not yet detail precise calculation methods for the 136
impact uplift pressure on horizontal structures incorporating entrapped air. Del Zoppo et al. 137
(2019) address the effect of tsunami-induced vertical loads, including buoyancy, on the 138
design of reinforced concrete frame structures. The need for more in-depth prescriptions 139
was also highlighted in a previous post-tsunami field surveys identifying the overturning 140
failure of a four-story RC building in Onagawa City, Japan, during the 2011 Tohoku 141
Earthquake and Tsunami as a result of combined hydrodynamic loading, buoyant forces 142
with trapped air and pore pressure softening (Yeh et al. 2013). 143
2.2 Soil Stability 144
General Erosion 2.2.1
145
During foundation design of tsunami-resilient structures, soil instabilities, such as erosion 146
and pore pressure softening, have to be considered. Erosion may take a number of forms: 147
(a) general erosion marking a loss of land surface over large spatial extents (Dalrymple and 148
Kriebel 2005, Shuto and Fujima 2009, Kato et al. 2012, Yeh et al. 2013, Fraser et al. 2013), 149
(b) sustained flow scour near corners and sides around free-standing structures, with scour 150
depth ranging from 0.5 - 4.0 m being reported by post-tsunami field surveys (Bricker et al. 151
2012, Tonkin et al. 2013), (c) channelized scours in between gaps of larger buildings, as 152
reported by Yeh et al. (2013) in the city of Onagawa, Japan during the 2011 Tohoku 153
Earthquake Tsunami, and (d) overtopping scour behind coastal line defenses such as sea 154
walls, where overtopping jets plunging over the structures cause excessive soil erosion 155
(Yeh et al. 2004, Kato et al. 2012, Mikami et al. 2014, Jayaratne et al. 2016). All forms of 156
scouring listed above may, when the extreme flow event is persistent and exposes the soil 157
to shear stresses larger than the critical shear stress, result in scouring that could eventually 158
damage structures; only recently, guidelines and standards have started to address this 159
important issue. According to the ASCE 7-16 Chapter 6 (2017), different load cases should 160
include simultaneous considerations of scour, seismic liquefaction and pore pressure 161
softening when assessing the foundation stability. Critical load cases include (a) soil 162
saturation before tsunami inundation, (b) soil saturation during tsunami inundation and (c) 163
cases when the area is still inundated after the tsunami (ASCE 7-16 2017). 164
General erosion is typically expressed in terms of the Mohr-Coulomb (Mohr 1914) 165
or the Shields criterion (Shields 1936, Rijn 1993). Manenti et al. (2012) carried out 166
experimental and numerical analysis of rapid water discharge to compare the practical 167
applicability of the approaches of Mohr-Coulomb and Shields. The study determined that 168
the Shields approach better represents sediment dynamics and to be of higher practical use, 169
as the parameters are based on measurable physical quantities. ASCE 7-16 Chapter 6 170
(2017) states that general erosion shall be determined according to standard literature or 171
models, such as the numerical software HEC-RAS (USACE 2016), which incorporates the 172
Shields approach. The Shields parameter was originally derived for the incipient movement 173
of sediment particles in hydraulic experiments (Shields 1936). Nowadays, the Shields 174
parameter has been adapted and extensively used to describe sediment transport for a 175
variety of flow conditions in marine environments (Madsen and Grant 1976, Rijn 1984, 176
Sumer and Fredsoe 2002). 177
Quasi-steady flow conditions occur when the tsunami inundation motion forms an 178
overland current during run-up and draw-down phases. Transient flow conditions with 179
varying flow velocities and pressures happen between these two phases. Yeh and Mason 180
(2014) modified the Shields parameter in relation to tsunami inundation to include the 181
effect that soil is stabilized during tsunami run-up due to a positive pore pressure gradient 182
and destabilized during draw-down when there is a negative pore pressure gradient. 183
More recent research questions the usability of the Shields approach when assessing 184
the incipient motion for non-uniform sediments, wide-graded materials (where other issues 185
such as hiding and exposure effects can be important). Hiding effects require higher shear 186
stresses to mobilize finer sediments when coarser grains surround them, while the exposure 187
effect qualifies the decreased resistance of coarse grains due to their unstable placement on 188
finer sediments. Shvidchenko et al. (2001) proposed to use statistical parameters such as the 189
relative grain size to include these effects. Further research was performed by Schendel et 190
al. (2016) and Schendel et al. (2018) to investigate the stability of wide-graded material 191
under unidirectional and reversing currents. Both studies emphasized that the Shields 192
approach is insufficient to assess the erosion-stability and the average grain diameter 𝑑𝑑50 is 193
insufficient to adequately represent the material characteristics. 194
Resistance to scour is defined by soil properties such as soil type, grain sizes,
195
permeability and saturation, while acting forces on the soil depend on hydrodynamic
196
parameters such as flow velocity, flow depths, directions and turbulence intensities (Francis
197
2006). In built-up environments, flow properties can depend on structural and 198
topographical layouts, such as the spacing, sizes, shapes and orientation of buildings 199
(Goseberg 2013). Results of a post-tsunami survey by Yeh et al. (2013) after the 2011 200
Tohoku Earthquake Tsunami indicated the flow amplifying effects of large RC buildings, 201
leading to higher bottom shear stresses and increased sediment transport next to structures 202
due to channelization and the formation of jets. To conclude, the physical processes leading 203
to sediment transport and soil instabilities are complex and not entirely understood. Further
204
research is needed to elucidate these processes and include them in current guidelines and 205
standards such as ASCE 7-16 (2017). 206
Pore Pressure Softening 2.2.2
207
The load bearing potential of soil relies on the contact between grains. Changes in 208
hydrostatic pressure, ground shaking, dislocations and infiltration of water, may 209
substantially increase pore pressure and reduce thisits load bearing capacity. When the pore
210
pressure force exceeds the gravity acting on the soil, pore pressure softening occurs. When 211
the induced pore pressures exceeds the overburden weight pressure, momentary 212
liquefaction can take place liquefaction (Sumer and Fredsoe 2002). This is a particular risk 213
during the draw-down sequence of a tsunami where hydrostatic loads on the soil may
214
decrease rapidly and the excessremaining high pore pressures, previously built up inside the 215
soil during inundation, lead to upward directed forces within the soil matrix (Yeh and 216
Mason 2014). Excess pore pressure can be induced by external forces and is not released
217
during tsunami draw-down for the case of soils with low permeability. Thereby, pore water
218
pressures can accumulate up to the overburden weight pressure and reduce the vertical
219
effective stress in the soil matrix (Yeh and Mason 2014). ASCE 7-16 Chapter 6 (2017)
220
differentiates tsunami-induced pore pressure softening from seismic liquefaction. Whereas
221
seismic liquefaction occurs during the high frequency shaking of the ground, pore pressure
222
softening is the result of a long period inundation loading followed by a rapid drawdown,
223
leading to an abrupt release of hydrostatic pressure.
224
Tonkin et al. (2003), Yeh et al. (2004) and Tonkin et al. (2013) derived an equation 225
to describe the depth ds of tsunami-induced liquefaction based on the one-dimensional 226
consolidation model with an excess pore pressure field from Terzaghi (1925). These studies 227
built upon a scour enhancement parameter, which defines the critical fraction of the 228
buoyant weight of soil supported by pore pressure. Yeh et al. (2013) identified a tsunami-229
induced increase of pore pressure that reduced the shear strength of the soil around piles, 230
leading to the structural failure of a four-story building in Onagawa. A recent numerical 231
analysis of the pore water pressure in fully saturated beds under earthquake and tsunami-232
impact by Qiu and Mason (2019) stressed that hydraulic conductivity and soil layering 233
strongly influence the pore water pressure response. 234
All in all, tsunami-induced soil instability is a potential threat to the overall stability 235
of structures, as seen in a number of post-tsunami surveys e.g. in Dalrymple and Kriebel 236
(2005), Yeh and Mason (2014) and Jayaratne et al. (2016). 237
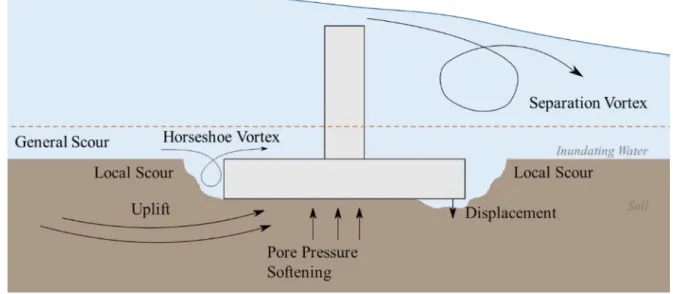
2.3 Geotechnical Considerations 238
ASCE 7-16 Chapter 6 (2017) makes provisions for general erosion, local scour, and loss of 239
shear strength as a result of pore pressure softening and displacement in the foundation 240
design. General erosion has to be considered during run-up and draw-down. Special 241
attention should be devoted to areas where flow velocity amplification due to the 242
obstruction caused by buildings is possible, or at places where re-acceleration due to 243
topography gradients and tsunami-induced pore pressure softening might occur (see 244
Figure 2). 245
246
Figure 2: Soil considerations on a foundation system during tsunami inundation (adapted from ASCE 7-16, 2017). 247
ASCE 7-16 Chapter 6 (2017) considers sustained flow and plunging scour. 248
Sustained flow scour results from flow acceleration around structures and building corner
249
piles, whereas plunging scour occurs where the tsunami flow passes over an obstruction
and drops onto the ground below (ASCE 7-16 2017). Estimating scour depths of sustained
251
flow scour can be accomplished by experimental and numerical modelling in cases where 252
design equations are missing, or by employing stipulations given in ASCE 7-16 Chapter 6 253
(2017) for sustained flow scour. This type of scour includes the effects of pore pressure 254
softening due to rapidly changing water levels, which can be estimated with an empirical 255
formula that depends on the flow depth. Flows with less critical flow velocities and lower 256
abilities to initiate sediment transport are evaluated by means of the Froude number. 257
Plunging scour downstream of structures occurs when a flow overtops them.
258
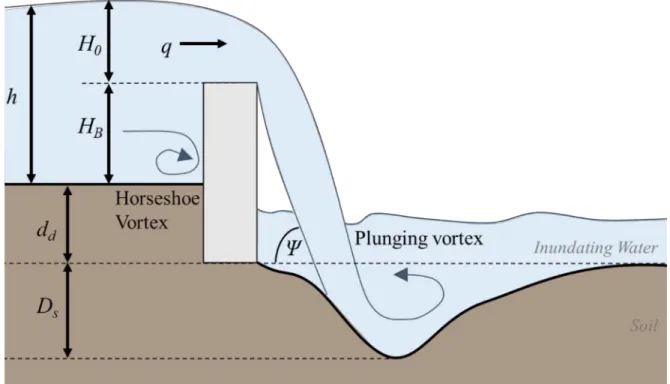
Equations for estimating plunging scour depths are given in ASCE 7-16 Chapter 6 (2017) 259
based on physical model results by Fahlbusch (1994), as described in Hoffmans and 260
Verheij (1997), and the post-tsunami survey results of Tonkin et al. (2013), see Figure 3. 261
Hydrodynamic and geometrical parameters are critical in these equations, though soil 262
properties are not included. 263
264
Figure 3: Parameters to describe the process of plunging scour (adapted from ASCE 7-16, 2017). These include the 265
discharge (q), water depth (h), structure height (HB), overtopping water depth (H0), elevation difference (dd), plunging
266
scour depth (Ds) and the angle between the jet and the soil (Ψ).
267
Numerical and experimental modelling techniques can include the exposure of the 268
structure and soil characteristics and thereby account for retention forces. Zhao et al. (2019) 269
provided a numerical analysis of scour depths due to solitary and tsunami-like waves 270
attacking different sea wall geometries. These authors concluded that the scour depth under 271
tsunami-like conditions can be up to 4 times that under solitary wave conditions. 272
McGovern et al. (2019) reported on an experimental investigation of scour depths around 273
onshore structures induced by tsunami, and differentiate between maximum and final scour 274
depth, as slumping was observed towards the end of inundation. Therefore, post-tsunami 275
surveys might underestimate the maximum scour depth when measuring the final scour 276
depth. 277
Even though latest research indicates dependencies between soil characteristics and
278
scour depths, these parameters are not yet included in the geotechnical considerations of the
ASCE 7-16 (2017). Therefore, this post-tsunami survey aims at gathering field evidence to
280
the interaction between tsunami and scour, taking into consideration local soil properties
281
and hydrodynamic effects, in an attempt to facilitate dedicated future research.
282
3 Field Investigation 283
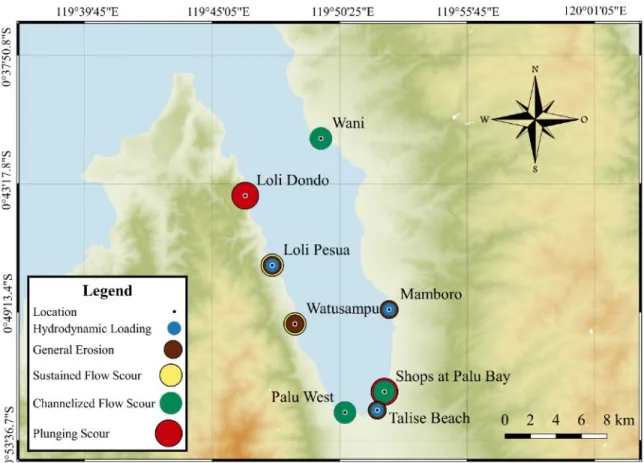
3.1 Site Locations 284
The field investigation covered the coastline starting from Loli Dondo on the west coast of 285
Palu Bay to Wani on the east coast (see Figure 4), focusing on locations that were relevant 286
for assessing damage due to hydrodynamic loading and associated sediment motion. 287
Hydrodynamic loading is discussed at three locations, while new insights regarding general 288
erosion were found at four five locations. The authors describe two locations with sustained 289
flow scour and three cases that experienced channelized flow scour. Additionally, two 290
locations where plunging scour was observed are also reported. 291
292
Figure 4: A selection of site locations visited during the field investigation. 293
Table 1 gives an overview of the survey locations, their geographical coordinates, local 294
time of the site survey and concise descriptions concerning the observed effects. 295
Table 1: Descriptions of site locations mentioned throughout this study. 296
Number Location Longitude (degrees) Latitude (degrees) Local time when survey was conducted Description 1 Loli Dondo 119.776 -0.731 28.10.2018 10:22
Local mosque damage by tsunami inundation and scour around satellite structures.
2 Loli Pesua 119.795 -0.780 28.10.2018 11:06
Small town with a house damaged by uplift of structural slab.
3 Watusampu 119.811 -0.821 28.10.2018 12:39
Military naval base with vessels washed onshore by tsunami. 4 Palu City 119.846 -0.884 28.10.2018
16:23
Local scour around a foundation pile along a former wall.
5 Talise Beach - Palu Pavilion 119.869 -0.882 29.10.2018 10:43
Lookout over Palu Bay, damaged by uplift forces.
6 Shops at Palu Bay
119.872 -0.869 29.10.2018 12:17
Destroyed shops at Palu Bay with sustained flow scour, plunging scour and general erosion.
7 Mamboro 119.877 -0.811 29.10.2018 12:50
Fuel tanks damaged by uplift forces as result of large displaced water volumes.
8 Wani 119.829 -0.690 29.10.2018 17:30
Large cement plant damaged by earthquake, significant scour around the foundation.
3.2 Tsunami Characteristics 297
The 2018 Palu Tsunami consists of a complex interaction of waves generated by seismic 298
action and concurrent landslide dynamics. An analysis by Sassa and Takagawa (2018) 299
implied that less than 20 % of the tsunami height was generated by tectonic processes 300
directly related to the earthquake, with submarine landslide generated waves inducing the 301
remaining. Further amplification of the wave height took place due to the energy focussing 302
effects of Palu Bay towards Palu City, with tsunami waves of various origins 303
superimposing in a wave-amplifying fashion (Aránguiz et al. 2019). 304
Field surveys indicate run-up heights ranging from 0.3 m to 8.0-9.0 m along the 305
circumference of Palu Bay (Omira et al. 2019, Carvajal et al. 2019, Mikami et al. 2019). 306
The inundation depths for site-specific locations outlined in the following section were 307
measured using a laser-ranging instrument (Impulse 200LR, Laser Technology Inc., +/- 308
0.01 m). Generally speaking, lower run-up heights were found on the north west side of 309
Palu Bay near the town of Donggala, while higher run-up heights were mostly observed in 310
the south of the bay. Run-ups heights of 8.0 m were recorded along Watusampu (Carvajal 311
et al. 2019), 6.0-7.0 m in Talise (Omira et al. 2019), 1.5-4.5 m in Palu (Mikami et al. 2019, 312
Widiyanto et al. 2019) and 4.0-5.0 m at Wani (Omira et al. 2019, Carvajal et al. 2019). 313
Inundation distances varied depending on the local topography and wave 314
characteristics. Putra et al. (2019) and Widiyanto et al. (2019) concluded that the inundation 315
distance ranged from 65.36 m at areas with steep slopes such as Loli Dondo to nearly
316
500 m in the north of Talise Beach (which had a flat topography). In Palu City the tsunami 317
travelled approximately 250 m inland due to the flat dense urban geography (Mikami et al. 318
2019, Widiyanto et al. 2019). 319
Eyewitnesses interviewed by the authors reported that the first wave of the tsunami 320
arrived at different locations between 3 to 10 minutes after the earthquake, and that a total 321
of three waves affected the shoreline of Palu Bay. 322
All in all, there is a wide variation of run-up heights and inundation distances along 323
Palu Bay, though all are characterised by their relative high wave height and short periods. 324
Therefore, the damage to structures at each location should be assessed based on locally 325
surveyed wave heights and inundation depths. 326
3.3 Characteristics of Structures and Sediment 327
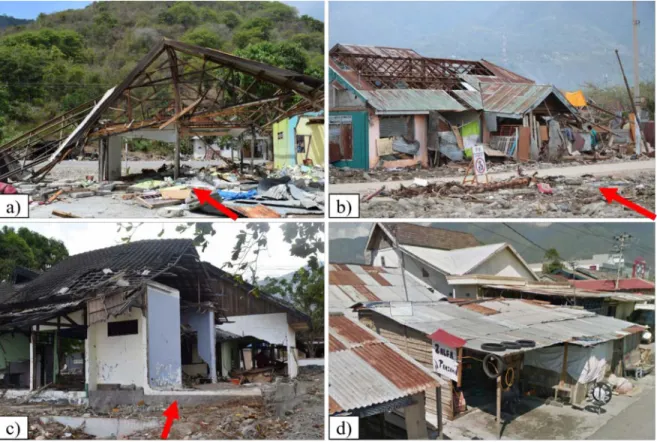
Residential buildings in the Palu area have a variety of construction designs, with Figure 5 328
showing typical light timber constructions, some of which had concrete frames filled with 329
masonry walls or metal sheets (Figure 5 b). Some buildings were constructed out of 330
reinforced concrete, and exhibited greater stability. Many timber constructions and masonry 331
infill walls failed due to tsunami loading (Figure 5 a-c) while solid concrete frames were 332
mostly able to withstand the tsunami impact. 333
334
Figure 5: Typical buildings in Palu City with red arrows indicating the approximate direction of the incoming wave. 335
Pictures a-c) show damaged or demolished buildings, as observed during the post-tsunami survey, while d) is a picture 336
obtained from Google Earth of a simple timber structure in Palu City which was washed away. 337
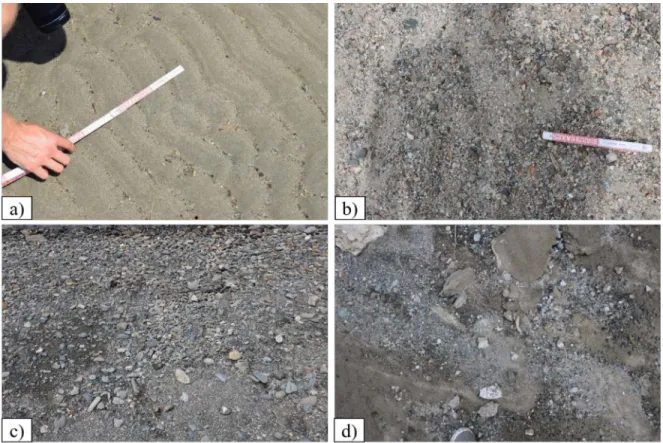
Soil material varied around Palu Bay depending on the location along the coastline 338
and the distance to the shoreline. Figure 6 a) was taken in Palu west and shows fine 339
sediment grains with a rather uniform diameter, while locations near a Palu City shopfront 340
(b), Palu east (c) and Wani (d) show a wide-graded grain size distribution. Generally, the 341
sediment material seemed to be fluvial material with round grains, rather than crushed 342
material with sharp edges. A visual inspection of variation in grain size diameters could 343
help explain some of the exposure and hiding effects discussed later in this paper. However,
344
no soil samples could be taken in this survey, which would allow for performing a sieve
345
curve analysis and investigating soil effects more quantitatively.
347
Figure 6: Sediment types observed in Palu, Indonesia. a) A ruler was placed to obtain a rough estimate of the average 348
grain diameter for Palu west, b) at a shopfront in the east of Palu, c) north of Talise Beach and d) in Wani. 349
4 Observed Effects of Tsunami Inundation 350
4.1 Uplift Forces 351
Hydrodynamic loading is typically attributed to the tsunami flow interacting with 352
structures, either around or beneath them (drag and lift). A highly turbulent tsunami bore 353
travelling inland of a coastal area can be characterized by highly fluctuating flow depths 354
and velocities (Chanson 2009). These characteristics of hydrodynamic forces can induce 355
both uplift and horizontal forces components on structures (Palermo et al. 2013). The 356
effects of vertical uplift forces during tsunami inundation were observedfound during the 357
survey at many locations, including Loli Pesua, the Pavilion at Talise Beach and Mamboro 358
(see Figure 4). 359
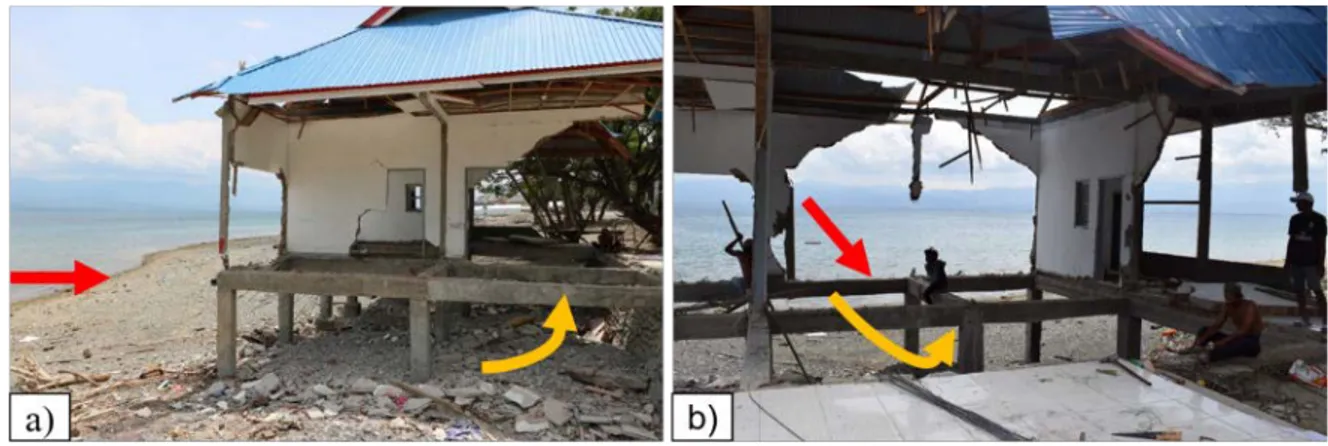
Loli Pesua is a small town located 15 km north-west of Palu City. A road situated 2-360
3 m above sea level traverses the town at a distance of 20 to 50 m from the coastline. The 361
tsunami run-up height at this location was measured to be 3.9 m (Omira et al. 2019). A site-362
cast concrete building located on the leeside of the road was affected by the tsunami, see 363
Figure 7. A retaining wall and two rows of concrete columns, each with four columns 364
(0.3 m × 0.3 m × 2.1 m) parallel to the shoreline, supported the building. Reinforced 365
concrete was used for the frame elements whereas the walls and slab consisted of masonry 366
infill. The frame elements withstood the tsunami impact, though vertical uplift forces on the 367
bottom slab were induced by the incoming tsunami, as its progress was impeded by the 368
retaining wall. 369
370
Figure 7: Site-cast concrete building in Loli Pesua. a) View of the building from the beach and b) showing the destruction 371
to the slab. Red arrows indicate the incoming tsunami flow direction, while yellow arrows indicate the likely flow path 372
under the building. 373
Figure 8 shows the Pavilion at Talise Beach on the east side of Palu City, which 374
serves as a lookout over the bay and is located directly on the coastline, roughly 1 m above 375
sea level. Twelve foundation piles and a retaining wall support the slab. Radial joists 376
directed towards the centre of the semicircle-formed slab connected the piles. Ruptures 377
along the concrete columns indicate that vertical uplift forces were induced due to the 378
tsunami flow entrapped in the wall-slab recess, a situation very similar to what was 379
observed at Loli Pesua. 380
381
Figure 8: The Pavilion located on the east side of Palu City overlooking Palu Bay in a-b). c) Vertical uplift damage was 382
observed through cracks in the piles and in the rear anchoring and d) in the aesthetic tiling. Areas of interest are 383
highlighted by arrows and dotted lines to indicate uplifted tiles and erosion. 384
Damage to both structures seems to have been enhanced by the construction 385
methodology, with a bottom slab placed above joists in front of a retaining wall. This 386
phenomenon of tsunami flow entrapped in structural wall-slab recesses is considered by 387
ASCE 7-16 Chapter 6 (2017) for incoming bore conditions, but no guidance is provided for 388
non-bore (surge) conditions due to the lack of experimental data (Ge and Robertson 2010). 389
Given that the obstructed flow may have developed during the initial approach of the 390
tsunami, it is very likely that a pressure imbalance between hydrostatic and hydrodynamic 391
components led to forces acting in the vertical direction. The uplift force could have moved 392
the slab slightly upwards, as ruptures were found along the concrete columns and at the 393
anchoring to the retaining wall. ASCE 7-16 Chapter 6 (2017) requires that slabs associated 394
with these slab-wall recesses be designed for an uplift pressure of 16.76 kPa (350 psf), 395
which would explain the damage observed in these two survey cases. 396
Inland from the lookout, a two-part sidewalk was found consisting of concrete slabs 397
(Figure 8 a, d). The first row (located behind the lookout step) was heavily damaged and 398
had been transported away, while the second row remained almost unaffected. Water 399
pressure passing the elevated slab may have contributed to uplift of the sidewalk as well as 400
negative pressures due to surpassing flow over the elevated slab. A comparable geometry to 401
investigate separation and reattachment of surpassing flows is the backward-facing step, 402
which has been extensively analysed. This case is often used as a reference for numerical 403
simulations to evaluate the representation of flow phenomena using a simple geometry 404
(Eaton and Johnston 1981, Le et al. 1997, Ratha and Sarkar 2015, Chovet et al. 2018, Wang 405
et al. 2019). Adams and Johnston (1988a, 1988b) found the flow between the wall and the 406
reattachment point to be directed towards the wall, leading to the formation of a vortex and 407
positive pressure gradients. Chovet et al. (2018) analysed pressure distributions and the 408
flow structure, emphasizing the formation of negative pressures upstream of the 409
reattachment point and a forcing roll-up of the vortices. In the Palu lookout, the negative 410
pressures due to the formation of a vortex led to uplift forces in the pavement, which may 411
have caused the destruction of the first row. Comparable mechanisms led to dike failures 412
during the 2011 Tohoku Earthquake and Tsunami, where Kato et al. (2012) found that high 413
flow velocities induced negative pressures at the top of dikes, which lifted up landward and 414
crown armor and led to the failure of the structure. 415
Buoyancy and vertical uplift forces were observed in this field survey at multiple
416
locations, leading to the failure of many structures, particularly when both of these acted 417
simultaneously (with this load combination probably causing the failures shown in Figure 7 418
and 8). The uplift forces caused by a tsunami bore flow that is blocked by solid walls are 419
considered in ASCE 7-16 Chapter 6 (2017), as mentioned earlier. The uplift pressure 420
depends on the ratio of slab soffit elevation to flow depth. Robertson (2014) compared 421
small and large scale experiments concerning uplift forces on slabs with a solid wall 422
blocking the tsunami bore flow behind the slab, showing that maximum uplift pressures of 423
up to 1.4 times the maximum design pressure for ratios of slab soffit elevation to flow 424
depth of 1.0 to 1.5. This maximum might be related to pressure shocks by entrapped air, 425
which is not considered explicitly in ASCE 7-16 Chapter 6 (2017). The investigation of 426
load combinations leading to uplift as a consequence of highly turbulent tsunami flows 427
acting on slabs (including entrapped air as well as blockage by retaining walls) is a 428
significant failure mechanism observed during this field survey. 429
More recently, studies such as Seiffert et al. (2015), Moideen et al. (2019) and 430
Seiffert et al. (2014) have started to look into total vertical forces of solitary and cnoidal 431
waves on coastal bridge decks with openings where entrapped air has the potential to add to 432
the overall force balance by increasing buoyancy. For future studies, it would be crucial to 433
investigate the destabilizing effect of entrapped air within structures exposed to extreme 434
flow conditions, such as broken solitary waves or bores. 435 4.2 Soil Instability 436 General Erosion 4.2.1 437
Throughout the post-disaster survey, erosional patterns and soil instabilities were frequently 438
observed, leading to widespread erosion. Loss of soil support around foundations was 439
found at structures located close to the shoreline, jeopardizing their overall stability. The 440
high flow velocities of the tsunami increased the shear forces on the sediment, leading to 441
suspension transport of the particles. Although a quantification of the amount of sediment 442
or the erosion depths was difficult, as the elevation of the land prior to the tsunami event 443
was not known, some areas interesting areas are outlined below (see Figure 9). 444
445
Figure 9: Eroded areas were found on a) the west coast in Loli Pesua, b) in Watusampu. On the east side of Palu Bay 446
general erosion was observed in c) near the landslide north of Talise and d) at the Mamboro fuel station. Red arrows
447
indicate the flow direction of the incoming tsunami, red dotted lines show the erosion extent while yellow dotted lines
448
show the approximate slope indicating discontinuities.
449
General erosion was found to be accompanied by local discontinuities in the soil
450
matrix, which was observed both on the west coast (see Figure 9 a, b) and on the east coast
451
(Figure 9 c, d) of Palu Bay. Strong discontinuities in the soil matrix were observed at
452
widely-graded soil compositions both in Loli Pesua (Figure 9 a) and at the Mamboro fuel
453
station (Figure 9 d). Narrowly-graded soil compositions were found in front of the
454
discontinuities with larger depths of general erosion. While the erosion at the west coast
could be identified by discontinuities in the soil matrix (see Figure 9 a, b), the east side
456
exhibited more uniform soil erosion (Figure 9 c) or an edge in the soil as a result of varying
457
soil stability (Figure 9 d). A lack of consistency in soil composition can enhance influences
458
general erosion, particularly when infilling soil material is present.Designing tsunami-safe
459
foundations requires reliable assessment of soil stability and soil effects during tsunami
460
inundation, which highlights the importance of an accurate analysis of soil properties in
461
order not to weaken the soil matrix (as discussed earlier, see also Schendel et al. (2016), 462
Schendel et al. (2018) and Shvidchenko et al. (2001) for a description of the soil stability of 463
wide-graded material in extreme flow conditions). 464
Sustained Flow Scour 4.2.2
465
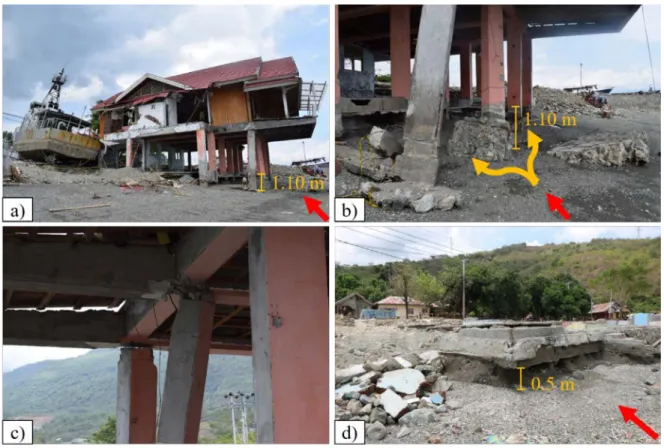
Four reinforced concrete columns in a building near Watusampu Naval Base were damaged 466
as a result of sustained flow scour around their foundations, as seen in Figure 10 a-c). All 467
four columns were supporting a balcony, and were 0.5 m in length and 0.35 m in width. 468
Gravel material supporting the column foundations was eroded, resulting in a final scour 469
depth of approximately 1.1 m. A naval vessel was transported with the flow to higher 470
ground, indicating inundation heights of more than 3 m. According to Andiani et al. (2018), 471
the inundation depth was approximately 4.8 m at the Naval Base. Referring to Chapter 6 of 472
ASCE 7-16 (2017), a maximum scour depth of 3.66 m is reached when the inundation 473
depth exceeds 3.05 m. The scour at this site is well within this ASCE 7-16 Chapter 6 (2017) 474
design limit. 475
476
Figure 10: Effects of sustained flow scour around columns (a-c) in Watusampu and d) around the edge of a bottom slab in 477
Loli Pesua. Red arrows indicate the approximate wave direction and yellow arrows show the likely flow path.
478
Severe damage occurred at two columns on the south east side of this building, 479
where the lack of supporting material led to a decrease in structural stability (Figure 10 c). 480
Tsunami-induced scour adjacent to the column foundations resulted in a decrease in the soil 481
loadbearing capacity. As the scour was larger on the south side, the foundations of both 482
columns moved 0.7 m to the south, resulting in a column inclination angle of 483
approximately 10°. The dislodged foundation led to heavy damage at the interface between 484
the columns and the supported beams, with only exposed reinforcement bars maintaining 485
any connection. This is an indication of tension failure, probably due to subsidence of the 486
foundation elements. Based on several cracks found in the joists and columns, the overall 487
stability of the balcony and the seaward side of the building has been significantly affected 488
by the sustained flow scouring. 489
Further scouring was observed behind the second row of columns in the building 490
structural frame (Figure 10 b). Scour around the columns enabled the flow to further 491
remove sediment under the bottom slab of the building. This bottom slab was made of 492
concrete and masonry infill, and was presumably not designed to resist its own self-weight, 493
so it suffered heavy damage when the supporting soil was removed. 494
Another area with indications of sustained flow scour is Loli Pesua, with 495
Figure 10 d) showing its effects on a concrete slab situated along the coastline. The load-496
bearing capacity of the concrete slab was still present, but it can be assumed that the loss of 497
soil under it due to the tsunami flow reduced structural stability. The scour depth was up to 498
0.5 m at the edge of the concrete slab and extended approximately 0.3 m under the slab. 499
The supporting soil material was widely graded and had median grain size diameters of silt
500
between 0.0063 mm - 0.02 mm. 501
According to ASCE 7-16 Chapter 6 (2017), sustained flow scour can be estimated 502
using empirical guidelines available in literature or, for cases with pore pressure softening, 503
with the aid of physical or numerical models. Tonkin et al. (2013) and Tonkin et al. (2003) 504
developed analytical solutions to calculate the scour depth depending on the water depth, 505
though they do not include the velocity-induced bottom shear stress, typically used to 506
describe the initiation of sediment motion (Sumer and Fredsoe 2002). Further uncertainty 507
may stem from the characterization of the soil by a single grain size without including the 508
grain size distribution,and associated hiding and exposure effects, or the of the soil and the 509
associated entrapped air (Tonkin et al. 2013). In accordance with the observations made in
510
Watusampu, current design methods seem to contain large safety margins due to a lack of
511
knowledge about the influences of soil properties on sustained flow scour.
Channelized Flow Scour 4.2.3
513
Constrictions between rigid structures force the flow to accelerate because of reduced 514
cross-sectional area. This leads to flow velocity increases, which result in increased shear 515
stresses acting on the soil. This phenomenon can be described as scouring induced by 516
channelized flow, which can cause high scour depths (though in general the extent is small, 517
as it is caused by high volume fluxes affecting small cross sections, see ASCE 7-16 (2017). 518
The site locations showing channelized flow scour investigated during this survey are 519
shown in Figure 11. 520
521
Figure 11: Local and channelized flow scour a) on the northern and b) southern corner of the Shops at Palu Bay. c) Scour 522
besides a column foundation. The sheet metal wall on the right side replaces a masonry wall which was destroyed during 523
the tsunami. d) Scour around the silos of a cement packing plant north of Wani. Red arrows indicate the incoming
524
tsunami wave direction while the red dotted lines show the scour extent.
525
Local scour in channelized flow conditions was observed on the north-west and on 526
the south-east side of the shops at Palu Bay. On the north-west, local scour around a 527
building corner was observed. A wall built on the seaward side led to high flow velocities 528
beside it (Figure 11 a), the wall is highlighted in blue black). The maximum scour depth of 529
1.04 m was found directly at the building edge, where the horizontal extent of the scour 530
hole was 3.14 m in the seaward direction and 2.5 m parallel to the coastline. Similar 531
processes can be seen next to the south-east corner, where an irrigation channel forced the 532
flow between the structure and the wall (Figure 11 b). In this constriction the flow induced 533
high shear stresses and thus an increased amount of scouring. The scour depth near the 534
foundation measured up to 1.3 m. 535
On the western side of a building next to the Institut Agama Islam Negeri (IAIN), a 536
sheet metal wall was constructed after the tsunami had damaged an earlier masonry wall 537
(which was washed away, along with paving stones in front of the building, see 538
Figure 11 c). In front of the foundation pile, the pavement was lifted and the underlying 539
sediment was eroded. The channelizing by the masonry wall (right side in Figure 11 c) 540
resulted in scour with a horizontal extent of 4.3 m in the seaward direction and 2.0 m along 541
the building edge. The maximum scouring occurred right in front of the foundation pile, 542
with a depth of 1.2 m. 543
At a cement packing facility about 30 km north east of Palu City concrete slabs 544
surrounding two silos were affected by scouring on the landward (Figure 11 d) and seaward 545
sides. The distance to the coastline prior to the tsunami was about 10 m. The scour between 546
the two silos on the landward side had a lateral extent of 2.8 m and a maximum depth of 547
1.1 m. As seen from the coastline, scour was also observed in front of the left silo, with a 548
lateral extent of 1.5 m and a maximum depth of 1.3 m. Eyewitnesses reported that the 549
initial separation of the connecting slab and tilting of one of the silos was caused by the 550
earthquake, while the subsequent tsunami scoured the soil below and around the slab, 551
further destabilising it. 552
ASCE 7-16 Chapter 6 (2017) references Nouri et al. (2010) who provide empirical 553
equations based on physical experiments concerning current amplification in obstructed 554
flows. These experiments were conducted for a limited amount of blockage ratios (ratio of 555
obstruction width to flume width). Small scale channelization, as seen in Figure 11, with 556
blockage ratios below 0.125 and with inclined flow paths, was not investigated. To prevent
557
structural failure due to channelized scour, extensive studies of flow path geometries and
558
blockage ratios could help to provide more accurate design guidelines.
559
Plunging Scour 4.2.4
560
In Loli Dondo, a wall was built a few meters from the shoreline on the south side of the 561
mosque Masjid Ar-Rahman Loli Dondo (Figure 12 a). During the tsunami, the wall was 562
overtopped and the flow impinged on the soil behind, which caused plunging scour. 563
Besides the plunging scour effect, the tsunami draw-down might have also caused some of 564
this scour (when gravitational forces due to the scour hole accelerated the flow, which 565
could have resulted in a roller-like wave motion further eroding the inland side of the wall). 566
The scour occurred along the entire wall at this location, with a depth of about 0.5 m and a 567
length in the landward direction of about two to five meters. 568
569
Figure 12: Plunging scour behind walls in Loli Dondo a) in the south and b) in the north. c) Plunging scour behind a 570
retaining wall near a construction site and d) behind the shops at Palu Bay. The approximate scour extent is shown in red
571
while the red arrows indicate the wave direction.
572
North of the mosque in Loli Dondo, a circular wall was overtopped by the tsunami, 573
and plunging scour led to sediment loss between the wall and a platform (Figure 12 b). The 574
scour depth behind the wall was around 1.8 m resulting in the partial failure of the wall and 575
in a large amount of eroded sediment, which was meant to support the platform. The 576
sediment was wide-graded and mostly broken pebblesgravel (d50 = 1-4 cm). Similar 577
processes to those described earlier might have been involved in this site, with the initial 578
wave plunging to the backside of the wall, scouring the area behind it and leading to the 579
saturation of the soil beneath. Finally, the receding wave could have taken the saturated 580
sediment water mixture with it, with a roller-like wave motion enhancing sediment 581
transport. 582
Around the shops at Palu Bay in panel c) and d) of Figure 12, general erosion, 583
sustained flows and plunging scour could be observed. These shops were situated at 584
distance of 30 m from the coastline, at an elevation of 4 m above sea level. After the 585
incoming tsunami propagated through the shops in Figure 12 d), the water plunged down 586
and scoured the soil behind the shops. No information about the terrain elevation prior to 587
the tsunami could be found. 588
About 500 m north of the shops a retaining wall between the road and a 589
construction site was overtopped by the flow, see Figure 12 c). The spatial extent of the 590
scour was comparable to an ellipse with a long side of about 40 m (parallel to the coastline) 591
and the short side (orthogonal to the coastline) of about 10 m in length. 592
Plunging scour in Loli Dondo indicates the possibility of self-reinforcing soil effects 593
that can enhance scour during tsunami inundation. Initial plunging forms a scour hole, 594
which might be enhanced by sustained flow scour. When the water stays inside the scour 595
hole, the pore pressure adjusts to the hydrostatic pressure. Further sediment transport is 596
initiated if momentary liquefaction occurs during the receding wave, due to the sharp 597
decline in hydrostatic pressure. Structural stability could be greatly affected due to the 598
creation of large scour holes beside the foundations. 599
4.3 Scour-induced Structural Failure 600
On the east side of Palu Bay, approximately 5 km north of Palu City, the survey team
601
surveyed a construction site located 30 m from the shoreline (Figure 13 a). Scour under the 602
slab-on-grade was observed at various locations in the building, as high velocity flows 603
passed over the structure and plunged down. This could have induced negative pressures on 604
the slab-on-grade and in the soil due to the presence of joints between the slab and edge 605
beam, which induced uplift and led to the failure (refer to Figure 2). 606
607
Figure 13: a) Scour under the slab of a construction site on the east side of the bay in and b) scour in front of a column 608
and under the slab of the shops at Palu Bay. Red dotted lines indicate the areas of interest while the red arrow shows the
609
approximate wave direction.
610
Scour underneath foundations was observed at the shops at Palu Bay (Figure 13 b). 611
Similar to the case of the construction site, the sediment underneath the slab could have 612
been pressurized by the flow separation after passing the slab edge beam. Figure 14 shows 613
a sequence of the possible process of the damage that could have lead to the failure of the 614
slab in Figure 13 b). Debris was found inside the building, which may have damaged the 615
tiles upon impact and thereby lead to a partially damaged slab. These debris were probably 616
asphalt pieces released from the street adjacent to the construction site and transported with 617
the flow. The water flow intruded into these partially damaged slabs, allowing for 618
pressurization or erosion of the supporting sediment, and led to further scouring. The 619
spatial extent of damage to the bottom slab destruction varied depending on the local 620
hydrodynamic conditions, which may be overlapped with initial damage caused by debris 621
as entry points for scouring. 622
623
Figure 14: Combined loading of tumbling debris impact, sediment erosion and subsequent failure. 624
5 Engineering Lessons Learned 625
Based on the observations outlined earlier, a range of structural engineering lessons and 626
conclusions could be obtained, some of which are only partially addressed in current 627
tsunami guidelines: 628
(1) ASCE 7-16 Chapter 6 (2017) considers uplift forces on wall-slab recesses for bore 629
conditions based on the experimental results of Ge and Robertson (2010) and 630
Takakura and Robertson (2010). However, this research has primarily focused on 631
bore flow conditions, whereas surge conditions have not yet been included in 632
tsunami design guidelines. 633
(2) Pressure distributions and sediment transport due to the formation of vortices or 634
roller-like wave motions were seen to be important mechanisms behind solid 635
structures. Hydrodynamic loading associated with separation and reattachment flow 636
over backward-facing steps, as well as soil instabilities due to the formation of 637
roller-like wave motions, induced negative pressures and led to failure at the 638
Pavilion at Talise beach and enhanced sediment transport at Loli Dondo. Further 639
systematic research of reattachment lengths and pressure distributions associated 640
with the roll-up of vortices is necessary in order to provide guidelines for coastal 641
structures such as dikes and breakwaters, where negative pressures might lead to 642
enhanced sediment transport or even structural failures. 643
(3) Maximum scour depths are defined in ASCE 7-16 Chapter 6 (2017) and are based 644
on post-tsunami field observations and take into account the design inundation 645
depth, whereas the most crucial parameter for sediment transport is the applied 646
shear stress, which depends mainly on the flow velocity. Despite the fact that the 647
flow velocity and inundation depth are linked, several uncertainties in describing the 648
tsunami-bore velocity and direction exist when estimating flow velocities of a bore 649
travelling over land (Nistor et al. 2009). These uncertainties are relevant for 650
assessing structural damages as well as the effect of the flow on the soil, which 651
makes it crucial to gain further insights into the tsunami inundation velocity under 652
bore and non-bore conditions. 653
(4) Grain sizes and gradation vary greatly along the coastline of Palu Bay. The 654
influence of hiding and exposure effects on the soil stability have only recently 655
started to be addressed, and are not taken into account in existing tsunami 656
engineering guidelines. More research must be performed on flows with long wave 657
periods, such as tsunamis, and their influence on wide-graded sediment material. 658
Additionally, the influence of wide gradation is not included in tsunami design 659
procedures concerning pore pressure softening and related liquefaction, which is an 660
additional research area to focus on. 661
(5) A large extent of plunging scour of wide-graded soil material was observed in Loli 662
Dondo and near the shops at Palu Bay. To improve the erosion stability of soils near 663
foundations, the influence of gradation on time-dependent pore water pressures in 664
plunging scour environments should be investigated. 665
(6) Pore pressure softening is a crucial soil effect during tsunami inundation, which can
666
affect general erosion as well as scour. The quantitative impact of pore pressure
667
softening on soil erosion cannot be determined during post-tsunami field surveys
668
due to limitations in data acquisition. Therefore, further systematic research is
669
needed to determine and understand the governing hydrodynamic and geotechnical
670
parameters. Physical system understanding could be improved for example by
671
employing model tests in large-scale facilities with the overarching goal to establish
672
process-based design equations.
673
(7) Load combinations can cause more severe damages than single load cases. Initial 674
debris impact on slabs can facilitate scouring underneath it, leading to its 675
destruction, as was seen in newly constructed buildings on the east side of Palu. 676
This was established for a single load case, though further load case combinations 677
should be determined and investigated to be able to predict subsequent failures. 678
6 Conclusions 679
Post-tsunami survey findings in the aftermath of the 2018 Palu tsunami were presented and 680
compared with tsunami design guidelines (ASCE 7-16 2017) and the latest research in the 681
field of hydrodynamic uplift forces and geotechnical considerations, such as erosion, scour 682
and pore pressure softening. The structural failures of slabs due to negative pressures were 683
seen to occur due to local varying flow velocities. While giving straightforward tsunami 684
design guidelines, Chapter 6 in ASCE 7-16 (2017) relies mostly on simplified empirical 685
guidelines, which can be complemented by newer research findings. Further research 686
regarding uplift forces on wall-slab recesses during surge conditions could reduce the costs 687
of building tsunami resilient communities where bore conditions do not apply. Another key 688
finding is the dependency between soil effects and the gradation of sediment grains. The 689
influence of hiding and exposure effects on wide-graded sediment should be further 690
investigated in order to provide reliable dynamic assessments of scour depths during 691
tsunami inundation. To conclude, the findings of this and other surveys provide the 692
opportunity to direct research activities and the development of engineering methods to aid 693
in the design of tsunami-resilient communities. 694
Data Availability Statement 695
All data, photographs, or sketches that support the findings of this study are available from 696
the corresponding author upon reasonable request. 697
Disclosure Statement 698
No potential conflict of interest was reported by the authors. 699
Acknowledgements 700
A part of the present work was performed as a part of activities of Research Institute of 701
Sustainable Future Society, Waseda Research Institute for Science and Engineering, 702
Waseda University, Tokyo, Japan. 703
References 704
Adams, E. W., and J. P. Johnston. 1988a. Effects of the separating shear layer on the reattachment 705
flow structure - Part 2: Reattachment length and wall shear stress. Experiments in Fluids 706
6:493–499. doi: 10.1007/BF00196511. 707
Adams, E. W., and J. P. Johnston. 1988b. Effects of the separating shear layer on the reattachment 708
flow structure - Part 1: Pressure and turbulence quantities. Experiments in Fluids 6:400– 709
408. doi: 10.1007/BF00196485. 710
Andiani, O. Oktariadi, and A. Kurnia. 2018. Di Balik Pesona Palu: Anomali Perilaku Gelombang 711
Tsunami. . Badan Geologi. 712
Aránguiz, R., M. Esteban, H. Takagi, T. Mikami, T. Takabatake, M. Gómez, J. González, T. 713
Shibayama, R. Okuwaki, Y. Yagi, K. Shimizu, H. Achiari, J. Stolle, I. Robertson, K. Ohira, 714
R. Nakamura, Y. Nishida, C. Krautwald, N. Goseberg, and I. Nistor. 2020. The 2018 Palu 715
Tsunami as a combination of several landslides and co-seismic tsunami effects. Nature. 716
Arikawa, T., A. Muhari, Y. Okumura, Y. Dohi, B. Afriyanto, K. A. Sujatmiko, F. Imamura, and, 717
and, and, and, and and. 2018. Coastal Subsidence Induced Several Tsunamis During the 718
2018 Sulawesi Earthquake. Journal of Disaster Research 13:sc20181204. doi: 719
10.20965/jdr.2018.sc20181204. 720
ASCE 7-16. 2017. Minimum Design Loads and Associated Criteria for Buildings and Other 721
Structures. . American Society of Civil Engineers. 722
Bahar, I., I. Effendi, E. T. Putranto, and D. Sukarna. 1997. Earthquake Monitoring in Indonesia. . 723
Islamic Educational, Scientific and Cultural Organization (ISESCO). 724
Bihs, H., A. Kamath, M. A. Chella, A. Aggarwal, and Ø. A. Arntsen. 2016. A new level set 725
numerical wave tank with improved density interpolation for complex wave 726
hydrodynamics. Computers & Fluids 140:191–208. doi: 10.1016/j.compfluid.2016.09.012. 727
Bricker, J., M. Francis, and A. Nakayama. 2012. Scour depths near coastal structures due to the 728
2011 Tohoku Tsunami. Journal of Hydraulic Research 50:637–641. doi: 729
10.1080/00221686.2012.721015. 730
Carvajal, M., C. Araya-Cornejo, I. Sepúlveda, D. Melnick, and J. S. Haase. 2019. Nearly 731
Instantaneous Tsunamis Following the Mw 7.5 2018 Palu Earthquake. Geophysical 732
Research Letters 46:5117–5126. doi: 10.1029/2019gl082578. 733
Chanson, H. 2009. Current knowledge in hydraulic jumps and related phenomena. A survey of 734
experimental results. European Journal of Mechanics-B/Fluids 28:191–210. 735
Chovet, C., M. Lippert, L. Keirsbulck, and J.-M. Foucaut. 2018. Unsteady Behavior of a Backward-736
facing Step in Forced Flow. Flow, Turbulence and Combustion 102:145–165. doi: 737
10.1007/s10494-018-9944-0. 738
Dalrymple, R., and D. Kriebel. 2005. Lessons in engineering from the tsunami in Thailand. The 739
Bridge 35:4–13. 740
Eaton, J. K., and J. P. Johnston. 1981. A Review of Research on Subsonic Turbulent Flow 741
Reattachment. AIAA Journal 19:1093–1100. doi: 10.2514/3.60048. 742
Fahlbusch, F. E. 1994. Scour in rock riverbeds downstream of large dams. The International Journal 743
of Hydropower & Dams. 744
Francis, M. J. 2006. Tsunami Inundation Scour of Roadways, Bridges and Foundations - 745
Observations and Technical Guidance from the Great Sumatra Andaman Tsunami. . 746
EERI/FEMA NEHRP Professional Fellowship Report. 747
Fraser, S., A. Raby, A. Pomonis, K. Goda, S. C. Chian, J. Macabuag, M. Offord, K. Saito, and P. 748
Sammonds. 2013. Tsunami damage to coastal defences and buildings in the March 11th 749
2011 Mw9.0 Great East Japan earthquake and tsunami. Bulletin of Earthquake Engineering 750
11:205–239. doi: 10.1007/s10518-012-9348-9. 751
Ge, M., and I. N. Robertson. 2010. Uplift Loading on Elevated Floor Slab due to a Tsunami Bore. . 752
University of Hawaii, Manoa. 753
Goseberg, N. 2013. Reduction of maximum tsunami run-up due to the interaction with beachfront 754
development–application of single sinusoidal waves. Natural Hazards and Earth System 755
Science 13 (2013), Nr. 11. 756
Hoffmans, G. C. J. M., and H. J. Verheij. 1997. Scour Manual. . A. A. Balkema. 757
Jayaratne, R., B. Premaratne, A. Abimbola, T. Mikami, S. Matsuba, T. SHIBAYAMA, M. Esteban, 758
and I. Nistor. 2016. Failure Mechanisms and Local Scour at Coastal Structures Induced by 759
Tsunami. Coastal Engineering Journal. doi: 10.1142/S0578563416400179. 760
Kato, F., Y. Suwa, K. Watanabe, and S. Hatogai. 2012. Mechanisms of Coastal Dike Failure 761
Induced by the Great East Japan Earthquake Tsunami. Coastal Engineering Proceedings 762
1:40. doi: 10.9753/icce.v33.structures.40. 763
Le, H., P. Moin, and J. Kim. 1997. Direct Numerical Simulation of Turbulent Flow over a 764
Backward-Facing Step. Journal of Fluid Mechanics 330. doi: 765
10.1017/S0022112096003941. 766
Madsen, O. S., and W. D. Grant. 1976. Quantitative description of sediment transport by waves. 767
Coastal Engineering. 768
Manenti, S., S. Sibilla, M. Gallati, G. Agate, and R. Guandalini. 2012. SPH Simulation of Sediment 769
Flushing Induced by a Rapid Water Flow. Journal of Hydraulic Engineering 138:272–284. 770
doi: 10.1061/(asce)hy.1943-7900.0000516. 771