HAL Id: in2p3-00433527
http://hal.in2p3.fr/in2p3-00433527
Submitted on 19 Nov 2009HAL is a multi-disciplinary open access
archive for the deposit and dissemination of sci-entific research documents, whether they are pub-lished or not. The documents may come from teaching and research institutions in France or abroad, or from public or private research centers.
L’archive ouverte pluridisciplinaire HAL, est destinée au dépôt et à la diffusion de documents scientifiques de niveau recherche, publiés ou non, émanant des établissements d’enseignement et de recherche français ou étrangers, des laboratoires publics ou privés.
The effect of high power ultrasound on an aqueous
suspension of graphite
Fabrice Guittonneau, Abdesselam Abdelouas, Bernd Grambow, Sandrine
Huclier
To cite this version:
Fabrice Guittonneau, Abdesselam Abdelouas, Bernd Grambow, Sandrine Huclier. The effect of high power ultrasound on an aqueous suspension of graphite. Ultrasonics Sonochemistry, Elsevier, 2010, 17, pp.391-398. �10.1016/j.ultsonch.2009.08.011�. �in2p3-00433527�
Figure 1: Decrease of the particle size by ultrasonic treatment on graphite powder
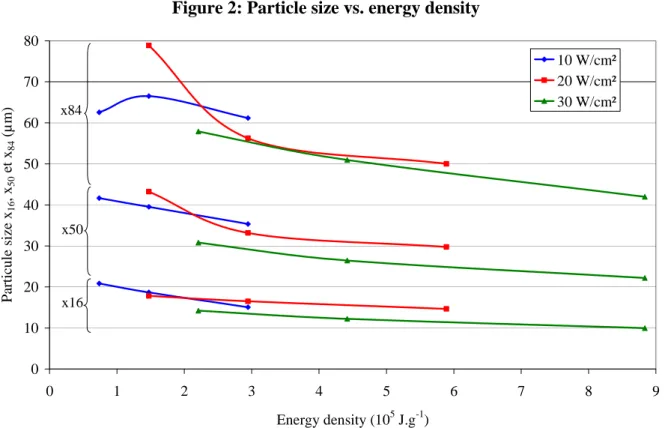
0 1 2 3 4 5 6 7 0 10 20 30 40 50 60 70 80 90 100 Particle diameter (µm) % V o l 10W/cm² 25min 10W/cm² 50min 10W/cm² 100min 20W/cm² 25min 20W/cm² 50min 20W/cm² 100min 30W/cm² 25min 30W/cm² 50min 30W/cm² 100min ReferenceFigure 2: Particle size vs. energy density
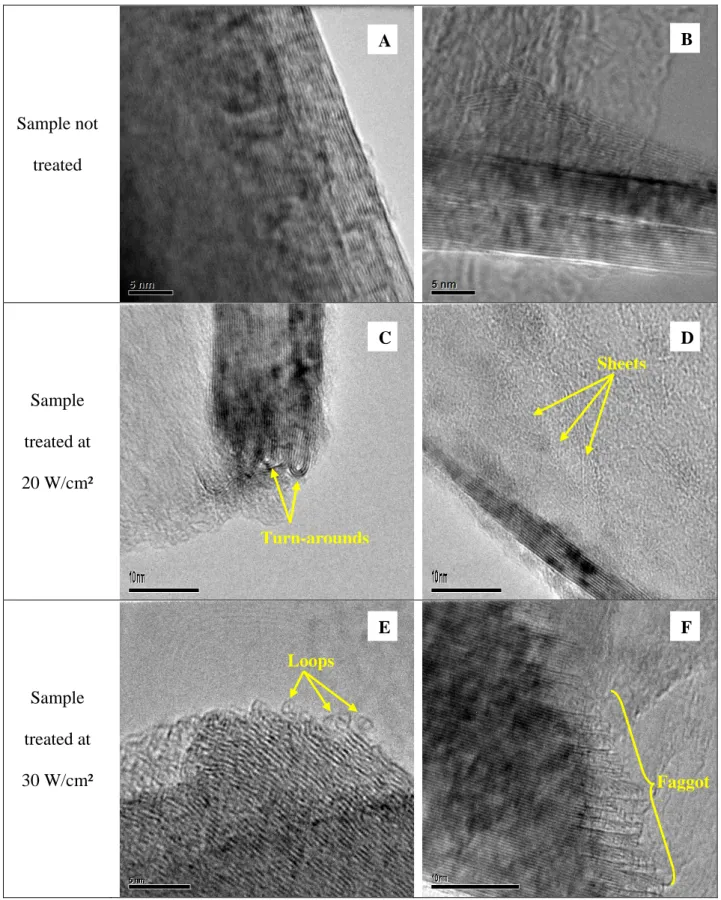
0 10 20 30 40 50 60 70 80 0 1 2 3 4 5 6 7 8 9 Energy density (105 J.g-1) Par ticule size x 16 , x 50 et x84 (µm) 10 W/cm² 20 W/cm² 30 W/cm² x16 x50 x84Figure 3: HRTEM photographs showing the graphite crystallites before and after
ultrasound treatment (with probe A)
Sample not
treated
Sample
treated at
20 W/cm²
Sample
treated at
30 W/cm²
A
B
C
D
E
F
Turn-arounds
Sheets
Loops
Faggot
s
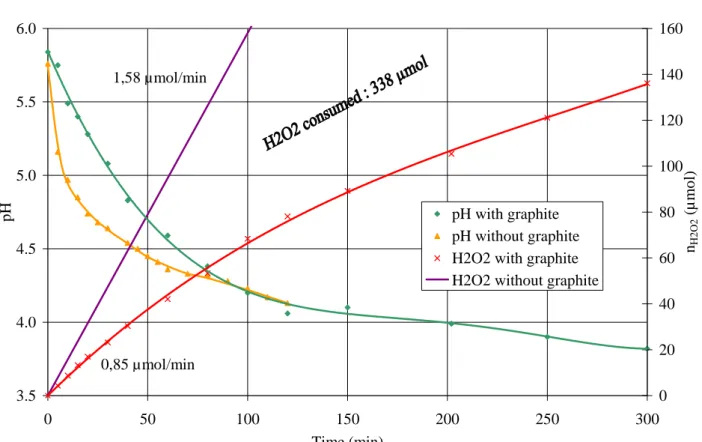
Figure 4: pH and H
2O
2curves during graphite sonolysis (powder A, probe A, m = 1 g,
V = 1 L, T = 20 °C, Argon satured, I = 20 W/cm²)
3.5 4.0 4.5 5.0 5.5 6.0 0 50 100 150 200 250 300 Time (min) pH 0 20 40 60 80 100 120 140 160 nH2 O 2 (µ mo l) pH with graphite pH without graphite H2O2 with graphite H2O2 without graphite0,85 µmol/min 1,58 µmol/min
Figure 5: Mass spectrum in the range [68-102] in APCI+ Fourier Transform mode
eau sonifiee HR #10 RT:0.09 AV:1 NL:3.41E6
T:FTMS + p APCI corona Full ms [50.00-214.00]
70 75 80 85 90 95 100 m/z 0 5 10 15 20 25 30 35 40 45 50 55 60 65 70 75 80 85 90 95 100 Relat iv e A b und a nc e 95.04935 C6H7O 77.03879 C6H5 75.02630 C6H3 81.07011 C6H9 96.05269 C H8O3N2 73.04704 C H5N4 78.04214 C H6O2N2 93.03688 C6H5O 91.05448 C7H7 99.08067 C6H11O 69.07009 C5H9 83.08575 C6H11 87.04430 C4H7O2 72.08102 C4H10N C3H9Si 79.05447 C6H7

![Figure 5: Mass spectrum in the range [68-102] in APCI+ Fourier Transform mode](https://thumb-eu.123doks.com/thumbv2/123doknet/7763335.255479/6.892.114.784.173.730/figure-mass-spectrum-range-apci-fourier-transform-mode.webp)

