Coupling biofiltration process and electrocoagulation using magnesium-based anode for the treatment of landfill leachate
Dia Oumar1, Drogui Patrick2, Buelna Gerardo3, Dubé Rino4 and Ihsen Ben Salah5
1 PhD student, Institut national de la recherche scientifique (INRS-Eau Terre et Environnement), Université du Quebec, 490 rue de la Couronne, Quebec, Qc, Canada, G1K 9A9, Phone : (418) 654-2530, Fax : (418) 654-2600, email : [email protected]
2 Professor, Institut national de la recherche scientifique (INRS-Eau Terre et Environnement), Université du Quebec, 490 rue de la Couronne, Quebec, Qc, Canada, G1K 9A9, Phone : (418) 654-3119, Fax : (418) 654-2600, email: [email protected]
3 Project Manager, PhD., Ing., Centre de Recherche Industrielle du Québec (CRIQ), 333 rue Franquet, Québec, QC, Canada, G1P 4C7, Phone : (418) 659-1550, Fax : (418) 652-2251, email: [email protected]
4 Project Manager, Ing., Centre de Recherche Industrielle du Québec (CRIQ), 333 rue Franquet, Québec, QC, Canada, G1P 4C7, Phone : (418) 659-1550, Fax : (418) 652-2251, email: [email protected]
5 Product Manager, MSc., M.Env, E2Metrix Inc, 3905 Rue Lesage, Sherbrooke, QC, Canada, J1L 2Z9, Phone : (819) 437-5737, Fax : (720) 294-1156, email: [email protected]
* Corresponding author
List of acronyms: BF: Biofiltration
BOD: Biochemical Oxygen Demand COD: Chemical Oxygen Demand EC: Electrocoagulation
LL: Landfill Leachate min: Minutes
Abstract
In this research paper, a combination of biofiltration (BF) and electrocoagulation (EC) processes was used for the treatment of sanitary landfill leachate. Landfill leachate is often characterized by the presence of refractory organic compounds (BOD/COD < 0.13). BF process was used as secondary treatment to remove effectively ammonia nitrogen (N-NH4 removal of 94%), BOD (94% removed), turbidity (95% removed) and phosphorus (more than 98% removed). Subsequently, EC process using magnesium-based anode was used as tertiary treatment. The best performances of COD and color removal from landfill leachate were obtained by applying a current density of 10 mA/cm2 through 30 min of treatment. The COD removal reached 53%, whereas 85% of color removal was recorded. It has been proved that the alkalinity had a negative effect on COD removal during EC treatment. COD removal efficiencies of 52%, 41% and 27% were recorded in the presence of 1.0, 2.0 and 3.0 g/L of sodium bicarbonate (NaHCO3), respectively. Hydroxide ions produced at the cathode electrode reacted with the bicarbonate ions to form carbonates. The presence of bicarbonates in solution hampered the increase in pH, so that the precipitation of magnesium hydroxides could not take place to effectively remove organic pollutants.
Keywords
Landfill leachate; biofiltration; electrocoagulation; magnesium electrode; ammonia nitrogen; refractory COD.
1
Introduction
Landfilling is one of the most common ways to manage municipal solid wastes. However, this technic can be related with some environmental issues if the landfill is not monitored properly. For example, percolation of rainwater into the landfill leads to the production of an effluent polluted with organic, inorganic and microbial materials called landfill leachate that has the potential threat for both groundwater, and surface water (Lema et al., 1988).
Landfill leachate characteristics can be defined by several parameters: operating modes (degree of compaction, height waste etc.), nature of waste, local climate, geological features of the site, age of landfill etc. Among these factors, age of landfill have a major importance on landfill leachate composition. Accordingly, landfill leachate could be divided into three types : "young", "intermediary" and "mature" or stabilized landfill leachate (Renou et al., 2008). The young landfill leachates having an age up to 5 years, are characterized by high concentration of biodegradable organic compounds (Harmsen, 1983). By comparison, mature landfill leachate having more than ten years are characterized by refractory organic compounds (Ehrig, 1989). Biological processes are often used to treat young landfill leachate due to their biodegradability. According to the literature, many biological processes such as aerated lagoon (Robinson and Grantham, 1988), activated sludge (Kettunen et al., 1996), attached biomass (Li et al., 2010; Martienssen et al., 1995) membrane bioreactor (MBR) (Ahmed and Lan, 2012) sequencing batch reactor (SBR) (Dollerer and Wilderer, 1996) and others had been applied for landfill leachate treatment. Among biological processes, biofiltration technology has many advantages such as low footprint and good resistance to the variation of volumetric loading (Galvez et al., 2009; Pujol et al., 1994; Xie et al., 2010). The materials used as media could be categorized as
inorganic (plastic, pozzolan, glass bead, expanded clay etc.) and organic (peat, wood chips, compost, activated carbon etc.). Peat based biofilters have been founding increased use, as they showed high efficiency for biodegradable organic carbon and nitrogen removal (Champagne and Khalekuzzaman, 2014; Heavey, 2003; Kangsepp and Mathiasson, 2009; Kõiv et al., 2009), due to its a high specific surface for microorganisms (Buelna et al., 2008; Couillard, 1994). In addition, the presence of some chemicals groups on its surface (alcohol, aldehydes, ketones, acids and ethers) could be involved in the depollution process by interacting with pollutants throughout adsorption, complexation, chelation and ions exchanges reactions (Couillard, 1994). Although the effectiveness of biological systems is well known for biodegradable landfill leachate, biological methods do not generally provide the necessary quality of treatment for wastes containing refractory organic pollutants (Galvez et al., 2009). For example, humic substances contained in landfill leachate are difficult to oxidize biologically.
To tackle this issue, combined treatment methods have been finding increased use, biological treatment followed by physical-chemical treatment. Physical chemical process is often employed as tertiary treatment after biological treatment (Galvez et al., 2009). Different types of physicochemical, electrochemical, membrane filtration and advanced oxidative processes have been integrated with biological processes. Among these technologies, electrocoagulation process is a promising technique that can be coupled with biological process in order to improve the effectiveness of landfill leachate treatment. The principle of EC is to generate, in-situ, coagulants using an electrical potential difference. These coagulants can agglomerate colloidal suspensions and form insoluble metal hydroxides on which organic matter could be adsorbed.
of different types of effluents such as bleaching effluent (Antony and Natesan, 2012), grey water (Bani-Melhem and Smith, 2012), industrial effluents (Moises et al., 2010), municipal wastewater (Stafford et al., 2014) and synthetic wastewater (Yu et al., 2006). In these studies, satisfactory results were obtained in terms of organic matters, suspended solids and phosphorus removal. The objective of this research project was to study the feasibility of coupling a biological process (biofiltration) with an electrochemical process (electrocoagulation) for the treatment of "mature" landfill leachate. Hence, the biological system was placed before the electrochemical process. The efficiency of biofiltration in terms of nitrogen, organic matters and turbidity removal was investigated, whereas for the electrochemical treatment, the influence of current density, treatment time and alkalinity on residual COD removal was considered.
2
Materials and methods
2.1 Landfill leachate
Landfill leachates used throughout this study were taken from a municipal landfill site of Saint-Rosaire’s City, Québec, Canada. This landfill area is 44 ha having a landfilling capacity of 65,000 tons/year. The annual flow rate of leachate production is around 100 m3/j. Landfill leachates were stored in three open sky tanks, each one having 2750 m3 of capacity. The sampling was taken from the storage tanks with the average frequency of three weeks. Samples were collected in polypropylene buckets and kept at 4°C before use.
2.2 Biofiltration experimental unit
A PVC column was used as biofilter unit with a dimension of 2 m (height) x 0.2 m (inside diameter). The biofilter system used indigenous microflora bacteria fixed on an organic support
mainly comprised of peat and wood shavings. The filter media was arranged vertically as follows (from the top to the bottom) : 10 cm of wood ships, 30 cm of a mixture of 80 %(v/v) wood + 20%(v/v) peat + 5%(v/v) of calcite, 30 cm of wood ships, 90 cm of 80 % (v/v) wood ships + 20% (v/v) peat + 5% (v/v) calcite. The calcite was added in the filter media in order to buffer the pH and to provide a mineral carbon source for autotrophic microorganisms. The landfill leachate was filtered by percolation. The biofilter acclimation was performed by gradually increasing the hydraulic loading rate inside the biofilter unit. Once the acclimation was completed, the inlet flow rate was set at around 5.3 L/d, corresponding to a hydraulic loading rate of 0.17 m3/m2/day. The column was aerated by injecting compressed air from the bottom with a flow rate of 5 l/min. The air was moistened through a hermetic water balloon before being injected in the column. It is worth noting that the pilot worked at room temperature (22°C). The biofilter clogging was monitored by measuring every four days the output flow rate of the biofilter and checking regularly if there was appearance of stagnant liquid on the surface of the biofilter unit.
2.3 Electrochemical cell
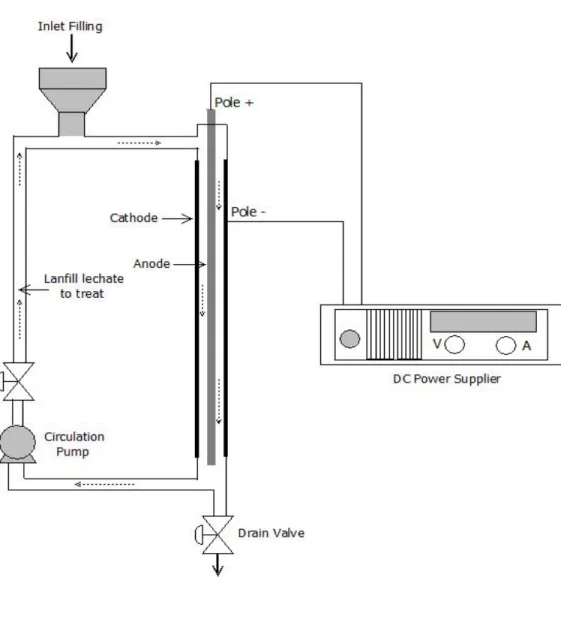
A cylindrical electrolysis cell, having 1.5 L of capacity was used. This electrolytic unit was comprised of two concentrical electrodes (Fig. SM-1). The cylindrical anode electrode (79.8 cm length x 1.9 cm diameter) was made of alloy based magnesium having a working surface area of 476 cm2. The hollow cylindrical cathode electrode (72 cm length and 5 cm inner diameter) was made of stainless steel (SS) and having a surface area of 1130 cm2. The assays were carried out in a closed loop, depicted schematically in Fig. SM-1. A conical reservoir (to introduce
the top of the cell. The electrochemical cell was designed and provided by the company E2Mextrix Inc, Sherbrooke, Québec, Canada. The electrochemical cell was operated under galvanostatic conditions. Current intensities were imposed by means of a DC power source, Xantrex XFR40-70 (Aca Tmetrix, Mississauga, ON, Canada) with a maximum current rating of 70 A at an open circuit potential of 40 V. Due to high conductivity of landfill leachate, no electrolyte salt was added during the EC process. 30 ml aliquot was taken from the reactor at different treatment time and then naturally settled down for at least one hour, and finally supernatant was collected for the analysis.
2.4 Analytical details
pH was measured by a pH meter (Accumet Excel XL25 - pH / mV / Temp / Ion Meter, Fisher Scientific Co) with a Cole-Palmer double junction electrode (Ag/AgCl reference). Turbidity was determined by a turbidimeter (2100N Laboratory Turbidimeter, EPA, 115 Vac, HACH). Chemical oxygen demand (COD) was measured by the colorimetric method (closed Reflux) certified by the APHA (APHA, 1998). Ammonia (N-NH4) and ortho-phosphate (P-PO4) concentrations were simultaneously analyzed by QuikChem method 10-107-06-2-B and QuikChem method 10-115-01-1-B respectively using Lachat Instrument. Samples of COD, NH4 and PO4 were acidified under pH 2 before analysis. Measurement of BOD5 was carried out by an accredited laboratory (AGAT Laboratories, Quebec, Canada). BOD5 was analyzed according to electrometric method approved by the CEAQ (Centre d'expertise en analyse environnementale du Québec). BOD samples were frozen before being sent to the laboratory. The color was estimated by UV-visible spectrophotometry (Cary 50, Varian Canada Inc., Mississauga, ON, Canada) with the platinum-cobalt method approved by the CEAQ (CENTRE D’EXPERTISE EN ANALYSE ENVIRONNEMENTALE DU QUÉBEC). In this case, the color measured is the
true color which requires a filtration step to 0.45 μm or centrifugation at 15,000 g for 15 minutes. The alkalinity was measured by titration method using a diluted mineral acid (H2SO4, 0.02 N). The endpoint titration was detected using coloured indicators: phenolphthalein and methyl orange (Doré, 1989). In the presence of phenolphthalein (and at a pH around 8.3 – 10), hydroxide ions and the half of the carbonate ions were measured. This operation allowed determining the phenolphthalein alkalinity (p-alk). In the presence of methyl orange (at a pH around 3.2 – 4.4), the sum of hydroxides, carbonates and bicarbonates ions were measured. This operation allowed determining the methyl orange alkalinity (m-alk) or total alkalinity. The difference between methyl orange alkalinity (m-alk) and phenolphthalein alkalinity (p-alk) allowed determining the concentration of bicarbonate (HCO3-). Then, the concentration of carbonate (CO32-) was determined using the following equation: CO32- + H3O+ HCO3- + H2O.
3
Results and discussion
3.1 Characteristics of raw landfill leachate
Table 1 shows the physicochemical characteristics of the raw leachate. The low biodegradability ratio (BOD/COD = 0.09) indicated the presence of high proportion of refractory organic matter in the landfill leachate. These organic compounds are mainly comprised of humic substances (humic acids and fulvic acids). In addition, the slightly basic pH was mainly due to the absence of volatile fatty acids indicating the end of the acidogenic transformation and the establishment of methanogenic phase (Kjeldsen et al., 2002). The mature characteristic of the leachate can also justify the low metals and phosphate concentrations. The relatively basic pH (7.4 - 8.8) and high alkalinity (2418 - 3198 mg CaCO3/L) values recorded in the landfill leachate contributed to metals and phosphate precipitation (Bozkurt et al., 1999; Kjeldsen et al., 2002).
3.2 Treatment of landfill leachate using biofiltration (BF) process
3.2.1 Ammonia (NH4) removal using BF system
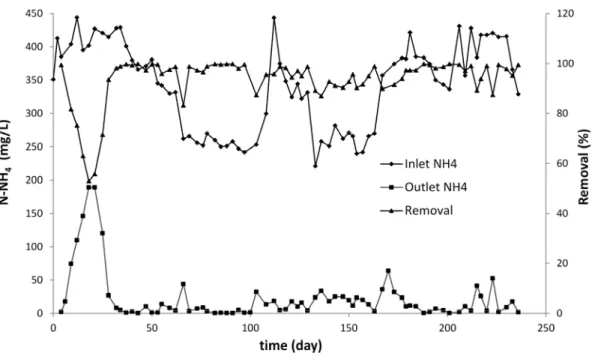
Fig. 1 shows the changes in ammonia concentrations in the influent and effluent during the treatment using biofiltration process. At the beginning of the acclimation period, low ammonia concentrations were recorded in the effluent due to physical adsorption of ammonia onto the biofilter media. However, the concentration of ammonia increased gradually in the effluent after the saturation of the active sites of the biofilter media. The stripping of NH3 (g) can also contributed to nitrogen removal during the start-up period (Garzón-Zúñiga et al., 2005). Meanwhile, the biomass was gradually developed and acclimatized in the biofilter unit. The effect of this acclimation can be seen by measuring the residual concentrations of ammonium-nitrogen (close to zero) at the outlet of the biofilter system. A period of 30 days was required to
sufficiently develop and acclimatized nitrifying bacteria. By examining the Fig. 1, it was deduced that variations of the NH4 concentration in the influent have a negative influence on the NH4 concentration at the outlet. This was specially observed during a period of 74 days (i.e., from 103rd day to 177th day of treatment period) with significant fluctuations of ammonia loading rate at the inlet of the bio-filter system. Since the amount of biodegradable organic carbon in the reactor was limited, the autotrophic nitrification and NH3 stripping were the principal mechanisms of nitrogen removal. Therefore, the amount of autotrophic biomass in the reactor was proportional to the ammonia loading rate applied in the biofilter system. Hence, a sudden increase in NH4 concentration in the influent could have a negative impact on nitrogen removal because the autotrophic biomass will face a nitrogen load superior to its nitrification capacity. This leads to an increase in NH4 concentration at the outlet of the biofilter unit. Despite the loading rate changes observed during this period, the biofilter showed a good performance in terms of ammonia removal with an average removal of 94% (recorded from day 103rd to day 177th). The average value of ammonia concentration after BF was 13 mg/L of N-NH4. This is close to the standard value (10 mg/L of N-NH4) sets by the Québec Province regulation (MDDELCC, 2009). The significant fluctuations of NH4 concentration in the influent were mainly due to seasonal variations in the landfill leachate characteristics. Nitrate measurement at day 126th revealed a nitrate concentration of 240 mg N-NO3/L at the outlet. This corresponding to 81% removal of ammonia (NH4 inlet = 312 mg N-NH4/l and NH4 outlet = 16 mg N-NH4/L). In fact, nitrification was the dominant mechanism of nitrogen removal in the biofilter. The amount of nitrogen stripped out of the reactor could be calculated using the following equation (Anthonisen et al., 1976) :
Where Kb and Kw are ionization constants of ammonia equilibrium and water respectively. The ratio Kb/Kw can be expressed as a function of the temperature:
According to theses equations and considering an ammonia concentration of 312 mg/L, a temperature of 22◦C and a pH of 8.65, the amount of N-NH3 removed by stripping will be 53 mg/L corresponding to 18% of total NH4 removal. Biological nitrification and NH3 stripping represent almost 100% of ammonia removal in the biofilter pilot. However, other mechanisms such as assimilation, denitrification, adsorption, and chemodenitrification could also take place (Garzón-Zúñiga et al., 2005).
3.2.2 COD removal using BF system
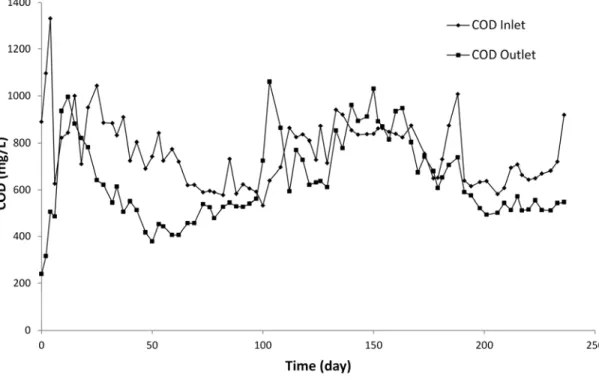
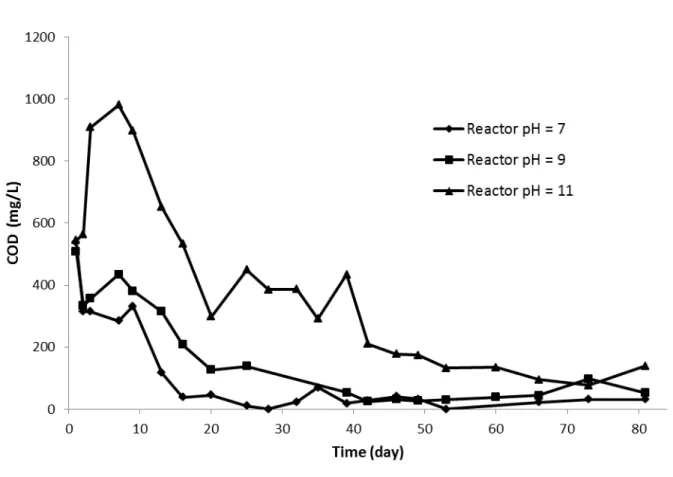
Fig. 2 shows the changes in COD concentrations of landfill leachate before and after treatment using BF system. Low COD concentrations were recorded in the effluent during the first days of treatment. However, the residual COD concentration recorded at the outlet of the BF system gradually increased after the saturation of the adsorption sites in the biofilter medium. Few days after the start-up period (day 12th), high COD concentrations were obtained at the outlet of the biofilter unit. These relative high COD concentrations were due to the leaching of humic substances from peat media. The biofilter was then stable from day 21th to day 66th where the COD removal was about 35%. After this period, low COD efficiency was recorded (around 5%) with a dark brownish color of the effluent (day 73th to 194th). Surprisingly in some samples (i.e., day 97th to 108th and day 140th to 163rd), the COD concentrations in the effluent were higher than
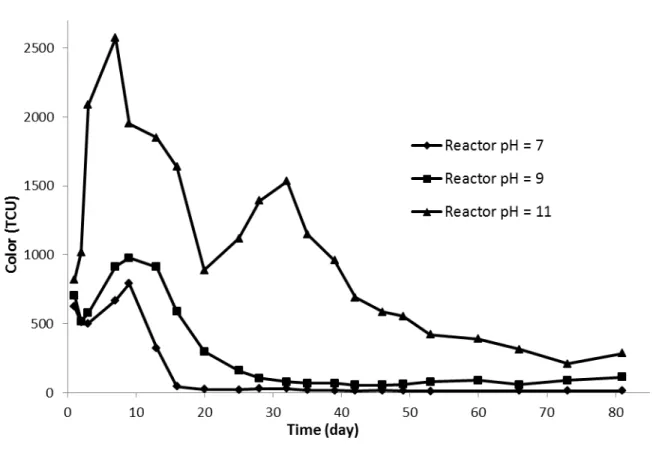
those measured in the influent. The increase in COD in the treated effluent (higher than the values recorded in the influent) was mainly attributed to the leaching of humic substances from peat media. As explained in the "Material and Method" section. The bio-filter system used indigenous microflora bacteria fixed on an organic support mainly comprised of peat and wood shavings. Given the refractory nature of these compounds (humic substances), they were not degraded by the microorganisms. It is worth noting that the average value of pH measured in the influent was 8.2 ± 0.23 (raw landfill leachate). By comparison, after bio-filtration treatment the average value was 8.7 ± 0.24. During the tests, the pH values measured at the outlet of the bio-filter system were higher than those measured at the inlet. Sometime, the pH values measured at the outlet were very close to pH 9.0 (for instance for the days 133 and 143), especially when the COD recorded at the outlet were relatively high. This increase in pH contributed to humic substances leaching from wood chips and peat, so that the coloration of the effluent increased leading to the increase in COD. As already mentioned above (section 2.2), the filter media contained calcite. The calcite was added in the filter media in order to buffer the pH and to provide a mineral carbon source for autotrophic microorganisms. Inside the bio-filter system, the pH was more basic so that it can contribute to release humic substances from the organic support (peat and wood shavings). Additional experiments were conducted in order to investigate the effect of pH on humic substances release in solution. Results showed that an increase of pH to around 9 induced more humic substances in solution so that color and COD increased (see Fig. SM-2 and Fig. SM-3. The relatively low COD removal obtained in the present study was consistent with those recorded by other authors using peat biofilters for the treatment of landfill leachate. For instance, Kõiv et al. (2009) reported that less than 10% of COD removal was
obtained while applying a biofiltration process for the treatment of a mature landfill leachate through a peat based media.
3.2.3 BOD5, PO4 and turbidity removal using BF system
BOD5 concentrations in the influent were low (around 70 mg O2/L). A large portion of the BOD5 was eliminated after biofiltration. The average BOD5 value measured at the outlet of the biofilter unit was 12 mg O2/L. After acclimation period, the residual BOD5 concentrations were below the detection limit (4 mg O2/L). This represents a BOD5 removal higher than 94%. After BF, the effluent met the discharge standards defined by Québec legislation in terms of BOD5 (65 mg O2/L).
The phosphorus concentration measured at the inlet of the biofilter unit was relatively low (around 2.3 mg P-PO4/L). These low initial phosphate concentrations were linked to the nature of landfill leachate (mature leachate). After biological treatment, residual P-PO4 concentrations were below the detection limit (0.2 mg/L of P-PO4). However, the phosphorus deficiency did not seem to have a significant negative impact on the autotrophic biomass activity. According to Vanhooren (2002), in the trickling filter, phosphate uptake is limited because this latter can be recycled inside the biofilm.
The porous structure of the biofilter media has allowed getting good removal of the influent turbidity. The turbidity in the inlet was estimated to around 107 NTU. An average of turbidity removal of 95% was obtained with a residual turbidity value around 5 NTU.
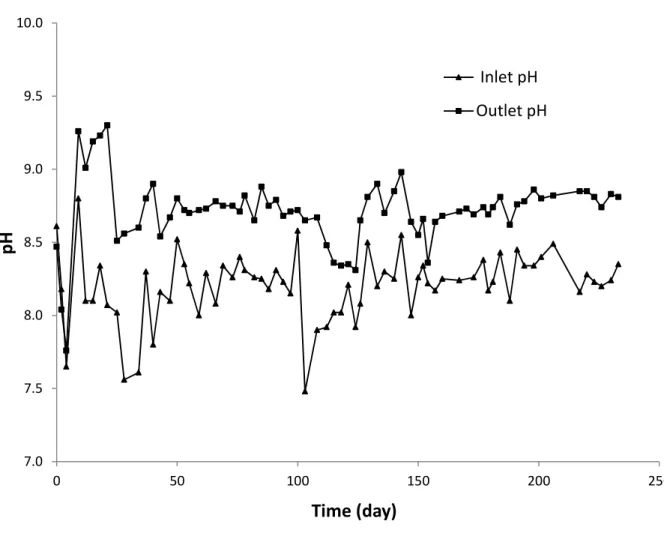
Fig. SM-4 shows the changes in pH before and after bio-filtration treatment. Against all odds, an increase in pH value after biofiltration was observed. Considering the acidifying nature of the
peat and the acidification related to the nitrifying biomass activity, a decrease in pH was expected after biological treatment. In contrast, the pH passed from 8.2 (in the influent) to 8.7 after biofiltration. The degassing of dissolved CO2 via the aeration in the biofilter unit could justify the increase of the pH. The reaction of the dissolution of carbon dioxide in water can be expressed as follow:
By the aeration, the dissolved CO2 will be stripped and the reaction 3 moves to the left side leading to the consumption of hydronium ions and an increase in pH. A similar phenomenon of increase in pH was observed by Champagne and Khalekuzzaman (2014) after the aeration of landfill leachate.
3.3 Electrocoagulation (EC) of landfill leachate obtained from the biofiltration process After biological treatment, the pre-treated landfill leachate was subjected to electrocoagulation treatment. During the EC process, the effects of treatment time, current density and alkalinity were investigated on COD removal efficiency. pH was also monitored before and after electrochemical treatment.
3.3.1 The current density and treatment time effect
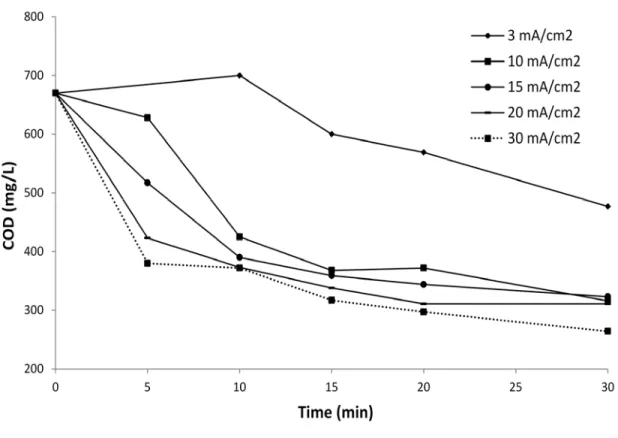
Different current densities (3 mA to 30 mA/cm2) and treatment time (5, 10, 15, 20 and 30 min) were investigated. The results obtained in terms of the residual COD removal are summarized in Fig. 3. For a given treatment time, an increase in COD removal was observed when the applied
of ionized metal (Faraday's law). As the current increased, more magnesium ions would be generated, which was beneficial for electrocoagulation and co-precipitation processes. Low COD removal (29%) was obtained after 30 minutes of EC treatment with low current density (3 mA/cm2). For higher current densities (10 to 30 mA/cm2), a rapid decrease of residual COD concentration was achieved during the first 10 min (69-73% of total COD removal) and after that, the residual COD decreased slowly until the end of the experience. The sharp decrease of COD during the first 10 min was likely due to the combined effects of cathodic reduction and destabilization of colloidal organic compounds. Indeed, a thin brownish deposit layer observed on the cathodic electrode surface, after EC, gave an indication of the cathodic reduction phenomenon. These results were consistent with those recorded by Asselin et al. (2008) while using EC process for the treatment of slaughterhouse wastewater. The slight COD decrease recorded after 10 min was mainly attributed to others mechanisms such as co-precipitation, complexation and adsorption of organic matters onto the metallic hydroxides surface. Base on the results discussed above, current density of 10 mA/cm2 and 30 minutes were selected as the best conditions for the EC treatment in terms of energy consumption and effectiveness. Under these conditions, relatively high color (85%) and COD (53%) were removed. These conditions were applied in the next step of this study.
3.3.2 pH changes during electrochemical treatment
Fig. SM-5 shows the changes in pH of the landfill leachate during EC treatment when a current density of 10 mA/cm2 was imposed. The pH increased rapidly over the first 5 min of the treatment (passing from 8.4 to 10) and then remained quite stable until the end of experiment. This increase in pH can be explained by the combination of two aspects: (i) production of hydroxide ions at the cathode through the electrochemical reduction of water and; (ii) high pH
required for the precipitation of magnesium hydroxide Mg(OH)2. The pH required for magnesium hydroxide precipitation is around 9.5 to 11 dependently on magnesium ion concentrations in solution. In this case, the precipitation of magnesium hydroxide was observed around pH 10. It is worth noting that the presence of magnesium in solution was due to anodic dissolution during electrolysis. Magnesium ions could not precipitate if a pH around 10 was not reached in solution. A period of 5 min was required to increase the pH around 10 and to start the precipitation of magnesium so that the pH remained quite stable until the end of experiment.
3.3.3 The alkalinity effect
Landfill leachate can contain high concentrations of alkalinity. In order to investigate the influence of alkalinity on the EC efficiency, the bio-filtered landfill leachate was spiked with different concentrations of sodium bicarbonate (NaHCO3) (1, 2 and 3 g/L) to artificially increase the alkalinity. Residual concentrations of COD, carbonate (CO32-) and bicarbonate (HCO3-) were measured. A current density of 10 mA/cm2 was imposed.
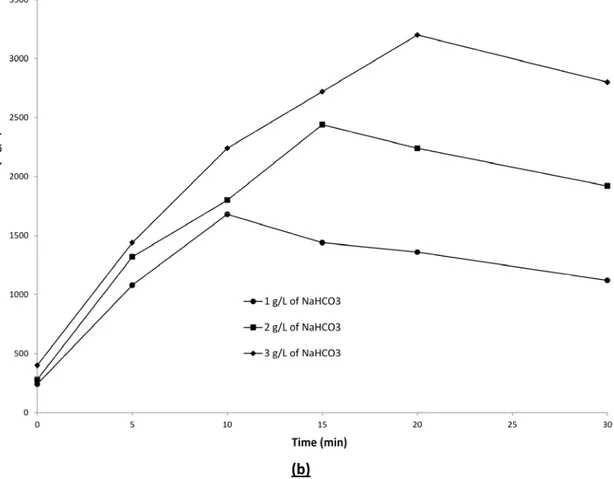
The changes in HCO3- and CO32- concentrations during EC treatment are presented in Fig. 4a and 4b respectively. HCO3- concentrations decreased and a complete disappearance was recorded over 30 min of electrolysis irrespective of the initial HCO3- concentration imposed. Indeed, during electrolysis, hydroxide ions generated at the cathode react with HCO3- according to Equation 6. By comparison, there was an increase in CO32- concentration during the 10-20 first minutes of electrolysis followed by a gradual decrease of CO32- concentration.
For instance, in the case of 1.0 g/L of NaHCO3, it took 10 minutes of electrolysis to completely transform HCO3- into CO32-, whereas 15 and 20 minutes of electrolysis were required to completely transform HCO3- into CO32- when the initial concentrations of NaHCO3 were 2.0 g/L and 3.0 g/L, respectively. Since the current density was the same in all the three cases, the higher the concentration of HCO3- in solution, the longer the electrolysis time was to transform HCO3 -into CO32.
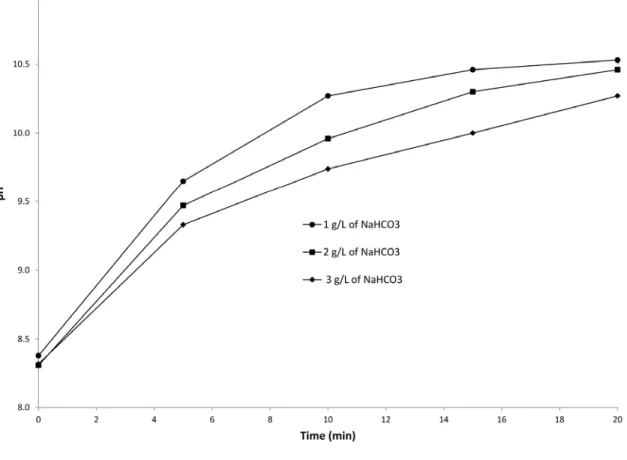
The acid-base couple HCO3-/CO32- plays a buffer role which resists to the increase of pH induced by the electrochemical reduction of water. When the initial concentration of NaHCO3 increased in solution, the pH increased less rapidly (Fig. 5). Fig. SM-6 shows the relationship between NaHCO3 concentration and the treatment time required for metal precipitation during electrolysis. For instance, the metal hydroxides were formed within 5 minutes of treatment time in the absence of NaHCO3. However, in the presence of 1, 2 and 3 g/L of NaHCO3, the times required for magnesium hydroxide precipitation were 15, 20 and 30 minutes, respectively. Alkalinity had a negative effect on the efficiency of EC treatment using a magnesium-based anode since it delayed the magnesium hydroxide formation and consequently increased the treatment time and energy consumption. Likewise, the precipitation of CO32- ions with Ca2+ and Mg2+ could form respectively CaCO3 and MgCO3 leading to a reduction of the active surface of electrodes. This phenomenon was observed by Hug and Udert (2013), while studying struvite precipitation using magnesium-based anodes.
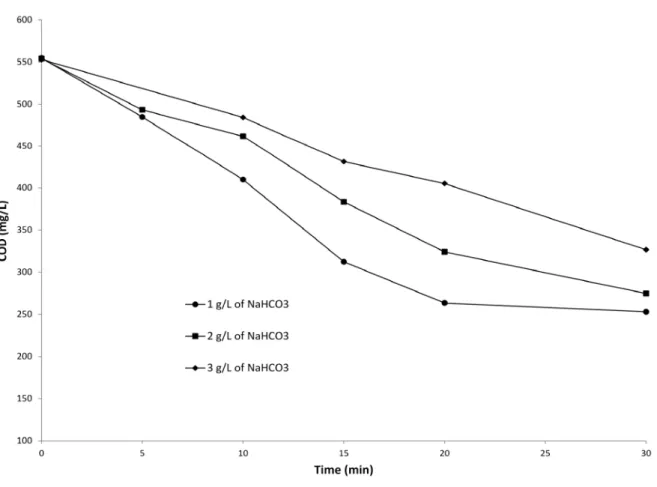
The changes in COD during EC treatment (Fig. 6) shows that as the initial concentration of NaHCO3 increased in the landfill leachate the depurative efficiency decreased. For instance, residual COD concentrations of 263, 323 and 405 mg/L were recorded after 20 min when 1, 2 and 3 g/L of NaHCO3 were respectively added. This was related to the fact that more metal
residues were formed with low sodium bicarbonate concentrations. The presence of metallic residues in solution promotes the removal of organic compounds through the processes of coagulation and co-precipitation. Nevertheless, COD removal was observed in the samples where there was no metallic residues formation. As discussed in section 3.3.1, this COD removal was likely due to cathodic reduction of organic compounds. However, no significant color removal was observed before the formation of metal hydroxides (Fig SM-4). From this experience, we proved that alkalinity had a negative effect on EC process using magnesium based-electrode. However, the alkalinity of the effluent, after BF, was not very high (around 500 mg of CaCO3/L) to hamper the EC process. This low alkalinity is related to the fact that autotrophic nitrifying bacteria used the inorganic carbon as a carbon source. Nevertheless, the presence of alkalinity could be a problem when EC process is used as primary treatment (before biofiltration) or when nitrification do not work properly when EC is used as secondary treatment (after bio-filtration).
4
Conclusion
This study proved the feasibility of combined biofiltration and electrocoagulation processes for the effective treatment of mature sanitary landfill leachate. The biofiltration process showed satisfactory result in terms of ammonia, BOD5, turbidity and phosphorus removal with removal percentages of 94%, 94%, 95% and > 98% respectively. However, the COD removal was low (≈ 13% on average). Electrocoagulation of bio-treated landfill leaching using magnesium-based anode had enabled to reduce around 53% of the residual COD and 85% of the true color by applying a current density of 10 mA/cm2 and a treatment time of 30 minutes. A significant
on the effectiveness of EC treatment. With a current density of 10 mA/cm2 and 20 minutes of treatment time, the COD removals were 52%, 41% and 27% in the presence of 1.0, 2.0 and 3 g/L of NaHCO3. The presence of bicarbonates in the solution hampered the increase in pH, so that the precipitation of magnesium hydroxides could not took place to effectively remove the organic pollutants.
Acknowledgements
This research project was conducted in collaboration with the research institutes INRS (Institut National de la Recherche Scientifique) and CRIQ (Centre de Recherche Industrielle du Québec) and the companies E2metrix and Gesterra. It also received the financial support of CRIBIQ (Consortium de Recherche et Innovations en Bioprocédés Industriels au Québec) and MITACS (number 122677).
References
Ahmed, F.N., Lan, C.Q., 2012. Treatment of landfill leachate using membrane bioreactors: a review. Desalination 287, 41-54.
Anthonisen, A., Loehr, R., Prakasam, T., Srinath, E., 1976. Inhibition of nitrification by ammonia and nitrous acid. J Water Pollut Control Fed 48, 835-852.
Antony, S.P., Natesan, B., 2012. Optimization of Integrated Electro-Bio Process for Bleaching Effluent Treatment. Ind. Eng. Chem. Res. 51, 8211-8221.
APHA, 1998. Standard Methods for the Examination of Water and Wastewater 20ed. APHA American Public Health Association. Washington DC, U.S.A.
Bani-Melhem, K., Smith, E., 2012. Grey water treatment by a continuous process of an electrocoagulation unit and a submerged membrane bioreactor system. Chem. Eng. J. 198-199, 201-210.
Bozkurt, S., Moreno, L., Neretnieks, I., 1999. Long-term fate of organics in waste deposits and its effect on metal release. Sci. Total Environ. 228, 135-152.
Buelna, G., Dubé, R., Turgeon, N., 2008. Pig manure treatment by organic bed biofiltration. Desalination 231, 297-304.
Centre d'expertise en analyse environnementale du Québec, Détermination de la demande biochimique en oxygène: méthode électrométrique, MA. 315 – DBO 1.1, Rév. 3, Ministère du Développement durable, de l’Environnement et de la Lutte contre les changements climatiques du Québec, 2014, 11 p.
CENTRE D’EXPERTISE EN ANALYSE ENVIRONNEMENTALE DU QUÉBEC, Détermination de la couleur vraie dans l’eau : méthode par spectrophotométrie UV-visible avec le platino-cobalt, MA. 103 – Col. 2.0, Rév. 2, Ministère du Développement durable, de l’Environnement, de la Faune et des Parcs du Québec, 2012, 8 p. .
Champagne, P., Khalekuzzaman, M., 2014. A Semi-Passive Peat Biofilter System for the Treatment of Landfill Leachate. Journal of Water Sustainability 4, 63-76.
Couillard, D., 1994. The use of peat in wastewater treatment. Water Res. 28, 1261-1274.
Dollerer, J., Wilderer, P., 1996. Biological treatment of leachates from hazardous waste landfills using SBBR technology. Water Sci. Technol. 34, 437-444.
Doré, M., 1989. Chemistry of Oxidants and Waters TreatmentLavoisier. Technique et documentation, Paris.
Ehrig, H.-J., 1989. Water and element balances of landfills, in: Baccini, P. (Ed.), The landfill. Springer Berlin Heidelberg, Berlin, Germany, pp. 83-115.
Galvez, A., Giusti, L., Zamorano, M., Ramos-Ridao, A.F., 2009. Stability and efficiency of biofilms for landfill leachate treatment. Bioresour. Technol. 100, 4895-4898.
Garzón-Zúñiga, M., Lessard, P., Aubry, G., Buelna, G., 2005. Nitrogen elimination mechanisms in an organic media aerated biofilter treating pig manure. Environ. Technol. 26, 361-372. Harmsen, J., 1983. Identification of organic compounds in leachate from a waste tip. Water Res.
17, 699-705.
Heavey, M., 2003. Low-cost treatment of landfill leachate using peat. Waste Manage. 23, 447-454.
Hug, A., Udert, K.M., 2013. Struvite precipitation from urine with electrochemical magnesium dosage. Water Res. 47, 289-299.
Kangsepp, P., Mathiasson, L., 2009. Performance of a full-scale biofilter with peat and ash as a medium for treating industrial landfill leachate: a 3-year study of pollutant removal efficiency. Waste Manag Res 27, 147-158.
Kettunen, R., Hoilijoki, T., Rintala, J., 1996. Anaerobic and sequential anaerobic-aerobic
treatments of municipal landfill leachate at low temperatures. Bioresour. Technol. 58, 31-40.
Kjeldsen, P., Barlaz, M.A., Rooker, A.P., Baun, A., Ledin, A., Christensen, T.H., 2002. Present and Long-Term Composition of MSW Landfill Leachate: A Review. Crit. Rev. Environ. Sci. Technol. 32, 297-336.
Kõiv, M., Vohla, C., Mõtlep, R., Liira, M., Kirsimäe, K., Mander, Ü., 2009. The performance of peat-filled subsurface flow filters treating landfill leachate and municipal wastewater. Ecol. Eng. 35, 204-212.
Lema, J., Mendez, R., Blazquez, R., 1988. Characteristics of landfill leachates and alternatives for their treatment: a review. Water, Air, Soil Pollut. 40, 223-250.
Li, H., Gu, Y., Zhao, Y., Wen, Z., 2010. Leachate treatment using a demonstration aged refuse biofilter. J. Environ. Sci. 22, 1116-1122.
Martienssen, M., Schulze, R., Simon, J., 1995. Capacities and limits of three different
technologies for the biological treatment of leachate from solid waste landfill sites. Acta Biotechnol. 15, 269-276.
MDDELCC, 2009. Règlement sur l’enfouissement et l’incinération des matières résiduelles (REIMR), art. 53», Gazette officielle du Québec.
Moises, T.P., Patricia, B.H., Barrera-Diaz, C.E., Gabriela, R.M., Natividad-Rangel, R., 2010. Treatment of industrial effluents by a continuous system: electrocoagulation--activated sludge. Bioresour. Technol. 101, 7761-7766.
Pujol, R., Hamon, M., Kandel, X., Lemmel, H., 1994. Biofilters: flexible, reliable biological reactors. Water Sci. Technol. 29, 33-38.
Renou, S., Givaudan, J.G., Poulain, S., Dirassouyan, F., Moulin, P., 2008. Landfill leachate treatment: Review and opportunity. J. Hazard. Mater. 150, 468-493.
Robinson, H.D., Grantham, G., 1988. The treatment of landfill leachates in on-site aerated lagoon plants: experience in Britain and Ireland. Water Res. 22, 733-747.
Stafford, B., Dotro, G., Vale, P., Jefferson, B., Jarvis, P., 2014. Removal of phosphorus from trickling filter effluent by electrocoagulation. Environ. Technol. 35, 3139-3146.
Vanhooren, H., 2002. Modelling for optimisation of biofilm wastewater treatment processes: a complexity compromise. PhD Thesis : UNIVERSITEIT GENT.
Xie, B., Lv, B.Y., Hu, C., Liang, S.B., Tang, Y., Lu, J., 2010. Landfill leachate pollutant removal performance of a novel biofilter packed with mixture medium. Bioresour. Technol. 101, 7754-7760.
Yu, M.J., Ku, Y.H., Kim, Y.S., Myung, G.N., 2006. Electrocoagulation combined with the use of an intermittently aerating bioreactor to enhance phosphorus removal. Environ. Technol. 27, 483-491.
Figures list:
Fig.1. NH4 concentration changes in the biofilter system (hydraulic load = 0.17 m3/m2/j, temperature = 22◦C, air flowrate = 5 L/min)
Fig.2. COD changes in the biofilter (hydraulic load = 0.17 m3/m2/j, temperature = 22◦C, air flowrate = 5 L/min)
Fig.3. Influence of current density and treatment time on COD removal (working volume = 1.5 L, initial pH = 8.4, conductivity = 5.72 mS/cm2, cathode = stainless steel)
Fig.4 Bicarbonate ions concentration (A) and carbonate ions concentration (B) during EC process: (Current density = 10 mA/cm2, working volume = 1.5 L, cathode = stainless steel)
Fig.5. pH changes during EC with different sodium bicarbonate concentrations: (Current density = 10 mA/cm2, working volume = 1.5 L, cathode = stainless steel)
Fig.6. DCO changes during electrochemical treatment when different initial bicarbonate concentrations (NaHCO3) were imposed: (Current density = 10 mA/cm2, working volume = 1.5 L, cathode = stainless steel)
Fig. 1. NH4 concentration changes in the biofilter system (hydraulic load = 0.17 m3/m2/j, temperature = 22◦C, air flowrate = 5 L/min)
Fig. 2 COD changes in the biofilter (hydraulic load = 0.17 m3/m2/j, temperature = 22◦C, air flowrate = 5 L/min)
Fig. 3. Influence of current density and treatment time on COD removal (working volume = 1.5 L, initial pH = 8.4, conductivity = 5.72 mS/cm2, cathode = stainless steel)
(a)
(b)
Fig. 4. Bicarbonate ions concentration (a) and carbonate ions concentration (b) during EC process: (Current density = 10 mA/cm2, working volume = 1.5 L, cathode = stainless steel)
Fig. 5. pH changes during EC with different sodium bicarbonate concentrations: (Current density = 10 mA/cm2, working volume = 1.5 L, cathode = stainless steel)
Fig. 6. DCO changes during electrochemical treatment when different initial bicarbonate concentrations (NaHCO3) were imposed: (Current density = 10 mA/cm2, working volume = 1.5 L, cathode = stainless steel)
Figures list:
Fig. SM-1. Electrochemical cell
Fig. SM-2. COD of the Outlet with different pH of the influent with a hydraulic load of 0.175 m3/m2/j
Fig. SM-3. Color of the outlet with different pH of the influent with a hydraulic load of 0.175 m3/m2/j
Fig. SM-4. pH changes in the biofilter system (hydraulic load = 0.17 m3/m2/j, temperature = 22◦C, air flowrate = 5 L/min)
Fig. SM-5. pH changes during EC process; (Current density = 10 mA/cm2, working volume = 1.5 L, initial pH = 8.4, conductivity = 5.72 mS/cm2, cathode = stainless steel)
Fig. SM-6. Production magnesium hydroxides during EC process (0, 5, 10, 15, 20 et 30 minutes) for different NaHCO3 concentrations: a) = no added NaHCO3, b) = 1 g/L, c) = 2 g/L and d) = 3 g/L of NaHCO3
Fig. SM-2. COD of the Outlet with different pH of the influent with a hydraulic load of 0.175 m3/m2/j
Fig. SM-3. Color of the outlet with different pH of the influent with a hydraulic load of 0.175 m3/m2/j
7.0 7.5 8.0 8.5 9.0 9.5 10.0 0 50 100 150 200 250
pH
Time (day)
Inlet pH Outlet pHFig. SM-4. pH changes in the biofilter system (hydraulic load = 0.17 m3/m2/j, temperature = 22◦C, air flowrate = 5 L/min)
Fig. SM-5. pH changes during EC process; (Current density = 10 mA/cm2, working volume = 1.5 L, initial pH = 8.4, conductivity = 5.72 mS/cm2, cathode = stainless steel)
Fig. SM-6. Production magnesium hydroxides during EC process (0, 5, 10, 15, 20 et 30 minutes) for different NaHCO3 concentrations: a) = no added NaHCO3, b) = 1 g/L, c) = 2 g/L and d) = 3 g/L of NaHCO3