HAL Id: hal-02055503
https://hal.uca.fr/hal-02055503
Submitted on 13 Nov 2020
HAL is a multi-disciplinary open access archive for the deposit and dissemination of sci-entific research documents, whether they are pub-lished or not. The documents may come from
L’archive ouverte pluridisciplinaire HAL, est destinée au dépôt et à la diffusion de documents scientifiques de niveau recherche, publiés ou non, émanant des établissements d’enseignement et de
Grain scale processes recorded by oxygen isotopes in
olivine-hosted melt inclusions from two MORB samples
Mélina Manzini, Anne-Sophie Bouvier, Lukas Baumgartner, Estelle
Rose-Koga, Pierre Schiano, Nobumichi Shimizu
To cite this version:
Mélina Manzini, Anne-Sophie Bouvier, Lukas Baumgartner, Estelle Rose-Koga, Pierre Schiano, et al.. Grain scale processes recorded by oxygen isotopes in olivine-hosted melt inclusions from two MORB samples. Chemical Geology, Elsevier, 2019, 511, pp.11-20. �10.1016/j.chemgeo.2019.02.025�. �hal-02055503�
Grain scale processes recorded by oxygen isotopes in
olivine-1
hosted melt inclusions from two MORB samples
2 3
Mélina Manzini1, Anne-Sophie Bouvier1*, Lukas P. Baumgartner1, Estelle F. Rose-Koga2,
4
Pierre Schiano2, Nobumichi Shimizu3
5 6
1 Institute of Earth Sciences, University of Lausanne, 1015 Lausanne, Switzerland 7
([email protected]; [email protected]; [email protected])
8
2Laboratoire Magmas et Volcans, University of Blaise Pascal-CNRS-IRD, Clermont-Ferrand, France 9
([email protected]; [email protected])
10
3Woods Hole Oceanic Institution, Woods Hole, MA 02543, USA 11
12 13
*Corresponding author: A.-S. Bouvier ([email protected])
14 15
Abstract
16
Although olivine-hosted melt inclusions from mid ocean ridge basalts (MORB) are 17
commonly used as a proxy for mantle composition, these melt inclusions generally show 18
larger elemental and isotopic compositional variation than their host lavas and the origin of 19
these heterogeneities remains disputed. Here we present oxygen isotope data from melt 20
inclusions hosted in olivine from two samples from the Mid-Atlantic ridge. Melt inclusions 21
from different crystals within the same sample show more than 2.5‰ δ18O variation within
each sample, which is nearly eight times the analytical error of 0.3‰ (2 standard deviations) 23
and five times the δ18O range in unaltered MORB. Measured δ18O in melt inclusions do not
24
correlate with common magmatic tracers, and δ18O measured in the host olivines suggest a
25
maximum of 1‰ δ18O source heterogeneity. Less than half of the melt inclusions from each
26
sample are in equilibrium with their host crystals; the remaining melt inclusions have either 27
lower or higher olivine-melt oxygen isotope partition coefficients compared to the theoretical 28
equilibrium values. Here we discuss several potential processes that could contribute to these 29
observations, but none satisfactorily explain the olivine-melt inclusion oxygen disequilibrium 30
that we observe in these samples. Nevertheless, it seems clear that the variability of δ18O in
31
melt inclusion from two MORB samples do not record only common magmatic process(es), 32
but rather a localized grain scale process. Any δ18O variation in melt inclusions should thus be
33
interpreted with caution. 34
35
Keywords
36
Olivine-hosted melt inclusions; MORB; Mid-Atlantic Ridge; oxygen isotopes; grain scale 37
processes; heterogeneity; SIMS 38
39
Introduction
40
Olivine-hosted melt inclusions are often used to study the origin and evolution of mantle-41
derived magmas (for a review, see Kent, 2008; Schiano, 2003 and references therein). Melt 42
inclusions are physically isolated from their host magma, which undergoes different processes 43
during magmatic evolution after the entrapment of melt inclusions (for example, magma 44
isotopic compositional variations are generally observed in melt inclusions when compared to 46
whole-rock or glass compositions. A widespread interpretation is that variations measured in 47
melt inclusions reflect magmatic diversity that is not recorded in whole rock compositions 48
due to obscuration during later processes (e.g., Kent, 2008). In some cases, variations could 49
also be related to small-scale reactions in the melt in which the olivine is growing 50
(Danyushevsky et al., 2004). 51
In mid-oceanic ridge basalts (MORB), most melt inclusions have trace-element compositions 52
in the range of MORB lavas, but there are also some clear exceptions to this general 53
observation (see Schiano, 2003 for a review). These ‘anomalous’ trace-element compositions 54
have usually been interpreted to reflect near-fractional melting of a depleted mantle and/or 55
spinel lherzolite, or of hydrothermally altered peridotite (e.g., Gurenko and Chaussidon, 1995; 56
Nielsen et al., 2000; Sobolev and Shimizu, 1993). The anomalous trace-element compositions 57
are not found in MORB rocks, as MORBs represent aggregates of different melt fractions 58
(e.g., Jin et al., 1994; McKenzie, 1984; Sobolev and Shimizu, 1993). Melt reaction within the 59
crust, i.e. within a crystal mush, may also explain the larger compositional variations 60
observed in some MORB melt inclusions compared to lavas (e.g., Danyushevsky et al., 2004; 61
Kamenetsky and Gurenko, 2007). 62
Major and trace element variability in melt inclusions from MORB samples are also 63
sometimes observed within a single phenocryst (Shimizu, 1998), which indicates that melt 64
inclusions are not necessarily in equilibrium with their hosts. Such small-scale diversity could 65
be generated by trace element diffusion within the melt during melt inclusion formation by 66
host dissolution-reprecipitation, or by boundary layer entrapment during fast, diffusion-67
controlled growth or melt transport (e.g., Baker, 2008; Cottrell et al., 2002; Faure and 68
Schiano, 2005; Manzini et al., 2017; Van Orman et al., 2002). Other processes, such as 69
diffusion of some elements (e.g., H, Fe) toward the host olivine or the host melt are 70
responsible, in some cases, for elemental variation in melt inclusions (e.g., Danyushevsky et 71
al., 2000a; Gaetani et al., 2012). 72
To date, no stable isotope data from melt inclusions within olivine from typical MORB 73
samples have been published. Although δ11B and δ18O were reported in some olivine-hosted
74
melt inclusions from Iceland, the petrogenetic history of these samples is fundamentally 75
different from typical MORB settings (Gurenko and Chaussidon, 1997, 2002; Hartley et al., 76
2013). In this study, we focus on δ18O values from melt inclusions within MORB samples, as
77
the systematics of this stable isotope system are well constrained. Based on a compilation of 78
δ18O data in Neogene volcanic rocks, Harmond and Hoefs (1995) concluded that bulk MORB
79
rocks have δ18O compositions of 5.7‰ ± 0.2‰. Because the variation reported is similar to
80
the typical analytical uncertainty reported in the literature for individual δ18O measurements
81
of silicate rocks at that time, the authors concluded that MORB have a uniform δ18O
82
signature. More recently, fresh MORB glasses from the Mid-Atlantic Ridge, Indian Ocean 83
and east Pacific Ridge were analyzed by laser fluorination and show a narrow range of 84
oxygen isotope ratios from 5.37 ± 0.01 to 5.81 ± 0.04 ‰ (1σ), with an average of +5.50 ‰ 85
(Eiler et al., 2000). In addition, δ18O is thought to not fractionate during melting (e.g., Eiler,
86
2001). As such, if melt inclusions are representative of the MORB source, they should show 87
similar values within a relatively restricted range; however, as melt inclusions generally show 88
larger chemical variations than those recorded by the bulk rock, δ18O in melt inclusions from
89
MORB samples might also display larger isotopic variabilities than MORB glasses. 90
Constraining the variability of oxygen isotopes in melt inclusions from MORB samples is 91
important, as δ18O variations within these melt inclusions serve to assess the importance of
92
fluid interaction, magma mixing and/or assimilation of oceanic crust (Gurenko and 93
Chaussidon, 2002; Hartley et al., 2013). In this study we report δ18O data from melt inclusions
never before reported large range of δ18O compositions within these melt inclusions, up to
96
2.5‰, and discuss the reported data in term of magmatic processes, olivine dissolution-97
precipitation and diffusion. 98
99
Sample description and geological context
100
The studied olivine-hosted melt inclusions are from two dredged basalts from the North 101
Atlantic ridge. Sample ARP73-10-03 is a picrite from the FAMOUS zone (36°8372’N, 102
33°2482’W) that contains a little more than 20% olivine phenocrysts (Fo87.2-91.3), rare
103
clinopyroxene, and plagioclase xenocrysts. The crystals are surrounded by a hyalocrystalline 104
groundmass composed of glass, plagioclase (An75-80) and olivine microlites (Fo86) (Laubier et
105
al., 2007). Laubier et al. (2007) suggest that the variable major and trace element 106
compositions of ARP73-10-03 melt inclusions reflect polybaric partial melting of a 107
homogeneous mantle, followed by mixing in various proportions at either different degrees of 108
melting or in different parts of the melting system. 109
CH77-DR6-203 is a dredged basalt from the 14° MAR triple junction (14.12°N, 45°W). This 110
fresh sample is highly enriched in volatiles, with CO2 in vesicles and water in the glass,
111
(popping rock; Javoy and Pineau, 1991) and shows a compositional anomaly with enriched 112
(Nb/Zr)N, (Ta/Hf)N and (La/Sm)N compared to adjacent segments which may result from
113
mantle heterogeneity (Bougault et al., 1988). The mantle heterogeneity hypothesis is also 114
supported by Sr and Nd isotopes in MORB rocks from different segments of the triple 115
junction (Dosso and Bougault, 1986). The melt inclusions studied here are hosted in 1-5 mm, 116
polyhedral olivines containing one or several melt inclusions. They are glassy, sub-spherical, 117
and have a radius of 40-350 μm. They contain no daughter minerals. Rare shrinkage bubbles 118
are present, but represent only a small fraction of the total volume. 119
120
Methods
121 122 Sample preparation 123Polished olivines containing exposed melt inclusions were pressed into 1-inch indium mounts, 124
along with the glass standards (BHVO-2G, BCR-2G and BIR-1G) and San Carlos olivine. 125
Care was taken to mount them within 8 mm of the center of the mount. A separate mount was 126
made for each sample. SEM images were acquired at the University of Lausanne using a 127
Tescan Mira LMU field-emission scanning electron microscope operated at 20 kV and 0.2-0.4 128
nA probe current to ensure that the melt inclusions were totally glassy. Melt inclusions with 129
cracks or crystals were discarded. Topography of each mount was measured using a Brucker 130
GTA-K white light interferometer. 131
132
Electron microprobe
133
Major element compositions and X-ray distribution maps of melt inclusions and olivines were 134
acquired using a JEOL 8200 Superprobe electron microprobe analyzer. Analytical conditions 135
for the quantitative measurement of olivine were 15kV at 20nA and a 5 μm beam diameter. 136
Counting times were 30 s for Si, Mg, Mn and Fe and 40 s for Al, Ca, Ni and Cr. Analytical 137
conditions for analyses of melt inclusions were 15kV, 10 nA and a 10 μm beam diameter. 138
Counting times were 30 s for all elements except for K (20 s) and Na (16 s). A glass standard 139
(KL2-G) was used for SiO2 and Al2O3. All other elements were calibrated on minerals. A
140
grain of ML3B-G was used as an internal standard to check the calibration. 141
Secondary ion mass spectrometer
143
Oxygen isotope ratios, volatiles (H2O, CO2, Cl, F) and trace-element (Ti, V, Sr, Y, Nb, Ba,
144
La, Ce, Nd, Sm, Eu, Yb) concentrations were determined using the CAMECA ims1280-HR at 145
the SwissSIMS laboratory. 146
Oxygen isotopes
147
Analytical conditions were similar to those described by Seitz et al. (2017): Throughout 148
18O/16O measurements of melt inclusions and olivines, the sample was sputtered with a Cs+
149
primary beam of 2 nA, which was raster over 15 μm. An electron gun was utilized in order to 150
compensate for sample charging. Samples were pre-sputtered for 30 s, followed by 80 s of 151
analysis (20 cycles of 4 s). Automatic centering of secondary ions on field and contrast 152
apertures were performed before each analysis. Measurements of 16O and 18O were performed
153
simultaneously via two Faraday cups, using 1010 and 1011 resistors, respectively. The intensity
154
of 16O was typically ~ 2.2x10⁹ countsper second for glasses and ~1.7x10⁹ counts per second
155
for olivine. Internal error (2 standard error), reflecting the counting statistics of one analysis, 156
was usually better than 0.3‰ for melt inclusions and olivines. 157
For melt inclusions, instrumental mass fractionation (IMF) was corrected using a set of 9 158
international glass standards with compositions ranging from basaltic to rhyolitic (NKT-1G, 159
GOR132-2G, BIR-2G, BHVO-2G, ML3B-2G, BCR-2G, StHs6/80G, UoE-Lipari, ATHO-G; 160
Hartley et al., 2012; Jochum et al., 2006). The matrix effect was corrected using a linear 161
regression of IMF with SiO2 (Figure DR1-A). Two to three standards (BHVO, BIR and BCR),
162
with compositions closely bracketing the melt inclusion compositions, were added on each 163
mount to monitor and correct for potential instrumental drift. For olivines, IMF was corrected 164
using an in-house San Carlos olivine standard (Fo 90.1), as well as three in-house olivine 165
reference materials (Fo 99.6, Fo 91.9 and Fo 37.5; Fig DR1-B). 166
At the outset of each session, we performed at least eight measurements of a running standard 167
(i.e., measured repeatedly during the session; BHVO for melt inclusions sessions and San 168
Carlos for olivine sessions), in order to determine standard reproducibility (noted hereafter in 169
2 standard deviation, 2SD). The 2 SDs were better than 0.3‰ for melt inclusions sessions, 170
and 0.4‰ for olivines sessions. To monitor the instrument stability, running standards were 171
measured every 8 to 12 unknowns and gave a reproducibility of 0.3‰ 2SD, similar to the 172
eight measurements at the outset of each session. Accuracy was checked using one of the two 173
to three standards inserted in each mounts and was similar to reproducibility (0.3‰ 2SD and 174
0.4‰ 2SD for melt inclusions and olivines, respectively). 175
176
Trace elements
177
Phosphorous concentrations within melt inclusions were measured using the same analytical 178
conditions described by Manzini et al. (2017): Trace-element compositions of melt inclusions 179
and olivine were analyzed using a 5-6 nA O- primary ion beam, resulting in an analysis spot
180
of about 20 μm. A mass resolution of 5000 was used. Samples were pre-sputtered for 90 s, 181
using a 25 μm raster. Trace elements were quantified by measuring the signal from the 182
following isotopes: 48Ti, 51V, 88Sr, 89Y, 93Nb, 138Ba, 139La, 140Ce, 142Nd, 152Sm, 153Eu, 172Yb.
183
These measurements were performed in mono-collection mode by peak switching throughout 184
one analytical run on an electron multiplier (EM) collector. 40Ca was measured on a FC
185
collector in the same analytical run as the other trace elements and was used as reference 186
element. Using 40Ca instead of 30Si (or 28Si) during melt inclusion analyses allowed us to
187
check for possible contamination by olivine throughout the analyses. A waiting time was used 188
to obtain a steady state sputtering condition, and each analysis consisted of six cycles. 189
Waiting and counting time, typical standard reproducibility and typical internal error are 190
given in Table DR1. BHVO-2G was used as standard for melt inclusions, using the USGS 191
certified values for the trace elements. 192
193
Volatile elements
194
A Cs+ primary ion beam with a current of 1.5 nA was used to measure volatile elements
195
(H2O, CO2, Cl, F, S); throughout these analyses an electron gun was used to compensate the
196
charges and to avoid charging of the sample surface. The secondary beam was accelerated at 197
10 kV, and the sample was pre-sputtered applying a 15 μm raster for 210 s. Elements were 198
measured in mono-collection mode, with a 10 μm raster during 12 cycles. Total analysis time, 199
including pre-sputtering, was approximately 14 minutes. The field aperture was set to 3000 200
μm, entrance slit to 60 μm and exit slit to 240 μm. This configuration allowed a mass 201
resolution of 5000, sufficient to fully discriminate the interferences. BHVO-2G, BCR-2G, 202
BIR-1G, ALL, NS and ALV (Helo et al., 2011) were used as standards. BHVO-2G was then 203
used as a running standard to check instrument stability. Background was determined by 204
analysis of a synthetic anhydrous olivine. Additional information is given in Table DR1. 205
206
Results
207
A total of 34 melt inclusions within 30 olivines were measured from sample CH77-DR6-203, 208
as were 17 melt inclusions within 13 olivines from sample ARP73-10-03. The results of these 209
analyses are summarized in Table DR2. Oxygen isotope ratios in olivines are reported in 210
Table DR3. 211
Analyzed olivines are characterized by a high forsterite content (Fo = Mg/Fe+Mg) ranging 212
from 88.8 to 91.4 for ARP73-10-03 and from 84.0 to 90.9 for CH77-DR6-203. Major-element 213
compositions of melt inclusions were corrected for the effect of post-entrapment 214
crystallization (PEC) of olivine at the wall of melt inclusion, using the Petrolog software 215
package (Danyushevsky and Plechov, 2011). Parameters used for Petrolog calculations are 216
summarized in the footnote of Table DR2. Our calculated PEC indicates that between 5.9 and 217
18.1% of olivine crystallized after melt inclusion trapping. Major elements are less variable 218
after PEC correction (e.g., SiO2 variation of 2.8 wt. % before and 1.6 wt. % after correction;
219
Table DR2), and all major-element compositions mentioned hereafter are corrected for PEC. 220
Melt inclusions from ARP73-10-03 have a narrow range of major-element compositions, with 221
SiO2 ranging from 50.0-50.4 wt. %, MgO from 11.2-12.8 wt. % and K2O from 0.10-0.15 wt.
222
%. CH77-DR6-203 shows a slightly larger compositional range in major elements, with SiO2
223
content from 49.2-50.8 wt. %, MgO from 7.8-10.0 wt. %, and K2O from 0.20-0.55 wt %
224
(Figure 1A). Major-, volatile- (Cl, F, S) and trace-element concentrations measured in 225
ARP73-10-03 fall within the same range as those reported by Laubier et al. (2012) for melt 226
inclusions within the same sample and are consistent with glass N-MORB compositions 227
(Jambon et al., 1995; Naumov et al., 2014; Wallace and Carmichael, 1992). Water and CO2
228
concentrations are also in the typical range of MORB glass values (Danyushevsky et al., 229
2000b; Magenheim et al., 1995; Wallace and Carmichael, 1992). The melt inclusions from 230
CH77-DR6-203 are enriched in volatiles (to a lower extent for CO2) when compared with
231
MORB glass values, and have trace-element compositions similar to typical E-MORB glasses 232
(e.g., Figure 1B modified from Gale et al., 2013). 233
234
Figure 1: Oxygen isotope values for MI plotted against the K2O concentration (A) and the La/Sm 235
chondrite-normalized ratio (McDonough and Sun, 1995) (B). Line separating D-, N- and E-MORB are
236
from Gale et al., 2013a. Fresh MORB glasses studied represented by white triangles in the figure, are
237
plotted for comparison (Eiler et al., 2000).
238 239
Oxygen isotopes from melt inclusions show > 2.3‰ variation within each sample (δ18O =
240
+5.0 ± 0.17 to+7.2 ± 0.16‰, with an average of +6.2‰ for CH77-DR6-203; and δ18O = +4.5
241
± 0.3 to +7.1 ± 0.6‰, average +5.7‰ for ARP73-10-03). These variations are about eight 242
times larger than the analytical uncertainty (0.3‰, 2SD) and about five times larger than the 243
variations observed for bulk δ18O of unaltered MORB glasses (<0.5‰; Figure 2). Before IMF
244
correction, data show similar δ18O variations (2.2‰). This is explained by the relatively
245
narrow range of SiO2 of the melt inclusions within a sample, which indicates that the applied
246
IMFs are relatively similar (± 0.13‰) for all melt inclusions from the same sample. ARP73-247
10-03 is the closest to MORB glass composition in term of major, trace elements and oxygen 248
isotopes. Nevertheless, 8 melt inclusions out of 21 have ‘anomalous’ δ18O composition (i.e.,
249
statistically – 2 SD – outside the range of MORB glass bulk values). Within a single olivine, 250
δ18O from different melt inclusions are statistically different in the ARP73-10-03 sample (3
251
pairs, variation up to 2.2‰), whereas in the CH77-DR6-203 sample, melt inclusions hosted in 252
a single olivine have values within analytical uncertainty δ18O (3 pairs, variation less than
253
0.4‰; Figure 3). In both samples, olivines show smaller variability than their hosted melt 254
inclusions: the ARP73-10-03 olivine have δ18O values of +4.9 to +5.7‰ and olivines from
255
CH77-DR6-203 have δ18O ranging from +5.0 to +6.5‰ (Table DR3, Figure 2).
256
257
Figure 2: Comparison of oxygen isotope variations in MORB glasses from Mid-Atlantic Ridge,
258
Indian ocean and east-Pacific Ridge (n = 28) (Eiler et al., 2000) and melt inclusions (MIs) from the
259
two studied MORB samples (ARP73-10-03 and CH77-DR6-203). For a comparison, range of δ18O 260
composition measured in the olivines hosting the melt inclusions are also plotted (dashed line
261
contoured fields). Melt inclusions show larger variability compare to MORB glasses and to their host
262
olivines.
264
Figure 3: Oxygen isotope ratio of melt inclusions, compared to the δ18O of their host olivine crystals. 265
Melt-olivine equilibrium fractionation (Δ18O; black line) is from Matthews et al. (1998). Only 42 and 266
46% of melt inclusions from ARP_73-10-03 and CH77-203-DR6 are in equilibrium with their host,
267
within analytical error.
268 269
Discussion
270
To date, no oxygen isotope data have been reported for olivine-hosted melt inclusions from 271
MORB samples. Only two studies (Gurenko and Chaussidon, 2002; Hartley et al., 2013) 272
reported δ18O in olivine-hosted melt inclusions, and these data are from 7 samples taken from
273
Iceland. These studies found δ18O variation reaching a maximum of 1.2 ‰ (+4.0 to +5.2‰,
274
sample 14161G, n = 3 melt inclusions; Gurenko and Chaussidon, 2002) and 0.95 ‰ (+3.05 to 275
+4.0‰, sample N18, n = 9 melt inclusions; Hartley et al., 2013), respectively. These 276
variations were interpreted to reflect either mixing of the ascending magma with melt lenses 277
that had previously interacted with the low-δ18O Icelandic crust (Hartley et al., 2013), or
278
heterogeneity in the Icelandic mantle or mixing of two end-members (Gurenko and 279
Chaussidon, 2002). Melt inclusions from the two MORB samples measured in our study both 280
show more than 2.3‰ variation in δ18O, a larger variation than that reported for
olivine-281
hosted melt inclusions from Iceland. Hereafter, the δ18O variability is discussed in term of
282
analytical versus magmatic processes. 283
284
Analytical artefacts
285
Oxygen isotope analyses via SIMS are very sensitive to the sample geometry, i.e. the 286
placement of the analyzed grains in the mount and the topography of the analyzed material 287
(e.g., Kita et al., 2009). All grains and reference material have been placed within 8 mm of the 288
center of the mount, in order to avoid X-Y effects due to deformation of the electrostatic field 289
close to the edge of the sample holder (Peres et al., 2013) (see methods section for more 290
details). Reproducibility of the measurements of a homogeneous reference material for 291
oxygen isotope is typically <0.3‰ (2 SD) when the surface relief is 1 µm, whereas it 292
increases up to 3‰ (2SD) when topography is on the order of 10-40 µm (Kita et al., 2009). 293
Our mounts show < 4 µm topography both between the indium and grains, and between 294
olivine and melt inclusions. Two different cases are presented in Figure 4: First, Figure 4-A 295
shows olivine CH77-DR6-203_37 hosting 2 melt inclusions with similar δ18O (within the
296
0.3‰ 2SD calculated for a session, +6.37±0.21‰ and +5.97±0.16‰) and a topography of 297
1µm. Olivine ARP73-10-03_16, shown in Figure 4-B, has δ18O in melt inclusions which vary
298
from +5.15 ± 0.21‰ to +6.42 ± 0.26‰. This olivine has a topographical variation of up to 4 299
µm, with a difference in topography of 1.5 µm between melt inclusions A, C and D 300
(maximum 1.3‰ difference in δ18O), and 2.5 µm between melt inclusions A and B (similar
301
δ18O). Melt inclusions are less than 1 µm lower compared to the olivine, which should not
to wall in melt inclusion A, and 7 in melt inclusion B yield a reproducibility better than 0.3‰ 304
(2SD) (Table DR2). Also, multiple measurements (n = 75) located at the edge or in the center 305
of the olivine grain ARP73-10-03_16, which shows the largest topographical variation, yield 306
data clustering within 0.45‰ (2SD; Table DR3), comparable to the reproducibility obtained 307
during the same session for San Carlos reference material that has negligible topography 308
(0.40‰, 2SD). Moreover, δ18O from melt inclusions within ARP73-10-03_16 A and B were
309
measured twice, in two different sessions and similar values were obtained. As the mount was 310
placed in the sample holder with a different orientation, this confirms that measured δ18O
311
variation cannot be due to sample topography or orientation. Based on these observation, we 312
find it highly unlikely that topography of the grains is responsible for the large variation of 313
δ18O in the melt inclusions analyzed in this study. As the calibration of the SIMS analyses
314
reported here were made using several reference materials covering the range of melt 315
inclusions major elements (Fig. DR2). Hence we conclude that the observed δ18O variations
316
are real in melt inclusions and do not represent analytical artefacts. 317
318
Figure 4: Example of profilometer images of the studied samples. A – ARP73-10-03_16 olivine; B –
319
CH77-DR6-203_37 olivine. The number of points is specified when more than one analyses was
320
obtained in the same inclusion, and the error (2SD) represents the reproducibility on the repeated
321
measurements.
322 323
Effects of different magmatic processes
324
Partial melting causes large variations in the major- and trace- element concentrations of 325
MORBs (e.g., Frey et al., 1993; Schilling et al., 1983; Zindler et al., 1979), but is not expected 326
to largely fractionate oxygen isotopes. Indeed, Bindeman et al. (2012) estimate that extraction 327
of 15% of the melt, assuming equilibrium is maintained throughout the melting, will change 328
create less than 0.2 ‰ δ18O variations (e.g. Eiler, 2001). Variation in the degree of partial
330
melting will thus not be resolvable by SIMS, given the typical precision of ~0.3‰ 2SD. 331
Hence, the lack of correlation between δ18O and the abundance of incompatible elements such
332
as [La/Sm]N for example (Figure 1), which are sensitive to degree of melting, indicates that
333
variable extents of partial melting cannot explain the large δ18O scatter measured in this study.
334
Interestingly, ARP73-10-03 has a composition similar to that of typical MORB glass (N-335
MORB) in terms of [La/Sm]N, K2O and volatile contents, and average δ18O composition (e.g.,
336
Eiler et al., 2000; Gale et al., 2013), whereas CH77-DR6-203 has higher (La/Sm)N, volatiles,
337
K2O contents, and δ18O than that of N-MORB glass (Figure 1). Differences in (La/Sm)N,
338
volatiles and K2O contents between the two samples could reflect different degrees of
339
melting, but the different average δ18O rather suggests melting of an enriched mantle source
340
for CH77-DR6-203. Despite the melting of different mantle sources for the two samples, 341
resulting in different δ18O for their respective melt inclusions, a similar variation of δ18O
342
(~2.5‰) is observed in melt inclusions for both samples. 343
The lack of correlation between δ18O of the melt inclusions and the forsterite content of their
344
host olivines do not support large fractionation of oxygen isotopes during magmatic evolution 345
of the studied samples (Figure 5). This observation is consistent with an experimental study 346
examining crystallization of a MORB melt dominated by olivine and plagioclase fractionation 347
(Tormey et al., 1987), which shows that the oxygen isotopic composition of the melt should 348
not vary by more than 0.1 ‰ for a MgO content between 3 to 8 wt% (Eiler, 2001). Recently, 349
Bucholz et al. (2017) modelled change in δ18O in tholeiite during fractional crystallization and
350
also found minor change in δ18O (up to 0.35‰ for composition comparable to ARP73-10-03
351
and CH77-203-DR3 melt inclusions). 352
353
Figure 5: Plot of oxygen isotopes of olivine and of melt inclusions plotted against the Fo content of
354
the host olivines. Full symbols are for melt inclusions, empty symbols represent olivines.
355 356
Considering the low volatile concentrations in MORB lavas, the effect of magma degassing 357
on oxygen isotopes should be negligible. In fact, the total devolatilization of MORB magmas 358
will change the δ18O by less than 0.1 ‰ (Eiler, 2001). Similarly, oxygen fugacity changes in
359
the magmatic system should not create any oxygen isotope ratio variations as the fractionation 360
of oxygen isotopes in the melt is not controlled by fO2 (Lester et al., 2013).
361
Assimilation of altered oceanic (AOC) crust with variable δ18O (1-6‰ for lower AOC and
7-362
15‰ for upper AOC; e.g. Alt, 2003; Alt and Bach, 2006) may also affect the δ18O variability
363
observed in melts (e.g., Genske et al., 2013). The assimilation process can be modeled by 364
simple mixing, because MORB melts and AOC have very similar oxygen concentrations. If 365
we consider a typical mantle composition of δ18O=5.5 ‰ (Eiler, 2001; Mattey et al., 1994)
366
and mix it with an altered upper oceanic crust with δ18O=15 ‰ (e.g., Alt, 2003), a minimum
367
of 17% assimilation of upper AOC is required to explain the highest δ18O measured in melt
368
inclusions (7.1‰) from ARP73-10-03. This amount of upper AOC assimilation (>17%) 369
upper AOC of 300 ppm (e.g., Kelley et al., 2003) and 13.9 ppm for uncontaminated MORB 371
(Hofmann, 1988). As melt inclusions from ARP73-10-03 (N-MORB sample), have Ba 372
contents typical of N-MORB (around 20 ppm; maximum 34 ppm Ba), we find that 373
assimilation of upper crustal material is not likely to be responsible for the high δ18O values
374
measured in these melt inclusions. Similarly, a minimum of 22% assimilation of the upper 375
AOC is required to obtain the lowest δ18O (4.5‰) of the melt inclusions, assuming an
376
extreme lower AOC composition of δ18O=1‰ (as in hydrothermal amphibolite veins; e.g.,
377
Alt and Bach, 2006). Assimilation of serpentinites that have δ18O values of 2.0 to 6.7‰, with
378
most of the values <5‰ (Barnes et al., 2014; Boschi et al., 2008) would require a larger 379
amount of assimilation compared to AOC, and could not account for the δ18O up to 7.1 ‰ or
380
down to 4.5 ‰. 381
The absence of correlation between elements that are similarly incompatible in the dissolution 382
reactions of pyroxene, plagioclase and spinel (e.g., S and Ce; Danyushevsky et al., 2004) 383
suggests that local grain-scale dissolution-reaction mixing processes (Danyushevsky et al., 384
2004) is an unlikely process to explain the δ18O variations in melt inclusions. In fact, open
385
system local dissolution of minerals formed in equilibrium with a basaltic melt will not 386
change the δ18O composition of the ascending basaltic melt.
387
The δ18O variability of 1.1 and 1.4 ‰ in the olivine crystals (δ18O(Ol)) from ARP73-10-03 and
388
CH77-DR6-203 (Table DR3), respectively, is an indicator that these olivine crystals record 389
crystallization in a heterogeneous environment, or record a heterogeneous crystallization 390
history. Considering the typical reproducibility of olivine measurements of 0.4‰, these 391
variations are not likely to reflect analytical artefacts and should therefore represent real 392
heterogeneities. In fact, individual crystals are homogeneous within measurement uncertainty 393
of ca. 0.4 ‰, while different crystals from the same sample are more variable. In terms of 394
major elements, each crystal is homogeneous (with the exception of P heterogeneities in some 395
olivines; Manzini et al., 2017), but all olivines have different Fo contents (Table DR3). 396
Within each sample, no clear trend is observed between Fo content and average δ18O(Ol) (Fig.
397
5). At a given Fo content, δ18O(Ol) varies up to 0.9‰. This observation suggests that these
398
olivine crystals from both samples grew in slightly heterogeneous environments (~0.9-1‰ 399
variation). 400
401
Olivine-melt inclusion isotopic disequilibrium
402
Equilibrium fractionation between olivine and melt (Δ18O
ol-melt) at 1250°C is -0.6 ‰, based on
403
Matthews et al. (1998), which is equivalent to twice the uncertainty of the measured 404
compositions. As mentioned above, Δ18O variability in the studied melt inclusions is larger
405
than the heterogeneity of their host olivines. Only 42 and 46% of melt inclusions from 406
ARP_73-10-03 and CH77-203-DR6 are in equilibrium with their host (Figure 3). The 407
remaining melt inclusions have either lower or higher Δ18O
ol-melt compared to the theoretical
408
equilibrium value at 1250°C. While the proportion of melt inclusions in equilibrium with their 409
host olivine is similar for both samples, the proportion of melt inclusions with higher versus 410
lower Δ18O
ol-melt is different for each sample. In detail, within an olivine containing several
411
exposed melt inclusions, Δ18Ool-melt can vary significantly. No correlation is observed between
412
olivine-melt isotopic disequilibrium and Fo content of the host olivine, which indicates that 413
disequilibrium conditions could have prevailed at any time during the samples’ magmatic 414
history. An important observation is that melt inclusions in equilibrium with their host 415
olivines do not show significant δ18O variation (5.7±0.3‰ for ARP73-10-03 and 6.3±0.5‰
416
for CH77-203-DR6). Assuming equilibrium between olivine and melt, variations in 417
temperature throughout crystal growth could affect Δ18Ool-melt. However, the large variation of
418
We propose that the measured Δ18Ool-melt variations instead indicate disequilibrium. Lower or
421
higher Δ18O
ol-melt compared to theoretical equilibrium require either a process able to shift the
422
equilibrium toward both higher and lower values, or a combination of different processes. 423
Oxygen diffusion along the moving interface between melt and crystal during crystal growth 424
or after melt inclusion entrapment is a process capable of generating isotopic disequilibrium 425
between melt inclusions and their host olivine. Rapid crystal growth can lead to a local 426
disequilibrium in the growth media, creating boundary layers in which elements with the 427
lowest diffusivity in the melt and/or lowest partition coefficients (e.g., S, Cl, P, Al) will 428
concentrate. It has been demonstrated that this process can create melt inclusion compositions 429
with different major elements (Faure and Schiano, 2005; Watson and Müller, 2009), volatiles 430
(S, Cl) and/or P content (Baker, 2008) compared to the bulk melt composition. Oxygen is also 431
a slow diffusing element in relatively dry melts, with 16O diffusing faster than 18O (e.g.,
432
Lesher, 2010); therefore, such a boundary layer should have a higher δ18O composition than
433
the melt in which the crystal in growing. Melt inclusions from ARP-73-10-03 have major, 434
trace and volatile elements compositions similar to MORB, with no enrichment in Al, S, Cl or 435
Ca; however, some melt inclusions within this sample do have higher P contents due to 436
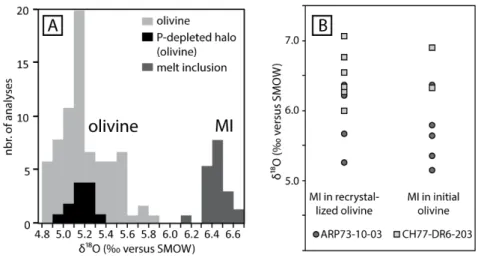
olivine dissolution near P-rich (fast growing) domains (Manzini et al., 2017). No significant 437
difference in δ18O(Ol) between P-rich and P-poor domains within each olivine are observed
438
(Figure DR2). Moreover, δ18O
(Ol) compositions of the recrystallized olivine (P-depleted halo)
439
are similar to those of the primary olivine (Figure 6A). Figure 6B shows the δ18O of melt
440
inclusions from both samples, as a function of their location (in primary olivine, or in 441
recrystallized domains), based on phosphorus maps of the host olivines. No systematic shift in 442
δ18O as a function of the olivine domain in which the melt inclusion is trapped can be
443
resolved. Also, isotopic disequilibrium can be found in melt inclusions trapped in olivine with 444
or without P zoning (Table DR2), suggesting that the MI-Olivine δ18O disequilibrium and
large δ18O variations in melt inclusions are not related to initial rapid crystal growth creating
446
P-rich domains, nor to the dissolution of P-rich olivine domains. 447
448
Figure 6: A: Comparison of δ18O measured in the ARP73-10-03_16 olivine (P-enriched and P-normal 449
zones), in the re-precipitated part (P-depleted zone around melt inclusion) and in the 2 melt inclusions
450
situated in the P-zoned olivine part. No differences in oxygen isotope can be seen between the
451
different parts of the olivine. B: Comparison of δ18O measured in melt inclusions located in 452
recrystallized olivine (i.e. close to a P-zoned region of the olivine) and in unzoned olivine parts,
453
probably in initial olivine, that did not suffer from dissolution and re-precipitation. No differences can
454
be observed between the two populations, but in general CH77-DR6-203 has higher δ18O values than 455
ARP73-10-03.
456 457
As argued above, olivine-hosted melt inclusions within the samples studied here suffered 458
from PEC of olivine. Manzini et al. (2017) have shown that this thin (< 1 µm) layer 459
crystallizes a few hours before eruption. This fast crystallization results in a strong P 460
enrichment of the late-crystallized olivine. Post-entrapment crystallization could thus generate 461
a thin boundary layer with a distinct (high) δ18O
(Ol) composition and lower the initial δ18O of
462
the melt inclusions. Given the small volume of the PEC (1 µm layer compared to melt 463
composition. This assumption is verified by the absence of a correlation between amount of 465
PEC or P with δ18O of the melt inclusions or Δ18O ol-melt.
466
Diffusion of O in and out of the melt inclusions could in theory produce higher or lower 467
Δ18Ool-melt. Oxygen can diffuse as mono or multi-species. Indeed, O is present in CO2 and
468
H2O molecules. It is known that water can diffuse in or out of melt inclusions (e.g., Chen et
469
al., 2013; Gaetani et al., 2012; Portnyagin et al., 2008), but mostly in the form of H+. Given
470
the low water content involved in MORB systems, this should not produce large δ18O
471
variations in melt inclusions (Zhang and Ni, 2010). It is possible that CO2 could largely degas
472
in melt inclusion shrinkage bubbles (e.g., Moore et al., 2015); migration of CO2 in the bubble
473
may fractionate δ18O, but as 16O is diffusing faster this could only generate higher δ18O. Melt
474
inclusions with the lowest Δ18O
ol-melt do not necessarily contain shrinkage bubbles, which
475
indicates that fractionation of O isotopes is not related to shrinkage bubble formation. 476
Diffusion of O after melt inclusion entrapment would imply that melt inclusions were initially 477
not in equilibrium with their host at the time of entrapment and thus cannot explain the origin 478
of the large variation of δ18O in the studied melt inclusions. If O isotopic diffusion occurred
479
after melt inclusion entrapment, it should be limited based on the following observations: 480
First, based on P profiles made from melt inclusions in olivines, melt inclusions were trapped 481
for a few hours to a few days before quenching (Manzini et al., 2017). Using the diffusion 482
data of Dohmen et al. (2002) (this dataset yields a diffusion coefficient of ~9.3x10¹² in olivine
483
at 1250°C), this amount of time would result in a small amount of O diffusing from melt 484
inclusion to olivine over a profile no longer than 10 microns, which is not resolvable using the 485
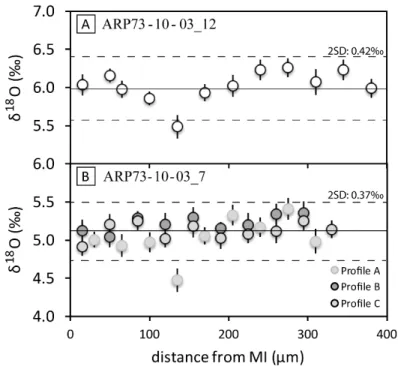
techniques employed in this study. This is confirmed by δ18O profiles obtained from three
486
different olivines, in which melt inclusions are either in disequilibrium (Figures 7A and DR2) 487
or equilibrium (Figure 7B), starting at ~15-30µm from the inclusion wall, do not show any 488
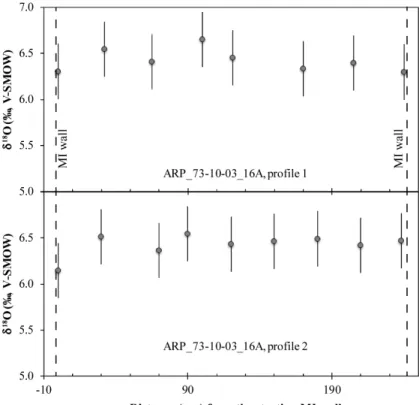
significant increase or decrease of δ18O values toward the MI. Second, δ18O profiles measured
within a single melt inclusion, from olivine wall to MI center, give similar values (Figure 8). 490
Lastly, there is no correlation between the melt inclusion size and the δ18O value of the melt
491
inclusion. 492
493
Figure 7: Oxygen isotopes profiles in olivines, starting from melt inclusion. A: oxygen isotopes
494
profile in olivine ARP73-10-03_12, for which melt inclusion “a” is not in equilibrium. Profile starts
495
from the melt inclusion. B: different δ18O profiles done around the melt inclusion (in equilibrium) 496
entrapped in olivine ARP-10-03_7. The 3 profiles start from 3 different locations around the melt
497
inclusion and all are made in different directions. No clear diffusion profile from the melt inclusion
498
toward the olivine can be observed. Black lines represent the average composition of olivine and
499
dashed lines the 2 SD variations of the data along the profiles.
500 501
502
Figure 8: Oxygen isotopes profiles in melt inclusion APR-73-10-03_16A, from wall to wall. Two
503
profiles were performed in this melt inclusion, perpendicular to one other.
504 505
In theory, oxygen diffusion could occur in response to a thermal gradient (Soret diffusion). 506
Indeed, Kyser (1998) and Bindeman et al. (2013) reported significant isotopic fractionation of 507
oxygen isotopes (up to 5.0‰) in anhydrous basaltic melt due to thermal diffusion, with 508
migration of 18O towards the colder regions. However, such a process has never convincingly
509
been demonstrated in natural samples. Kyser (1998) pointed out that, even if thermally 510
induced diffusion can lead to large δ18O fractionation, the rapid decay of thermal gradient (<
511
10 days for 100° gradient at 1 cm from contact) makes it an unlikely process to happen in 512
natural samples. Given the short timescale associated with the olivine residence time and melt 513
inclusion formation in our samples (Manzini et al., 2017), a locally large thermal gradient (> 514
250°C) between migrating magma and conduit walls might be sustained before melt inclusion 515
trapping. Assuming such a scenario, melt inclusions with δ18O lower might form in olivine
located in the center of a conduit, whereas melt inclusions with higher δ18O would form close
517
to the walls of the conduit; however, olivine crystallizing around the melt inclusions should 518
also have variable δ18O, which is not observed. This observation indicates that O diffusion in
519
response to a thermal gradient is not responsible for the δ18O variation in melt inclusions.
520 521
Concluding remarks
522
The large variations (up to 2.5‰) observed in oxygen isotope ratios within melt inclusions 523
from 2 different Atlantic MORB samples (N-MORB and E-MORB) are not correlated with 524
major, trace or volatile elements. Oxygen isotope compositions of host olivines suggest a 525
small (<1‰) source heterogeneity for each sample. Less than half of the melt inclusions from 526
each sample are in isotopic equilibrium with their host olivines. The remaining melt 527
inclusions have either lower or higher isotopic fractionation compare to theoretical 528
equilibrium values. Boundary layer entrapment will only shift δ18O toward higher values, and
529
the present dataset does not support this hypothesis. Fractionation diffusion of O during CO2
530
migration into the shrinkage bubble will shift δ18O toward lower values, but no evidence of
531
this process has been found. Another process capable of generating δ18O fractionation both
532
higher and lower than equilibrium values is O diffusion in due to the presence of a thermal 533
gradient before melt inclusion entrapment (i.e. Soret diffusion). Although this process could 534
explain the large δ18O variation measured, it would imply that a large, unrealistic, thermal
535
gradient (> 250°C) is sustained during the formation of melt inclusions. In addition, the 536
olivine directly surrounding the melt inclusion should also have a different δ18O in this
537
scenario, which we do not observe. 538
Despite the marked disequilibrium in a majority of melt inclusions, our data do not show any 539
high temperature after melt inclusion entrapment and the relatively large spatial resolution of 541
the SIMS (10-15 microns). The exact process responsible for the melt inclusion-host δ18O
542
disequilibrium is thus not yet fully understood. Nonetheless, we argue that this dataset clearly 543
shows that melt inclusions do not necessarily record the δ18O composition of the magma in
544
which their host grew. Caution should thus be taken before interpreting δ18O variation as
545
source process, especially when not related to any other tracer of common magmatic 546 processes. 547 548
Acknowledgements
549We acknowledge funding by the KIP6 PCI to L. P. Baumgartner. C-J. de Hoog, E. Bloch and 550
O. Müntener are thanked for the useful comments which significantly improved the 551
manuscript. The authors are thankful L. Danyushevsky, and anonymous reviewer and the 552
editor, C. Chauvel, for their helpful reviews and comments. E. F. Rose-Koga acknowledges 553
financial support from the Centre National de la Recherche Scientifique (INSU-SYSTER) and 554
from the Région Auvergne-Rhône-Alpes. 555
556 557 558
559
References
560
Alt, J.C., 2003. Stable isotopic composition of upper oceanic crust formed at a fast spreading ridge,
561
ODP Site 801. Geochemistry, Geophys. Geosystems 4, 1–11.
562
https://doi.org/10.1029/2002GC000400
563
Alt, J.C., Bach, W., 2006. Oxygen isotope composition of a section of lower oceanic crust, ODP Hole
564
735B. Geochemistry, Geophys. Geosystems 7. https://doi.org/10.1029/2006GC001385
565
Baker, D.R., 2008. The fidelity of melt inclusions as records of melt composition. Contrib. to Mineral.
566
Petrol. 156, 377–395. https://doi.org/10.1007/s00410-008-0291-3
567
Barnes, J.D., Beltrando, M., Lee, C.T.A., Cisneros, M., Loewy, S., Chin, E., 2014. Geochemistry of
568
Alpine serpentinites from rifting to subduction: A view across paleogeographic domains and
569
metamorphic grade. Chem. Geol. 389, 29–47. https://doi.org/10.1016/j.chemgeo.2014.09.012
570
Bindeman, I.N., Kamenetsky, V.S., Palandri, J., Vennemann, T., 2012. Hydrogen and oxygen isotope
571
behaviors during variable degrees of upper mantle melting: Example from the basaltic glasses
572
from Macquarie Island. Chem. Geol. 310–311, 126–136.
573
https://doi.org/10.1016/j.chemgeo.2012.03.031
574
Bindeman, I.N., Lundstrom, C.C., Bopp, C., Huang, F., 2013. Stable isotope fractionation by thermal
575
diffusion through partially molten wet and dry silicate rocks. Earth Planet. Sci. Lett. 365, 51–62.
576
https://doi.org/10.1016/j.epsl.2012.12.037
577
Boschi, C., Dini, A., Früh-Green, G.L., Kelley, D.S., 2008. Isotopic and element exchange during
578
serpentinization and metasomatism at the Atlantis Massif (MAR 30°N): Insights from B and Sr
579
isotope data. Geochim. Cosmochim. Acta 72, 1801–1823.
580
https://doi.org/10.1016/j.gca.2008.01.013
581
Bougault, H., Dmitriev, L., Schilling, J.G., Sobolev, A., Joron, J.L., Needham, H.D., 1988. Mantle
27–36. https://doi.org/10.1016/0012-821X(88)90043-X
584
Bucholz, C.E., Jagoutz, O., VanTongeren, J.A., Setera, J., Wang, Z., 2017. Oxygen isotope trajectories
585
of crystallizing melts: Insights from modeling and the plutonic record. Geochim. Cosmochim.
586
Acta 207, 154–184. https://doi.org/10.1016/j.gca.2017.03.027
587
Chen, Y., Provost, A., Schiano, P., Cluzel, N., 2013. Magma ascent rate and initial water
588
concentration inferred from diffusive water loss from olivine-hosted melt inclusions. Contrib. to
589
Mineral. Petrol. 165, 525–541. https://doi.org/10.1007/s00410-012-0821-x
590
Cottrell, E., Spiegelman, M., Langmuir, C.H., 2002. Consequences of diffusive reequilibration for the
591
interpretation of melt inclusions. New York 3.
592
Danyushevsky, L. V., Della-Pasqua, F.N., Sokolov, S., 2000a. Re-equilibration of melt inclusions
593
trapped by magnesian olivine phenocrysts from subduction-related magmas: Petrological
594
implications. Contrib. to Mineral. Petrol. 138, 68–83. https://doi.org/10.1007/PL00007664
595
Danyushevsky, L. V., Eggins, S.M., Falloon, T.J., Christie, D.M., 2000b. H2O abundance in depleted 596
to moderately enriched mid-ocean ridge magmas; Part I: Incompatible behaviour, implications
597
for mantle storage, and origin of regional variations. J. Petrol. 41, 1329–1364.
598
https://doi.org/10.1093/petrology/41.8.1329
599
Danyushevsky, L. V., Leslie, R.A.J., Crawford, A.J., Durance, P., 2004. Melt inclusions in primitive
600
olivine phenocrysts: The role of localized reaction processes in the origin of anomalous
601
compositions. J. Petrol. https://doi.org/10.1093/petrology/egh080
602
Danyushevsky, L. V., Plechov, P., 2011. Petrolog3: Integrated software for modeling crystallization
603
processes. Geochemistry, Geophys. Geosystems 12. https://doi.org/10.1029/2011GC003516
604
Dohmen, R., Chakraborty, S., Becker, H.-W., 2002. Si and O diffusion in olivine and implications for
605
characterizing plastic flow in the mantle. Geophys. Res. Lett. 29, 2030.
606
https://doi.org/10.1029/2002GL015480
607
Dosso, L., Bougault, H., 1986. A hot spot at 14 N on the Mid-Atlantic Ridge: Isotopic (Sr, Nd) and
608
trace element data. Eos Trans. AGU 67, 410.
Eiler, J.M., 2001. Oxygen Isotope Variations of Basaltic Lavas and Upper Mantle Rocks. Rev.
610
Mineral. Geochemistry 43, 319–364. https://doi.org/10.2138/gsrmg.43.1.319
611
Eiler, J.M., Schiano, P., Kitchen, N., Stolper, E.M., 2000. Oxygen-isotope evidence for recycled crust
612
in the sources of mid-ocean-ridge basalts. Nature 403, 530–534.
613
Faure, F., Schiano, P., 2005. Experimental investigation of equilibration conditions during forsterite
614
growth and melt inclusion formation. Earth Planet. Sci. Lett. 236, 882–898.
615
https://doi.org/10.1016/j.epsl.2005.04.050
616
Frey, F.A., Walker, N., Stakes, D., Hart, S.R., Nielsen, R., 1993. Geochemical characteristics of
617
basaltic glasses from theamar andfamous axial valleys, Mid-Atlantic Ridge (36°–37°N):
618
Petrogenetic implications. Earth Planet. Sci. Lett. 115, 117–136.
https://doi.org/10.1016/0012-619
821X(93)90217-W
620
Gaetani, G. a., O’Leary, J. a., Shimizu, N., Bucholz, C.E., Newville, M., 2012. Rapid reequilibration
621
of H2O and oxygen fugacity in olivine-hosted melt inclusions. Geology 40, 915–918. 622
https://doi.org/10.1130/G32992.1
623
Gale, A., Dalton, C.A., Langmuir, C.H., Su, Y., Schilling, J.-G., Dalton, C.A., Langmuir, C.H., Su, Y.,
624
Schilling, J., 2013. The mean composition of ocean ridge basalts. Geochem. Geophys. Geosyst
625
14, 489–518. https://doi.org/10.1029/2012GC004334
626
Garcia, M.O., Ito, E.M.I., Eiler, J.M., Pietruszka, A.J., 1998. Crustal Contamination of Kilauea
627
Volcano Magmas Revealed by Oxygen Isotope Analyses of Glass and Olivine from Puu Oo
628
Eruption Lavas 39, 803–817.
629
Genske, F.S., Beier, C., Haase, K.M., Turner, S.P., Krumm, S., Brandl, P.A., 2013. Oxygen isotopes
630
in the Azores islands: Crustal assimilation recorded in olivine. Geology 41, 491–494.
631
https://doi.org/10.1130/G33911.1
632
Gurenko, A.A., Bindeman, I.N., Chaussidon, M., 2011. Oxygen isotope heterogeneity of the mantle
633
beneath the Canary Islands: insights from olivine phenocrysts. Contrib. to Mineral. Petrol. 162,
Gurenko, A.A., Chaussidon, M., 2002. Oxygen isotope variations in primitive tholeiites of Iceland :
636
evidence from a SIMS study of glass inclusions , olivine phenocrysts and pillow rim glasses.
637
Earth Planet. Sci. Lett. 205, 63–79.
638
Gurenko, A.A., Chaussidon, M., 1997. Boron concentrations and isotopic composition of the Icelandic
639
mantle: evidence from glass inclusions in olivine. Chem. Geol. 135, 21–34.
640
Gurenko, A.A., Chaussidon, M., 1995. Enriched and depleted primitive melts included in olivine from
641
Icelandic tholeiites: origin by continuous melting of a single mantle column. Geochim.
642
Cosmochim. Acta 59, 2905–2917. https://doi.org/10.1016/0016-7037(95)00184-0
643
Harmon, R.S., Hoefs, J., 1995. Oxygen isotope heterogeneity of the mantle deduced from global 18O
644
systematics of basalts from different geotectonic settings. Contrib. to Mineral. Petrol. 95–114.
645
Hartley, M.E., Thordarson, T., Fitton, J.G., 2013a. Oxygen isotopes in melt inclusions and glasses
646
from the Askja volcanic system, North Iceland. Geochim. Cosmochim. Acta 123, 55–73.
647
https://doi.org/10.1016/j.gca.2013.09.008
648
Hartley, M.E., Thordarson, T., Fitton, J.G., 2013b. Oxygen isotopes in melt inclusions and glasses
649
from the Askja volcanic system, North Iceland. Geochim. Cosmochim. Acta 123, 55–73.
650
https://doi.org/10.1016/j.gca.2013.09.008
651
Hartley, M.E., Thordarson, T., Taylor, C., Fitton, J.G., EIMF, 2012. Evaluation of the effects of
652
composition on instrumental mass fractionation during SIMS oxygen isotope analyses of glasses.
653
Chem. Geol. 334, 312–323. https://doi.org/10.1016/j.chemgeo.2012.10.027
654
Helo, C., Longpré, M.A., Shimizu, N., Clague, D.A., Stix, J., 2011. Explosive eruptions at mid-ocean
655
ridges driven by CO 2-rich magmas. Nat. Geosci. 4, 260–263. https://doi.org/10.1038/ngeo1104
656
Hofmann, A.W., 1988. Chemical differentiation of the Earth : the relationship between mantle ,
657
continental crust , and oceanic crust 90, 297–314.
658
Jambon, A., Déruelle, B., Dreibus, G., Pineau, F., 1995. Chlorine and bromine abundance in MORB:
659
the contrasting behaviour of the Mid-Atlantic Ridge and East Pacific Rise and implications for
660
chlorine geodynamic cycle. Chem. Geol. 126, 101–117.
2541(95)00112-4
662
Javoy, M., Pineau, F., 1991. The volatiles record of a “popping” rock from the Mid-Atlantic Ridge at
663
14°N: chemical and isotopic composition of gas trapped in the vesicles. Earth Planet. Sci. Lett.
664
107, 598–611. https://doi.org/10.1016/0012-821X(91)90104-P
665
Jin, Z.-M., Green, H.W., Zhou, Y., 1994. Melt topology in partially molten mantle peridotite during
666
ductile deformation. Nature 372, 164.
667
Jochum, K.P., Stoll, B., Herwig, K., Willbold, M., Hofmann, A.W., Amini, M., Aarburg, S.,
668
Abouchami, W., Hellebrand, E., Mocek, B., Raczek, I., Stracke, A., Alard, O., Bouman, C.,
669
Becker, S., Dücking, M., Brätz, H., Klemd, R., de Bruin, D., Canil, D., Cornell, D., de Hoog,
C.-670
J., Dalpé, C., Danyushevsky, L., Eisenhauer, A., Gao, Y., Snow, J.E., Groschopf, N., Günther,
671
D., Latkoczy, C., Guillong, M., Hauri, E.H., Höfer, H.E., Lahaye, Y., Horz, K., Jacob, D.E.,
672
Kasemann, S.A., Kent, A.J.R., Ludwig, T., Zack, T., Mason, P.R.D., Meixner, A., Rosner, M.,
673
Misawa, K., Nash, B.P., Pfänder, J., Premo, W.R., Sun, W.D., Tiepolo, M., Vannucci, R.,
674
Vennemann, T., Wayne, D., Woodhead, J.D., 2006. MPI-DING reference glasses for in situ
675
microanalysis: New reference values for element concentrations and isotope ratios.
676
Geochemistry, Geophys. Geosystems 7, n/a-n/a. https://doi.org/10.1029/2005GC001060
677
Kamenetsky, V.S., Gurenko, A.A., 2007. Cryptic crustal contamination of MORB primitive melts
678
recorded in olivine-hosted glass and mineral inclusions. Contrib. to Mineral. Petrol. 153, 465–
679
481. https://doi.org/10.1007/s00410-006-0160-x
680
Kelley, K. a., Plank, T., Ludden, J., Staudigel, H., 2003. Composition of altered oceanic crust at ODP
681
Sites 801 and 1149. Geochemistry, Geophys. Geosystems 4, n/a-n/a.
682
https://doi.org/10.1029/2002GC000435
683
Kempton, P.D., Hawkesworth, C.J., Fowler, M., 1991. Geochemistry and isotopic composition of
684
gabbros from layer 3 of the Indian Ocean crust, Hole 735B. Proc., Sci. results, ODP, Leg 118,
685
Fract. Zo. Drill. Southwest Indian Ridge 127–143.
Kent, A.J.R., 2008. Melt Inclusions in Basaltic and Related Volcanic Rocks. Rev. Mineral.
688
Geochemistry 69, 273–331. https://doi.org/10.2138/rmg.2008.69.8
689
Kita, N.T., Ushikubo, T., Fu, B., Valley, J.W., 2009. High precision SIMS oxygen isotope analysis
690
and the effect of sample topography. Chem. Geol. 264, 43–57.
691
https://doi.org/10.1016/j.chemgeo.2009.02.012
692
Kyser, T.K., Lesher, C.E., Walker, D., 1998. The effects of liquid immiscibility and thermal diffusion
693
on oxygen isotopes in silicate liquids. Contrib. to Mineral. Petrol. 133, 373–381.
694
https://doi.org/10.1007/s004100050459
695
Laubier, M., Gale, A., Langmuir, C.H., 2012. Melting and crustal processes at the FAMOUS segment
696
(mid-atlantic ridge): New insights from olivine-hosted melt inclusions from multiple samples. J.
697
Petrol. 53, 665–698. https://doi.org/10.1093/petrology/egr075
698
Laubier, M., Schiano, P., Doucelance, R., Ottolini, L., Laporte, D., 2007. Olivine-hosted melt
699
inclusions and melting processes beneath the FAMOUS zone (Mid-Atlantic Ridge). Chem. Geol.
700
240, 129–150. https://doi.org/10.1016/j.chemgeo.2007.02.002
701
Lecuyer, C., Reynard, B., 1996. High-temperature alteration of oceanic gabbros by seawater (Hess
702
Deep, Ocean Drilling Program Leg 147): Evidence from oxygen isotopes and elemental fluxes. J.
703
Geophys. Res. 101, 15883–15897.
704
Lesher, C.E., 2010. Self-diffusion in Silicate Melts: Theory, Observations and Applications to
705
Magmatic Systems. Rev. Mineral. Geochemistry 72, 269–309.
706
https://doi.org/10.2138/rmg.2010.72.7
707
Lester, G.W., Kyser, T.K., Clark, A.H., 2013. Oxygen isotope partitioning between immiscible silicate
708
melts with H2O, P and S. Geochim. Cosmochim. Acta 109, 306–311. 709
https://doi.org/10.1016/j.gca.2013.01.037
710
Magenheim, A.J., Spivack, A.J., Michael, P.J., Gieskes, J.M., 1995. Chlorine stable isotope
711
composition of the oceanic crust: Implications for Earth’s distribution of chlorine. Earth Planet.
712
Sci. Lett. 131, 427–432. https://doi.org/10.1016/0012-821X(95)00017-7
Manzini, M., Bouvier, A.S., Baumgartner, L.P., Müntener, O., Rose-Koga, E.F., Schiano, P., Escrig,
714
S., Meibom, A., Shimizu, N., 2017. Weekly to monthly time scale of melt inclusion entrapment
715
prior to eruption recorded by phosphorus distribution in olivine from mid-ocean ridges. Geology
716
45, 1059–1062. https://doi.org/10.1130/G39463.1
717
Mattey, D., Lowry, D., Macpherson, C., 1994. Oxygen isotope compositions of mantle peridotite.
718
Earth Planet. Sci. Lett. 128, 231–241.
719
Matthews, A., Stolper, E.M., Eiler, Epstein, S., 1998. Oxygen isotope fractionation among melts,
720
minerals and rocks. Goldschmidt Conf. Toulouse 971–972.
721
McDonough, W.F., Sun, S. -s., 1995. The composition of the Earth. Chem. Geol. 120, 223–253.
722
https://doi.org/10.1016/0009-2541(94)00140-4
723
McKenzie, D.P., 1984. The generation and compaction of partial melts. J. Petrol. 25, 713–765.
724
https://doi.org/https://doi.org/10.1093/petrology/25.3.713
725
Moore, L.R., Gazel, E., Tuohy, R., Lloyd, A.S., Esposito, R., Steele-MacInnis, M., Hauri, E.H.,
726
Wallace, P.J., Plank, T., Bodnar, R.J., 2015. Bubbles matter: An assessment of the contribution
727
of vapor bubbles to melt inclusion volatile budgets. Am. Mineral. 100, 806–823.
728
Naumov, V.B., Dorofeeva, V.A., Girnis, A. V., Yarmolyuk, V. V., 2014. Comparison of major,
729
volatile, and trace element contents in the melts of mid-ocean ridges on the basis of data on
730
inclusions in minerals and quenched glasses of rocks. Geochemistry Int. 52, 347–364.
731
https://doi.org/10.1134/S0016702914050073
732
Nielsen, R.L., Sours-Page, R.E., Harpp, K.S., 2000. Role of a Cl-bearing flux in the origin of depleted
733
ocean floor magmas. Geochemistry, Geophys. Geosystems 1.
734
https://doi.org/10.1029/1999GC000017
735
Peres, P., Kita, N.T., Valley, J.W., Fernandes, F., Schuhmacher, M., 2013. New sample holder
736
geometry for high precision isotope analyses. Surf. Interface Anal. 45, 553–556.
737
https://doi.org/10.1002/sia.5061
exchange between melt inclusions in olivine and host magma. Earth Planet. Sci. Lett. 272, 541–
740
552. https://doi.org/10.1016/j.epsl.2008.05.020
741
Schiano, P., 2003. Primitive mantle magmas recorded as silicate melt inclusions in igneous minerals.
742
Earth-Science Rev. 63, 121–144. https://doi.org/10.1016/S0012-8252(03)00034-5
743
Schilling, J.G., Zajac, M., Evans, R., Johnston, T., White, W., Devine, J.D., Kingsley, R., 1983.
744
Petrologic and geochemical variations along the Mid-Atlantic Ridge from 29 degrees N to 73
745
degrees N. Am. J. Sci. 283, 510–586. https://doi.org/10.2475/ajs.283.6.510
746
Seitz, S., Baumgartner, L.P., Bouvier, A.S., Putlitz, B., Vennemann, T., 2017. Quartz Reference
747
Materials for Oxygen Isotope Analysis by SIMS. Geostand. Geoanalytical Res. 41, 69–75.
748
https://doi.org/10.1111/ggr.12133
749
Shimizu, N., 1998. The geochemistry of olivine-hosted melt inclusions in a FAMOUS basalt ALV
750
519-4-1. Phys. Earth Planet. Inter. 107, 183–201.
https://doi.org/10.1016/S0031-9201(97)00133-751
7
752
Sobolev, A. V., Shimizu, N., 1993. Ultra-depleted primary melt in an olivine fron the Mid-Atlantic
753
Ridge. Nature 363, 151–154.
754
Stakes, D.S., 1991. Oxygen and hydrogen isotope compositions of oceanic plutonic rocks:
High-755
temperature deformation and metamorphism of oceanic layer 3. Stable Isot. Geochemistry A
756
Tribut. to Samuel Epstein 77–90.
757
Tormey, D.R., Grove, T.L., Bryan, W.B., 1987. Experimental petrology of N-MORB near the Kane
758
Fracture Zone: 22-25°N, mid-Atlantic ridge. Contrib. Miner. Pet. 96, 121–139.
759
Van Orman, J.A., Grove, T.L., Shimizu, N., 2002. Diffusive fractionation of trace elements during
760
production and transport of melt in Earth’s upper mantle. Earth Planet. Sci. Lett. 198, 93–112.
761
https://doi.org/10.1016/S0012-821X(02)00492-2
762
Wallace, P., Carmichael, I.S.E., 1992. Sulfur in basaltic magmas. Geochim. Cosmochim. Acta 56,
763
1863–1874. https://doi.org/10.1016/0016-7037(92)90316-B