1 Selection of rainfall information as input data for the design of combined sewer overflow 1
solutions 2
Marie-Ève Jean* 3
[email protected], Eau Terre Environnement Research Centre, Institut National de 4
la recherche scientifique, 490 Couronne St, Québec, Canada, G1K 9A9 5
Sophie Duchesne 6
[email protected], Eau Terre Environnement Research Centre, Institut National de 7
la recherche scientifique, Québec, Canada 8
Geneviève Pelletier 9
[email protected], Department of Civil and Water Engineering, Laval 10
University, Québec, Canada, 11
Martin Pleau 12
[email protected], Tetra Tech CSO, Québec, Canada, 13
* Corresponding author 14
Declarations of interest: none 15
Abstract 16
Combined sewer overflows (CSOs) cause environmental problems and health risks, but poor 17
guidance exists on the use of rainfall data for sizing optimal CSO control solutions. This 18
study first reviews available types of rainfall information as input for CSO modelling and, 19
secondly, assesses the impacts of three rainfall data selection methods (continuous simulation, 20
historical rainstorms selected based on rainfall depth or maximum intensity and IDF-derived 21
storms) on the estimation of CSO volume thresholds to control in order to reach specific 22
seasonal CSO frequency targets. The methodology involves hydrological/hydraulic modelling 23
of an urban catchment in the Province of Québec (Canada). Continuous simulation provides 24
the most accurate volume estimations and shows high sensitivity to the number of simulated 25
*Revised Manuscript with no changes marked Click here to view linked References
2 years. Alternatively, when historical events extracted from rainfall data separated by a
26
minimum inter-event time(MIT) criterion are selected based on their total rainstorm depth, 27
the CSO volumes are underestimated significantly; whereas an analysis based on rainstorm 28
maximum intensities over durations similar to the time of concentration provides more 29
conservative volumes. Finally, synthetic storms constructed from multiple points of an IDF 30
curve tend to underestimate slightly the CSO volumes, but provide acceptable results 31
compared to single point derived storms. It was found that the overflow structures local 32
characteristics had a marginal influence on results obtained from continuous simulation 33
compared to event-based simulation. The use of design rainfall events should thus be 34
restricted to preliminary assessment of CSO volume thresholds, and the final volume 35
estimation for solution sizing should be reviewed under continuous simulation. The 36
innovative contribution lies in the improvement of modelling procedures for solutions design 37
to achieve a maximum CSO frequency,such as specified by many regulating agencies. 38
Keywords: Combined sewer overflow; Continuous simulation; Hydraulic modelling; IDF 39
curve; Rainfall data; Retention volume design; 40
1. Introduction 41
Sustainable stormwater management in urban areas is essential for water resources quality 42
and viability, municipal infrastructure cost- efficiency and community well-being. Around the 43
world, many urban areas are drained by combined sewer networks that collect and transport 44
both municipal wastewater and stormwater/ snowmelt runoff. During wet weather events or 45
thaw periods, the transport capacity of the system and the treatment capacity of the 46
wastewater facility may be exceeded; resulting in the discharge of untreated wastewater into 47
nearby receiving waters. This phenomenon is commonly described as combined sewer 48
overflows (CSO) and is associated with serious environmental problems and health risks 49
(Gooré Bi et al. 2015b, Madoux-Humery et al. 2015, Passerat et al. 2011). CSO impacts are 50
3 expected to worsen in the near future due to projected climate change as well as urban land 51
development (Alves et al. 2016, Semadeni-Davies et al. 2008, Yazdanfar and Sharma 2015). 52
In response to this problem, governments are prescribing regulations to limit the frequency, 53
volume and/or pollutant load of CSOs. For example, since 2014, all sewer extension projects 54
in the Province of Quebec (Canada), such as network densification or the addition of new 55
neighbourhoods in the upstream portions of existing systems, must demonstrate compensatory 56
actions to avoid increasing the annual frequency of sewage overflows (MDDELCC 2014), 57
according to Canada-wide Strategy for the Management of Municipal Wastewater Effluent 58
(CCME 2009). However, only little guidance exists on CSO analysis methods for optimal 59
selection and design of combined sewer solutions. Because CSO frequency, volume and 60
duration are closely linked to rainfall characteristics (Abdellatif et al. 2014, Andrés-61
Doménech et al. 2010, Mailhot et al. 2015, Montalto et al. 2007, Schroeder et al. 2011, 62
Thorndahl and Willems 2008, Yu et al. 2013), the determination of a robust method for the 63
selection of rainfall information as input data for CSO mitigation analysis is of particular 64
importance. 65
Previous studies analysing the impact of rainfall data on CSO management provide useful 66
information for evaluating possible rainfall input simplifications, estimating flooding risks or 67
comparing scenarios (Calabrò 2004, Fontanazza et al. 2011, Schütze et al. 2002, Thorndahl 68
and Willems 2008, Vaes et al. 2002, Vaes et al. 2001), but not for designing CSO mitigation 69
measures in particular. This work aims to improve modelling procedures for sizing CSO 70
solutions by focussing specifically on the impact of rainfall data on simulated CSO volume 71
thresholds. More specifically, in this paper, the term CSO volume threshold defines the CSO 72
volume that has to be controlled by CSO control solutions designed to achieve a specific 73
maximum annual or seasonal CSO frequency. The objective of this paper is thus twofold: 74
first, to complete an exhaustive review on available types of rainfall input for CSO modelling 75
4 and, second, to evaluate how the application of these different types of rainfall data in a 76
simulation model affects the estimation of CSO volume thresholds for the design of CSO 77
control solutions. To achieve the second objective, the methodology is tested on a real 78
combined sewer network. 79
2. Literature review 80
In the context of design of CSO control solutions, rainfall data can be divided in two main 81
types: continuous or event-based. Continuous data include chronological wet and dry periods 82
from long-term records whereas event-based data represent individual rainstorm events. 83
Single rainstorm (event-based data) can further be divided into synthetically derived storms or 84
events extracted from historical data. Finally, a fourth type of rainfall data can be derived 85
from a probabilistic modelling approach, in which rainfall data are analysed to identify 86
relationships between a critical rainfall depth threshold and CSO occurrence. The four types 87
of rainfall data, as well as examples of their application for CSO assessment, are subsequently 88
presented. 89
2.2 Continuous and quasi-continuous rainfall data 90
Continuous simulation of rainfall data consists in using a detailed chronological precipitation 91
record as input to a rainfall-runoff model. A frequency analysis of the resulting runoff output 92
can then be performed to describe the system response in terms of runoff occurrence and 93
magnitude (Akan and Houghtalen 2003). Considering that the majority of CSO events occur 94
for small, frequently occurring rainfall events and that antecedent conditions such as the soil 95
moisture or the amount of water already in the network can affect the performance of 96
stormwater retention solutions, several authors recommend the use of long-term continuous 97
98
2015, Nilsen et al. 2011, Shoemaker et al. 2011, USEPA 1993, Willems 2011). Quasi-99
continuous rainfall data described a sequence of seasonal rainfall records when the full annual 100
5 time series is either not available or when the seasonality in precipitation characteristics 101
impact CSO processes (for example if there is no rain during winter months). 102
Various modelling studies have applied continuous rainfall data to simulate CSO discharges 103
under baseline and climate change scenarios (Abdellatif et al. 2014, Abdellatif et al. 2015, 104
Dirckx et al. 2017, Nie et al. 2009, Nilsen et al. 2011, Semadeni-Davies et al. 2008); to 105
analyse stormwater control performance for CSO reductions (Dirckx et al. 2011, Lucas and 106
Sample 2015, Montalto et al. 2007, Tavakol-Davani 2016); to validate CSO solution designs 107
(Shoemaker et al. 2011); to address the impact of rainfall spatial variability on CSO volumes 108
(Verwom and Stuecken 2001); to evaluate combined sewer system performance under dry 109
and wet years (Nasrin et al. 2017); or to assess modelling performances for CSO impact 110
estimations (Ruan 1999, Vaes et al. 2001). It could be noted that whereas most studies 111
analysed CSO by comparing resulting volume, duration and/or frequency, the study of Ruan 112
(1999) also assessed water quality impacts of CSOs on receiving waters by evaluating model 113
simulation accuracies for estimating total suspended solids loads and concentrations. 114
2.3 Historical rainfall events 115
As an alternative to complete continuous simulation, some authors based their research work 116
on event-based simulation of historical rainfall events. Simulating independent rainstorm 117
events reduce the validity of the results if no attention is given to antecedent conditions. 118
Indeed, the cumulative impacts of successive rainfall events in terms of soil moisture, 119
pollutant load, storage levels, remaining capacity of existing stormwater control 120
infrastructures and other variables was found to exacerbate CSO impacts (Hvitved-Jacobsen 121
and Yousef 1988, Mailhot et al. 2015, Vaes et al. 2001). 122
Nevertheless, in terms of both water quantity (CSO peak flow and volume) and quality 123
analysis (CSO pollutant loads and concentrations), observed rainstorm events were previously 124
used as input to simulation models in order to i) assess the effectiveness of best management 125
6 practices (BMP) solutions for CSO control (Autixier et al. 2014); ii) assess the impact of 126
climate change by increasing rainfall intensities and comparing the resulting situation with the 127
baseline conditions (Gooré Bi et al. 2015b) also including an analysis of CSO 128
ecotoxicological risks; or iii) investigate relationships between rainfall variables of individual 129
storms and resulting CSOs (Gooré Bi et al. 2015a, Yu et al. 2013). 130
2.4 Synthetic rainfall events 131
Synthetic rainfall events, or design storms, have been extensively used in the scientific 132
literature as well as in practice for a large spectrum of urban drainage problems. Most 133
commonly used design storms are constructed directly from Intensity-Duration-Frequency 134
(IDF) curves. 135
The total rainfall depth of a synthetic event can be derived from one point of an IDF curve 136
and an arbitrary temporal profile is then applied to distribute the precipitation volume over 137
time. Simpler profiles include rectangular (uniform intensity over the storm duration), 138
triangular(Yen and Chow 1980) and double triangular (DGALN-CEREMA 2014). In the U.S, 139
the Soil Conservation Service distributions (SCS 1968) are four types of 24h-long storms 140
representative of different zones of the country (Types I, IA, II, and III). Other synthetic 141
design storms can also represent all intensity-duration values associated to a specific return 142
period such as the well-known Chicago storm (Keifer and Chu 1957). For most IDF derived 143
storms, the total duration of the storm has to be defined; which is generally greater than the 144
concentration time of the urban catchment or alternatively specified by regulatory agencies 145
(Rivard 1996). 146
Synthetic design storms can be developed by comparing long series of historical storms to 147
define typical temporal distribution of the rainfall. In Canada, common rainstorm profiles are 148
the AES storms of 1 h (convective storm) and 12 h (cyclonic storm) developed by the 149
Atmospheric Environment Service (Rousselle 1990) and the HYDROTEK 1 h 150
7 linear/exponential hyetographs of Watt et al. (1986), all derived from the same historical 151
rainfall dataset of Hogg (1980). In the U.S, Huff (1967) developed standardised rainstorms 152
from observed data by defining four types of rainfall distribution according to the timing of 153
the rainstorm peak relatively to the total rainstorm duration and their distribution probability. 154
Yen and Chow (1980) also analysed long series of observed storms and defined 155
dimensionless triangular hyetographs. 156
When the synthetic rainfall is derived from IDF curves, the probability of occurrence of the 157
resulting runoff associated with the synthetic storm is unknown, because IDF relationships are 158
determined from rainfall intensity maxima over a moving time window and does not represent 159
the entire storm event (USEPA 1993; Rivard 1996, Watt and Marsalek 2013). An added 160
uncertainty for the application of synthetic storms is the necessity for the modeller to define 161
some important variables of the rainfall event such as its duration. Finally, the non-linearity of 162
the resulting CSO volumes with rainfall depth could restrict the interpretation of the model 163
response for synthetic storms, because this interpretation implies some sort of linear response 164
between CSO processes and rainfall statistics (Dirckx et al. 2017, Vaes et al. 2001). 165
Previous studies have analysed the performances of BMP as potential solutions for CSO 166
control based on modelling work involving standard design storms of different return periods 167
(Chaosakul et al. 2013, Dong et al. 2017, Fuamba et al. 2010, Mailhot et al. 2014, Sebti et al. 168
2016, Villarreal et al. 2004). Also with the aim of evaluating CSO control measures, other 169
studies developed their own methodology to use available historical rainfall data to construct 170
synthetic rainfall events (Alves et al. 2016, Baek et al. 2015, Shoemaker et al. 2011). Finally, 171
in a more analytical perspective, several authors have simulated various design storms to 172
assess the impact of changing rainfall characteristics on drainage performances in terms of 173
water quantity (Fontanazza et al. 2011, Fu and Butler 2014, Thorndahl and Willems 2008, 174
8 Vaes et al. 2002), water quality (Calabrò 2004) or both quantitative and qualitative impacts 175
(Andrés-Doménech et al. 2010). 176
2.5 Rainfall depth threshold 177
Other research work has analysed long-term sequences of rainfall data to develop statistical 178
relationships between CSOs and rainfall event characteristics without hydrologic and 179
hydraulic modelling tools. Their methodology is based on the hypothesis that there is a 180
critical rainfall depth from which a CSO event has a higher probability of occurring than not 181
occurring (Mailhot et al. 2015). For example, Schroeder et al. (2011) evaluated the 182
effectiveness of certain CSO control measures, whereas Andrés-Doménech et al. (2011) and 183
Fortier and Mailhot (2014) assessed the impact of climate change on combined system 184
performances. 185
3. Material and methods 186
This section presents the methodology that was applied to achieve the second objective of this 187
study, namely evaluating how the use of different types of rainfall data impacts CSO volume 188
threshold estimations for CSO frequency reduction. 189
3.1 Study area 190
The case study is the combined sewer catchment of Thetford Mines, a medium-sized 191
municipality located in the southern part of the Province of Québec, Canada. The drainage 192
network, schematised in Fig. 1, has a catchment area of 401 ha and a concentration time of 193
about 3 h. Almost all the water entering the sewage system is carried by gravity with only one 194
pumping station connecting a small downstream sub-catchment to the rest of the network. The 195
capacity of the main interceptor is highly restricted by its small diameter and the maximum 196
capacity of the wastewater treatment plant (WWTP). There are a total of 30 overflow 197
structures discharging wastewater to either one of the two receiving rivers of the area. For this 198
municipality, the provincial legislation recommends a maximum of seven CSO spills per year 199
9 under wet weather conditions between May to November, considering that overflows are 200
recorded on a daily basis. The analysis was carried out for 10 of these 30 overflow structures 201
(identified in Fig. 1), because they often exceed the permitted occurrence and runoff control 202
solutions have not yet been implemented at these structures, as is the case for the remaining 203
structures. 204
[Fig. 1. Combined sewer network and selected CSO structures] 205
3.2 Historical CSO data 206
In the Province of Québec, CSO frequency and sometimes duration data are reported annually 207
to the Ministry of Municipal Affairs and Occupation of the Territory (MAMOT) for each 208
CSO overflow structures and WWTP stations. High uncertainty is attached to observed CSO 209
data. For the majority of the overflow structures monitored from 2006 to 2015, the occurrence 210
of CSOs is determined approximately on a weekly basis. A municipal employee visits the 211
overflows structures and indicates that at least one overflow as occurred since the last visit if a 212
visual floating device has been moved by the water from the manhole to the overflow pipe. 213
Among all the CSO structures in the study catchment, only the one at the WWTP has been 214
historically recorded on a daily basis by automated devices. All the others have been recorded 215
by intermittent weekly visits. The total volume of CSOs is not monitored on this network. 216
3.3 Hydrologic/hydraulic model 217
The research methodology is based on the modelling of hydrologic and hydraulic processes 218
using PCSWMM software (CHI 2016) derived from EPASWMM (Rossman and Huber 219
2016). The case-study network has about 1 360 links and 1 310 nodes, totalizing 78 000 m of 220
conduits length. The sub-catchments average slope is 2.8 % and total impervious area is about 221
32%. The low imperviousness is due to the success of a municipality wide gutter 222
disconnection campaign and the number of pseudo and separated sub-catchment areas. The 223
model was developed and calibrated for wet weather and dry weather events measured in 224
10 2006 and 2009 by the consulting engineering firm Tetra Tech CSO (formally BPR CSO) 225
based in Québec City, Canada (Marcoux et al. 2011 ). For wet weather flows calibration, the 226
directly connected impervious areas of the combined sewer sub-catchments, as well as the 227
characteristic width of overland flow, the sub-catchment superficies and initial rainfall 228
abstraction depths for both combined and separate sewer sub-catchments were adjusted using 229
three to four distinct rainfall events. Calibration criteria were based on James (2003): 1) ± 20 230
% for runoff volumes, 2) ± 15 % for peak flows, 3) ± 10 min for peak flow synchronism, and 231
4) ± 0.10 m for measured water levels. The RDII unit hydrograph method (Rossman and 232
Huber 2016) was utilized to account for rainfall dependent inflow and infiltration into the 233
combined sewers. In the case of dry weather inflows, a constant infiltration flow was added 234
upstream of each overflow structure (Marcoux et al. 2011). Similarly, domestic wastewater 235
flows were simulated based on hourly fluctuation patterns determined at each measurement 236
point during the calibration campaigns. 237
To estimate the volume of CSO per event, the simulated overflow volume time series for each 238
structure was extracted from the modelling outputs. If an event started earlier than midnight 239
and extended over the following day, it was compiled as two CSO events to mimic historical 240
CSO recording procedure. 241
3.4 Rainfall data 242
Three rain gauge stations have been operated by the municipality since 2004. At these 243
stations, the rainfall data measured by a tipping bucket are recorded every 5 min and were 244
validated by comparing the records with those of a station operated by Environment Canada 245
and located about 4 km from the studied catchment. Years 2004, 2005 and 2010 were rejected 246
from the analysis due to missing data or invalidated total seasonal rainfall depth, which leads 247
to a total of nine years of rainfall data (2006-2009 and 2011-2015). For each of these years, 248
the analyses were performed from May to November, since winter months are excluded from 249
11 Quebec legislation limiting CSO occurrence. Therefore, the available precipitation data are 250
considered as a quasi-continuous rainfall record, which should permit to represent with 251
enough accuracy historical conditions leading to CSOs in the study catchment. 252
The model validation for CSO frequency estimations was done using the quasi-continuously 253
recorded data from the three rain gauges for more accurate spatial representation of historical 254
rainfall conditions. However, the following study results are based on only one rain gauge 255
(see Fig. 1 for location), because the impact of changing the rainfall data input on CSO 256
volume estimations for CSO control is better isolated by assuming that the rain is uniformly 257
distributed over the whole study area. Over the study period, seasonal (May to November) 258
rainfall depths at this location ranged from 730 to 960 mm. 259
3.5 Rainfall data selection methods compared for retention volume design 260
The impact of applying different rainfall inputs on CSO volume thresholds determination for 261
CSO control was evaluated to achieve a specific maximum number of CSOs per year. This 262
frequency performance goal is selected rather than water quality objectives or percentage of 263
capture in order to be consistent with the current legislation applicable in the Province of 264
Québec. The following paragraphs describe three rainfall data selection methods, one of 265
which has two variants. 266
3.5.1 1st method: Quasi-continuous simulation 267
The first method analysed consisted of applying quasi-continuous simulation of available 268
sequence of seasonal rainfall data. A frequency analysis of simulated CSO time series 269
permitted to determine the seventh maximum CSO volume from each simulated year 270
separately. Subsequently, the maximum value among all years was selected in order to obtain 271
the CSO volume threshold for the design of retention solutions to ensure a maximum of seven 272
spills per year. 273
An assessment of the sensitivity of the results to the number of years taken into account in the 274
12 analysis was also realized. The aim was to evaluate how the inter-annual variability of rainfall 275
conditions could influence CSO volume thresholds for CSO management, when only a few 276
years of data are available for the analysis. All combinations of years were tested for all the 277
possible simulation lengths ranging from one to nine years (corresponding to the whole 278
available data for this case study). 279
3.5.2 2nd method: Historical rainstorm events based on a) total depth and b) maximum 280
intensity 281
The second method assessed the impact of applying event-based simulation by extracting 282
particular rainstorms from the historical rainfall records. This type of rainfall data analysis 283
was performed, because some engineers use this method or an equivalent as it requires less 284
computational effort than complete continuous simulation. 285
The method consists in separating the available rainfall record into distinct events. Several 286
event separation methods exist based on rainfall intensity, statistical properties, duration 287
percentage or set dry period criteria in order to extract from the continuous rainfall data 288
individual rainstorm events (Powell et al. 2007). The most common and simple one consists 289
in determining each event bounded by fixed rain-free intervals of minimal duration, usually 290
referred to as the minimum inter-event time (MIT). The selected MIT criterion requires to be 291
identified according to the simulation objective as it has been proved to have a large impact 292
on the resulting rainstorm event characteristics (Dunkerley 2008). The Quebec government 293
suggests a MIT of 6 h to separate meteorological events from one another (MDDEP 2010) but 294
recommend an emptying time for retention structures of 24 h. Therefore, to cover a broad 295
range of design criteria, the impact of selecting 3, 6, 12 and 24 h MIT values on rainstorm 296
event separation and CSO volume assessment was analysed. Table 1 presents the main 297
characteristics of the rainfall events for each MIT criterion. 298
Table 1. Mean rainfall event characteristics for MIT=3, 6, 12 and 24 h 299
13 Minimum inter-event time (MIT) (h) Mean number of rainfall events per year [May-November] Mean rainfall event depth (mm) Mean rainfall event intensity (mm/h) Mean maximum rainfall intensity during 5 min (mm/h) Mean rainfall duration (h) Mean dry inter-event duration (h) 3 142 6 2.5 9.9 3.9 32.1 6 105 8 2.2 11.8 6.8 41.5 12 75 11 1.7 14.0 13.0 54.8 24 53 16 1.3 16.9 25.4 70.5 300
The design rainstorms were then selected among the MIT-separated series by frequency 301
analysis based on two event selection criteria: a) the total rainstorm depth; and b) rainfall 302
maximum intensities over various durations as described below. 303
For historical rainstorms selected based on total rainfall depth, a frequency analysis was 304
conducted on the four MIT-separated rainfall time series to determine the seventh largest 305
rainstorms, in terms of total precipitation depth, for every year. Among the selected events, 306
the rainstorm having the maximum total depth was considered as the design rainfall event to 307
achieve the CSO frequency target. The hypothesis was that CSO events behave linearly with 308
rainfall depth. Other authors also linked rainfall depth with CSO volume based on linear 309
regression analysis of simulated CSO and rainfall data (Alves et al. 2016, Baek et al. 2015). 310
Moreover, similarly to this assessed rainfall selection method, Shoemaker et al. (2011) 311
identified a design storm for CSO solutions sizing by determining from a one-year rainfall 312
record the two-month return period historical storm based on total rainfall depth separated by 313
a 12 h inter-event spacing. Their study was applied to quantify the storage capacity required 314
to achieve a maximum number of six CSO events per year in a combined sewer network of 315
Kansas City (USA). 316
For historical rainstorms selected on maximum intensity, a frequency analysis was done on 317
the same four MIT-separated rainfall series to identify the rainstorms having the maximum 318
14 rainfall intensity (Imax) over durations of 30, 60, 120 and 180 min. Several duration values 319
were analysed to evaluate how the CSO volumes varied according to a range of rainfall 320
intensities. The aim is to compare historical rainstorms not only in terms of rainfall depth (as 321
it was done previously) but in terms of sustained intensities. The added value of this method 322
is to avoid selecting a rainfall event having a large total rainfall depth over a long duration, 323
which would result in low average rainfall intensity and might not have the same impact on 324
CSO as a more compact rainfall event. The rainfall event series was ordered to determine the 325
maximum annual seventh rainstorms in terms of Imax for each duration. Among those 326
seventh rainstorms for all years in the analysis, the one having the maximum Imax was 327
selected as the design rainstorm, for each duration. As a comparison, Mailhot et al. (2015) 328
used daily maximum rainfall values of 5 min to 12 h durations to establish a predictive 329
threshold model associating observed rainfall depth over these durations and CSO occurrence 330
probability. However, because their model describes the CSO probability for the actual 331
conditions of the system, it does not permit to further determine CSO volume thresholds for 332
reducing CSO frequency to specified targets. Sandoval et al. (2013) empirical study also 333
analysed the link between CSO and rainfall maximum intensities and found that it was the 334
most influent driver of CSO quantity at the main CSO outlet of the city of Berlin (Germany). 335
3.5.3 3rd method: IDF derived storms 336
Finally, the third method is based on IDF relationships, which is representative of current 337
practice in the industry. The method consists in determining rainfall intensity values for 338
frequent events over various durations, as opposed to mostly available IDF curves developed 339
for long return periods (2-100 years). The intensity values are identified by selecting the 340
maximum rainfall intensity that has occurred for various windows of time (5, 10, 15, 30, 60, 341
120, 360, 720 and 1440 min) for each day of the rainfall record such as suggested by 342
(MDDELCC 2017). A frequency analysis is then performed for each duration to determine 343
15 the rainfall intensities having a return period of seven times per season from May to
344
November (or once a month) by selecting the 63th value of the ordered series (7 times/season 345
x 9 seasons). 346
The identified rainfall intensities for the nine assessed durations (5 to 1440 min) are used to 347
derive an IDF regression curve of a return period of seven times per season. Based on the 348
fitted IDF parameters, Chicago hyetographs are developed with a symmetrical centred peak 349
and for three storm durations: 1 h, 3 h and 6 h. Symmetrical Chicago storms were applied 350
rather than unsymmetrical storms as the goal of this study is to assess conceptually how 351
various types of widely applied design storms impact the simulated results in a solution 352
design perspective. A time step of 10 min is considered as suggested by the literature to avoid 353
excessive rainfall intensity (Rivard 2005). 354
In addition to the Chicago storms, other 1 h and 3h-synthetic hyetographs were further 355
applied to a single IDF value as currently done in urban infrastructure design. For these 356
synthetic hyetographs, the total rainfall depth was determined by using the rainfall intensity 357
associated with a duration of one hour and a return period of seven times per season. The total 358
rainfall depth is then distributed according to standard hyetograph shapes available in the 359
literature for the case study location: 1) Hydrotek (Rousselle et al. 1990), 2) AES type 2 360
(Rousselle et al. 1990), and 3) uniform distribution (rectangular). It could be noted that the 361
Hydrotek and AES storms are unsymmetrical. The aim was to assess the impact on retention 362
volumes of using synthetic storms constructed from multiple IDF points (Chicago storms) and 363
single IDF point (synthetic hyetographs). 364
4. Results and discussion 365
4.1 Simulated versus observed data 366
Simulated CSO events were compared to observed data in order to assess the model accuracy. 367
As proposed by Jolliffe and Stephenson (2012), the proportion of correct estimation of a 368
16 binary event is evaluated (occurrence or non-occurrence of a CSO). This type of analysis 369
permits to highlight false positives (number of weeks/days for which a CSO event is 370
simulated when no CSO was recorded) and false negatives (number of weeks/days for which 371
no CSO is simulated when a CSO event has been observed) from true estimations (number of 372
weeks/days for which simulated results correspond to observed ones). Fig. 2 presents the 373
results, where true overflow estimations are summed up for each structure and each year to 374
compare the proportion of correct values. Lower proportion of correct estimation values are 375
usually associated with observed data having a high standard deviation, which means that the 376
inter-annual variability might be a result of other causes than rainfall variation such as CSO 377
monitoring deficiencies. For example, the years 2007 and 2011 present similar rainfall 378
characteristics in terms of rainfall events frequency and magnitude, but historical recorded 379
CSO events per overflow structure reach 25 on average for the year 2007 and only 11 for the 380
year 2011. As a consequence, the proportion of correct estimations for the years 2011 is much 381
lower, but should probably be associated to data recording deficiencies rather than modelling 382
inaccuracy. The best correlation between observed and simulated values were obtained for the 383
overflow structure associated with the WWTP which is the structure having the best historical 384
data available for comparison. It is believed that with more accurate observed data for the 385
other overflow structures (CSO event monitored at a daily basis rather than every week), a 386
better estimation of CSO frequency might also be obtained. The recent report of (Cliche and 387
Saladzius 2018) denoted a drastic increase in CSO frequencies in 2016 compared to the years 388
2014 and 2015 for the same municipality as our case study. The installation of daily 389
monitoring equipment in 2015 (Personal communication with municipal engineer, 2016) 390
probably explains the increase in overflow events reported by Cliche and Saladzius (2018) 391
and could lead to a better comparison of historical and simulated CSO in the future. 392
Therefore, considering the high uncertainty attached to observed data and the hydrological 393
17 and hydraulic calibration performed for wet and dry periods (see section 3.3), the model is 394
considered adequate to simulate CSO events. 395
[Fig. 2. Mean of correctly simulated CSO events for selected overflow structures and the 396
WWTP. Note: The error bars show the annual maximum and minimum percentage of correct 397
estimations. The dashed line shows the average annual proportion of correct estimations for 398
the 10 selected overflow structures.] 399
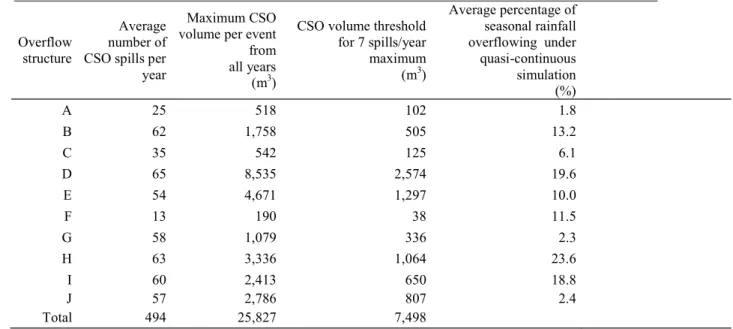
4.2 Quasi-continuous simulation 400
Time series of CSO events based on simulation of a sequence of continuous seasonal rainfall 401
data capture the spatial heterogeneity of the system under various rainfall conditions. Table 2 402
presents the average number of CSO spills per year and their associated maximum CSO 403
volumes and average seasonal percentage of rainfall overflowing, which vary considerably 404
from one structure to another. As shown, there is a high gap between simulated numbers of 405
CSOs and the target value of seven CSOs per year as prescribed by the regulations applicable 406
for the case study. Indeed, this network is highly restricted in the volume of wet weather flow 407
that could be effectively transported in the main interceptor. Applying quasi-continuous 408
simulation allows determining a specific CSO volume threshold for each sub-section of the 409
catchment, because the CSO frequency analysis is conducted separately for each structure. 410
Indeed, most of the time the causing rainfall event of the determined CSO volume threshold 411
for each overflow structure is not the same rainfall event. The calculated CSO volume 412
thresholds determined for a maximum number of seven CSO spills per year per overflow 413
structure are presented in Table 2 and are considered as reference values for comparison with 414
the following rainfall selection methods. 415
The application of a longer dataset would better account for extreme values. However, 416
considering that continuous simulation of seasonal rainfall records includes a broad variety of 417
antecedent conditions and rainstorm characteristics, it is believed that this method provides 418
18 adequate CSO volume estimations for the design of solutions achieving specific CSO control 419
targets. Similarly, Vaes et al. (2001) found that most adequate results for CSO assessment 420
were obtained from simplified conceptual models in combination with continuous long term 421
simulations. 422
Table 2. CSO modelling results under quasi-continuous simulation 423
Overflow structure
Average number of CSO spills per year
Maximum CSO volume per event from all years (m3)
CSO volume threshold for 7 spills/year maximum (m3) Average percentage of seasonal rainfall overflowing under quasi-continuous simulation (%) A 25 518 102 1.8 B 62 1,758 505 13.2 C 35 542 125 6.1 D 65 8,535 2,574 19.6 E 54 4,671 1,297 10.0 F 13 190 38 11.5 G 58 1,079 336 2.3 H 63 3,336 1,064 23.6 I 60 2,413 650 18.8 J 57 2,786 807 2.4 Total 494 25,827 7,498 424
The impact of using a few years for the analysis of CSO under quasi-continuous simulation 425
was assessed by simulating all possible combination of years among the available nine years 426
of seasonal data for one to nine years-long simulation length. Fig. 3 shows the median values 427
of the total CSO volume thresholds estimated for the ten structures to achieve the CSO 428
control objective (i.e. maximum of 7 spills per season). Logically, with a larger sample of 429
years used as input data, the rainfall inter-seasonal variability is greater. As a consequence, 430
the determined volume should be greater by accounting for more extreme CSO events. 431
Median values can vary from about 6,500 to 7,500 m3. Data dispersion is illustrated through 432
error bars which decrease according to the number of years simulated. More specifically, if 433
only one year is simulated among the nine years available, the volume design could be 434
considerably underestimated as the smallest CSO volume threshold could equal 4,900 m3; a 435
19 difference of 35% with the largest value obtained from the simulation of all the available 436
years. 437
Another important point raised by this sensitivity analysis, is the difficulty to determine which 438
year(s) should be simulated among the available data. For example, two selection criteria 439
were applied to the available series to determine which year would most likely produce the 440
greatest CSO volumes. Fig. 4 presents CSO volume thresholds for each structure based on the 441
simulation of the wettest year (2011), as well as the year having the most frequent large 442
mm) rainfall events (2015). In Fig. 4, the CSO volumes obtained are also compared with the 443
results from continuous simulation of seasonal rainfall records and other rainfall selection 444
methods. As shown, the selection of the year having the most frequent large rainfall events 445
provide a more conservative estimation of CSO volume threshold for solution design, because 446
those events are more likely to produce important overflow volumes. Nevertheless, the added 447
value of continuous simulation can only be fully considered when all available data are taken 448
into account rather than reducing the analysis to a single year, because it guaranties obtaining 449
the critical CSO volume for each overflow structure individually among the simulated years. 450
[Fig. 3. Sensitivity to the number of years simulated of the total CSO volume thresholds 451
estimated for the ten overflow structures] 452
[Fig. 4. Comparison of rainfall data selection methods for determining CSO volume 453
thresholds from simulation] 454
4.3 Historical rainstorm events 455
Simulation of specific historical rainfall events was performed using the total rainfall depth 456
per event, and then the Imax over 30, 60, 120 and 180 min from the MIT-separated rainfall 457
series. 458
20 4.3.1 Historical rainstorms selected based on total rainfall depth
459
Since four MIT criteria were applied (3, 6, 12 and 24 h) to the rainfall record in order to 460
extract individual rainstorm events, four rainfalls were identified as design storms. Fig. 4 461
presents the simulated CSO volumes for each structure under the four rainfall events, along 462
with a comparison with quasi-continuous simulation results and other rainfall selection 463
methods. Except for the value of 24 h, simulation of the maximum annual seventh greatest 464
rainstorm in terms of total rainfall depth underestimated the CSO volumes as compared to 465
quasi-continuous simulation. Even if the simulated rainstorms are characterized by a high 466
total rainfall depth, their extended duration resulted in much lower average rainfall intensities 467
and CSO spilled volumes. For a better assessment of resulting CSO volumes, Fig. 5 presents 468
the rainfall depth and total CSO volumes for the seventh greatest events determined for each 469
year separately. All these rainstorms are characterized by a large total rainfall depth but have 470
varying durations and average rainfall intensities. As illustrated, similar rainstorms in terms of 471
total rainfall depth led to highly variable CSO volumes. Results showed no linear relationship 472
between total rainfall depths and CSO volumes, explaining partly why results presented in 473
Fig. 4 are considerably below the ones estimated from quasi-continuous simulation. 474
Yu et al. (2013) also found that moderate rainstorms, in terms of rainfall total depth, have 475
poor correlation with CSO occurrence. According to these authors, rainstorms of high and 476
low depths better correlate with CSO occurrence or non-occurrence, respectively, based on 477
the analysis of 117 rainfall events extracted from a one year long record in Tokyo (Japan). 478
Similarly, Gooré Bi et al. (2015a) observed high correlations between rainstorm total depth 479
and CSO event pollutant load by analysing the correlation between rainfall variables and 480
water quality indicators monitored during CSO events. 481
21 4.3.2 Historical rainstorms selected based on rainfall maximum intensity
482
The four MIT-separated rainstorms series were then used for design rainfall event selection 483
based on Imax over 30, 60, 120 and 180 min. Fig. 4 presents the simulated CSO volumes for 484
all the seventh greatest rainstorms for various Imax durations and MIT values. However, 485
because the same critical events were identified for both MIT=3h and 6h, only the results 486
obtained from the MIT=3h series are presented in order to avoid redundancy. As shown, 487
estimated CSO threshold volumes are either higher or lower than the volumes determined by 488
continuous simulation of seasonal rainfall records. Schütze et al. (2002) indicated that 489
information on CSO frequency from event-based simulation may be highly inaccurate for 490
non-linear systems, which seems the case here. 491
As a consequence of the disputable linearity between CSO volume and rainstorm total depth 492
or intensity, CSO volume threshold calculations based solely on the total depth or intensity of 493
rainfall events would not guarantee adequate volume estimations for design. 494
[Fig. 5.Total CSO volume thresholds for the ten overflow structures based on the annual 495
7th greatest rainstorms in terms of total rainfall depth and MIT=3, 6, 12, and 24h] 496
4.4 IDF derived storms 497
The last assessed method focussed on event-based simulation of synthetic design storms. The 498
analysis of daily maximum rainfall intensities record permitted to characterise IDF 499
relationships having an estimated recurrence of seven times per year. Cumulative rainfall 500
depths for the three Chicago storms are respectively 25.2, 30.1 and 33.6 mm. For the other 501
tested standardised hyetographs, a cumulative rainfall depth of 10.5 mm was applied for the 1 502
h-duration and 19.0 mm for the 3h-duration, both determined by frequency analysis for a 503
return period of 1/month. 504
Fig. 4 presents the resulting CSO volumes, compared to those obtained from other rainfall 505
selection methods. The event-based results were slightly lower than the CSO volumes 506
22 determined by quasi-continuous simulation in the case of Chicago storms of 3 or 6 hours-507
duration; whereas single IDF value derived storms noticeably underestimated CSO volume 508
thresholds. Single 1h-IDF value derived storms all had a different time distribution of the rain, 509
but led to similar simulated CSO volumes, even in the case of a uniform rainstorm. Even if 510
the uniform 3h-storm has the same duration as the time of concentration of the catchment, it 511
still underestimated the total CSO volume compared to quasi-continuous simulation. When 512
simulating single events, the results show that the total volume of the design storm has an 513
impact on the resulting CSO volumes whereas the hyetograph shape has almost none. 514
Differences in volume obtained from synthetic events compared with quasi-continuous 515
simulation can be explained partly by the uncertainty associated with the application of IDF 516
derived design storms. Drawbacks of applying design storms for CSO control design include 517
the necessity to decide on the duration of the simulated event and its return period (Watt and 518
Marsalek 2013). 519
For comparison, Calabrò (2004) denoted that applying Chicago and triangular shape storms 520
having durations similar to the time of concentration of the catchments, resulted in higher 521
overflow discharges to receiving water bodies compared to rectangular storms and longer 522
storms. On the other hand, Vaes et al. (2001) specifically indicated that the non-linearity of 523
the system response (when the outflows are not directly linked to the storage capacity of the 524
catchment) increased for design storms having a high recurrence compared to lower 525
recurrence ones, thus limiting application of design storms for CSO control. Guo (2001) 526
concluded that design storms provided simulation results generally close to continuous 527
simulation when sizing flood control detention ponds for the city of Chicago, Illinois. The 528
design criteria of his study was however based on large return periods (100 years), which is 529
quite different from our small return period criterion. Müller et al. (2017) found that rainfall 530
such as discharged volume, concluding on 531
23 the importance that synthetic time series should represent observed rainfall asymmetry. 532
4.5 Comparison of simulated results per overflow structures 533
The CSO volumes threshold simulated under the different rainfall data selection methods 534
compared previously were lastly analysed more thoroughly per overflow structure. The aim 535
was to evaluate if the local characteristics associated to each structure could have an influence 536
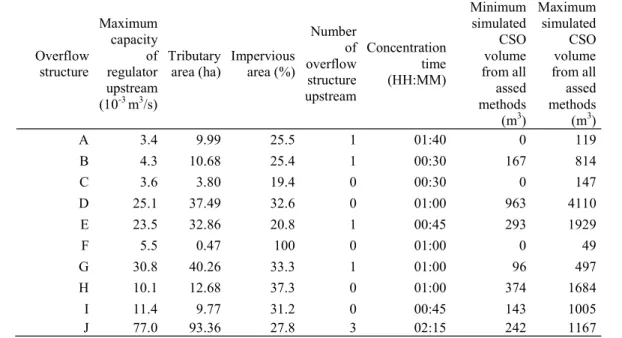
on the relative performance of one method compare to another. Table 3 provides local 537
characteristics of the ten assessed overflow structures as well as the minimum and maximum 538
simulated CSO volume threshold. As shown, larger tributary area or higher impervious area 539
coverage does not necessary lead to higher overflows in terms of maximum simulated 540
volumes by the assessed rainfall selection methods. The number of overflows structures 541
located upstream and the regulated maximum flowrate capacities seem to help in reducing 542
overflow volume. For example, structure J has the highest tributary area and a relatively high 543
imperviousness, but its maximum simulated overflow volume threshold is almost the same as 544
for overflow structure B, which is located at the outlet of a much lower area but has limited 545
regulation capacity. 546
Fig 6 shows for all overflows structures the percentage difference in simulated CSO volume 547
thresholds of each method with the results from quasi-continuous simulation. It could be seen 548
that the overflow structures B, D, E, G, H, I and J follow generally the same tendency, i.e. 549
have similar increasing or decreasing CSO volume trends for the same assessed method 550
whereas the overflow structures A, C and F are generally outliers. These three structures are 551
associated to the smallest overflow frequencies and volumes (see Table 2). Interestingly, the 552
remaining structures have local characteristics varying greatly but that did not seem to impact 553
much the general trends of the results. 554
Fig. 6 also permits to highlight that simulating a continuous record of just one season (the 555
wettest year or the year having the most frequent large rainfall events) provide an estimation 556
24 of critical CSO volume closer to those obtained under quasi-continuous simulation of the full 557
record of years available (% difference in volumes closer to zero) compared to event-based 558
simulation results and with and with almost no influence from the structures local 559
characteristics. All the remaining methods consisting of simulating one single historical or 560
synthetic rainfall event do perform not as well and the individual results for each overflow 561
structure are generally more widely distributed. Finally, by looking at the methods falling 562
between the ±25% marks indicated by dashed lines in Figure 6, it could be noticed that the 563
Chicago storms of 3 or 6 h as well as the historical rainstorms selected based on rainfall 564
maximum intensity over longer durations (180 minutes and sometimes 120 minutes) provide 565
more acceptable results than the remaining methods for a majority of the overflow structures. 566
Table 3. Local characteristics of overflow structures 567 Overflow structure Maximum capacity of regulator upstream (10-3 m3/s) Tributary
area (ha) Impervious area (%)
Number of overflow structure upstream Concentration time (HH:MM) Minimum simulated CSO volume from all assed methods (m3) Maximum simulated CSO volume from all assed methods (m3) A 3.4 9.99 25.5 1 01:40 0 119 B 4.3 10.68 25.4 1 00:30 167 814 C 3.6 3.80 19.4 0 00:30 0 147 D 25.1 37.49 32.6 0 01:00 963 4110 E 23.5 32.86 20.8 1 00:45 293 1929 F 5.5 0.47 100 0 01:00 0 49 G 30.8 40.26 33.3 1 01:00 96 497 H 10.1 12.68 37.3 0 01:00 374 1684 I 11.4 9.77 31.2 0 00:45 143 1005 J 77.0 93.36 27.8 3 02:15 242 1167 568
[Fig. 6. CSO volume thresholds difference of all rainfall selection methods with quasi-569
continuous simulation per overflow structures. Note: The dashed lines show the limits for a 570
volume difference of ± 25 %.] 571
25 5. Conclusion
572
This study addressed the knowledge gaps on the proper use of available rainfall data for 573
sizing CSO reduction solutions. Actual rainfall data selection methods for CSO analysis and 574
management were described and include continuous simulation, synthetic design storms, 575
historical rainfall events, and rainfall depth threshold. Thereafter, three rainfall data selection 576
methods for volume design of stormwater control solutions to comply with a specific 577
maximum annual CSO frequency were compared. 578
The first method was quasi-continuous simulation of the nine years of available seasonal 579
precipitation record, which permitted to obtain CSO volume threshold values for each 580
overflow structures separately. However, reducing the number of years in the analysis rapidly 581
impacted the estimated volumes due to the loss of inter-annual variability of rainfall data. 582
Alternatively, continuous simulation of the seasonal record of a single year having the most 583
frequent rainstorms exceeding a specific total rainfall depth can give a good approximation of 584
CSO volumes for solution design and without distinction of overflow structures local 585
characteristics. 586
For the second rainfall selection method, the design rainstorms were identified based on either 587
their total rainfall depth or their maximal rainfall intensity for durations of 30, 60, 120 or 180 588
min. CSO volume thresholds were obtained under event-based simulation of the selected 589
critical events. The high inter-events variability of the simulation results demonstrated the 590
non-linearity of CSO volumes with the rainfall event characteristics (total depth or maximum 591
intensities) and its disputable applicability as design criteria for CSO control. 592
Finally, simulated CSOs under Chicago storms derived from rainfall daily maxima resulted in 593
an underestimation of CSO volume thresholds. On the other hand, the simulation of other 594
standard synthetic storms (Hydrotek, AES type 2, and uniform 1 h storms) having a total 595
rainfall volume equivalent to a single IDF value underestimated more drastically the CSO 596
26 volumes. Under single event simulation for CSO control purpose, design storms involving 597
multiple IDF values such as Chicago storms should be prioritized. However, it is still difficult 598
to determine the best design storm duration as this factor could considerably affect the results. 599
Because CSO processes are site specific and sensitive to a variety of rainfall characteristics, it 600
is difficult to identify one design event that will ensure compliance with specific annual CSO 601
frequency for design guidelines. Therefore, it is recommended that the use of design rainfall 602
events should be restricted to preliminary assessment of CSO control measures, whereas the 603
final solution sizing should be reviewed under continuous simulation or quasi-continuous 604
simulation to ensure appropriate volume estimations. CSO analysis would definitely benefit 605
from larger rainfall datasets. Further work could focus on integrating CSO volume 606
calculations with solution type, location and operation on a river basin scale for refining CSO 607
control design. 608
Acknowledgments: The authors gratefully acknowledge the technical support of Christiane 609
Marcoux and Leni Trudel at Tetra Tech CSO as well as Daniel Cyr, chief of Engineering and 610
Environment in the municipality of Thetford Mines. This study was funded by research grants 611
from the Eau Terre Environnement Research Centre (Institut National de la recherche 612
scientifique) and from the Natural Sciences and Engineering Research Council of Canada. 613
The authors are grateful to Computational Hydraulics Int. for PCSWMM software license. 614
Figure captions: 615
Fig. 1. Combined sewer network and selected CSO structures 616
Fig. 2. Mean of correctly simulated CSO events for selected overflow structures and the 617
WWTP. Note: The error bars show the annual maximum and minimum percentage of correct 618
estimations. The dashed line shows the average annual proportion of correct estimations for 619
the 10 selected overflow structures. 620
27 Fig. 3. Sensitivity to the number of years simulated of the total CSO volume thresholds 621
estimated for the ten overflow structures 622
Fig. 4. Comparison of rainfall data selection methods for determining CSO volume thresholds 623
from simulation 624
Fig. 5. Total CSO volume thresholds for the ten overflow structures based on the annual 7th 625
greatest rainstorms in terms of total rainfall depth and MIT=3, 6, 12, and 24 h 626
Fig. 6. CSO volume thresholds difference of all rainfall selection methods with quasi-627
continuous simulation per overflow structures. Note: The dashed lines show the limits for a 628
volume difference of ± 25 %. 629
References 630
Abdellatif, M., Atherton, W. and Alkhaddar, R. (2014) Assessing combined sewer overflows 631
with long lead time for better surface water management. Environ Technol 35(5-8), 568-580. 632
Abdellatif, M., Atherton, W., Alkhaddar, R. and Osman, Y. (2015) Quantitative assessment of 633
sewer overflow performance with climate change in northwest England. Hydrological 634
Sciences Journal 60(4), 636-650. 635
Akan, A.O. and Houghtalen, R.J. (2003) Urban hydrology, hydraulics, and stormwater 636
quality: engineering applications and computer modeling, John Wiley & Sons, Hoboken, NJ. 637
Alves, A., Sanchez, A., Vojinovic, Z., Seyoum, S., Babel, M. and Brdjanovic, D. (2016) 638
Evolutionary and Holistic Assessment of Green-Grey Infrastructure for CSO Reduction. 639
Water 8(9), 402-417. 640
Andrés-Doménech, I., Montanari, A. and Marco, J. (2011) Efficiency of storm detention tanks 641
for urban drainage systems under climate variability. Journal of Water Resources Planning 642
and Management 138(1), 36-46. 643
28 Andrés-Doménech, I., Múnera, J., Francés, F. and Marco, J. (2010) Coupling urban event-644
based and catchment continuous modelling for combined sewer overflow river impact 645
assessment. Hydrology and Earth System Sciences 14(10), 2057-2072. 646
Autixier, L., Mailhot, A., Bolduc, S., Madoux-Humery, A.S., Galarneau, M., Prevost, M. and 647
Dorner, S. (2014) Evaluating rain gardens as a method to reduce the impact of sewer 648
overflows in sources of drinking water. Sci Total Environ 499, 238-247. 649
Baek, H., Ryu, J., Oh, J. and Kim, T.-H. (2015) Optimal design of multi-storage network for 650
combined sewer overflow management using a diversity-guided, cyclic-networking particle 651
swarm optimizer A case study in the Gunja subcatchment area, Korea. Expert Systems with 652
Applications 42(20), 6966-6975. 653
Calabrò, P.S. (2004) Design storms and water quality control. Journal of Hydrologic 654
Engineering 9(1), 28-34. 655
CCME (2009) Canada-wide strategy for the management of municipal wastewater effluent, 656
Canadian Council of Ministers of the Environment, Whitehorse, YT, Canada. 657
Chaosakul, T., Koottatep, T. and Irvine, K. (2013) Low Impact Development Modeling to 658
Assess Localized Flood Reduction in Thailand. Journal of Water Management Modeling. 659
CHI (2016) PCSWMM Version 6.2070, Computational Hydraulic International Toronto, 660
Ontario. 661
Cliche, G. and Saladzius, A. (2018) Évaluation de performance des ouvrages municipaux 662
Bassin versant du lac à la Trui 663
French). Fondation Rivières. 664
DGALN-CEREMA (2014) Conditions pluviométriques locales, Direction générale de 665
l'Aménagement,du Logement et de la Nature, Centre d'études et d'expertise sur les risques, 666
l'environnement, la mobilité et l'aménagement. 667
29 Dirckx, G., Korving, H., Bessembinder, J. and Weemaes, M. (2017) How climate proof is 668
real-time control with regard to combined sewer overflows? Urban Water Journal, 1-8. 669
Dirckx, G., Schütze, M., Kroll, S., Thoeye, C., De Gueldre, G. and Van De Steene, B. (2011) 670
Cost-efficiency of rtc for cso impact mitigation. Urban Water Journal 8(6), 367-377. 671
Dong, X., Guo, H. and Zeng, S. (2017) Enhancing future resilience in urban drainage system: 672
Green versus grey infrastructure. Water Res 124, 280-289. 673
Dunkerley, D. (2008) Identifying individual rain events from pluviograph records: a review 674
with analysis of data from an Australian dryland site. Hydrological Processes 22(26), 5024-675
5036. 676
Fontanazza, C., Freni, G., La Loggia, G. and Notaro, V. (2011) Uncertainty evaluation of 677
design rainfall for urban flood risk analysis. Water Science and Technology 63(11), 2641-678
2650. 679
Fortier, C. and Mailhot, A. (2014) Climate change impact on combined sewer overflows. 680
Journal of Water Resources Planning and Management 141(5), 04014073. 681
Fu, G. and Butler, D. (2014) Copula-based frequency analysis of overflow and flooding in 682
urban drainage systems. Journal of Hydrology 510, 49-58. 683
Fuamba, M., Walliser, T., Daynou, M., Rousselle, J. and Rivard, G. (2010) Vers une gestion 684
durable et intégrée des eaux pluviales : Une étude de cas pour le Québec. Canadian Journal of 685
Civil Engineering 37(2), 224-235. 686
Gooré Bi, E., Monette, F. and Gasperi, J. (2015a) Analysis of the influence of rainfall 687
variables on urban effluents concentrations and fluxes in wet weather. Journal of Hydrology 688
523, 320-332. 689
Gooré Bi, E.G., Monette, F., Gachon, P., Gasperi, J. and Perrodin, Y. (2015b) Quantitative 690
and qualitative assessment of the impact of climate change on a combined sewer overflow and 691
its receiving water body. Environ Sci Pollut Res Int 22(15), 11905-11921. 692
30 Guo, Y. (2001) Hydrologic design of urban flood control detention ponds. Journal of
693
Hydrologic Engineering 6(6), 472-479. 694
Hvitved-Jacobsen, T. and Yousef, Y.A. (1988) Analysis of rainfall series in the design of 695
urban drainage control systems. Water Res 22(4), 491-496. 696
James, W. (2003) Rules for Responsible Modeling, CHI Guelph, Canada. 697
Jolliffe, I.T. and Stephenson, D.B. (2012) Forecast Verification: A Practitioner's Guide in 698
Atmospheric Science. Second Edition, W.S. (ed), pp. 33 34, Chichester, U.K. . 699
Keifer, C.J. and Chu, H.H. (1957) Synthetic storm pattern for drainage design. Journal of the 700
hydraulics division 83(4), 1-25. 701
Lucas, W.C. and Sample, D.J. (2015) Reducing combined sewer overflows by using outlet 702
controls for Green Stormwater Infrastructure: Case study in Richmond, Virginia. Journal of 703
Hydrology 520, 473-488. 704
Madoux-Humery, A.S., Dorner, S.M., Sauve, S., Aboulfadl, K., Galarneau, M., Servais, P. 705
and Prevost, M. (2015) Temporal analysis of E. coli, TSS and wastewater micropollutant 706
loads from combined sewer overflows: implications for management. Environ Sci Process 707
Impacts 17(5), 965-974. 708
Mailhot, A., Bolduc, S., Talbot, G. and Khedhaouiria, D. (2014) Gestion des eaux pluviales et 709
changements climatiques: Version finale, INRS, Centre Eau Terre Environnement. 710
Mailhot, A., Talbot, G. and Lavallée, B. (2015) Relationships between rainfall and Combined 711
Sewer Overflow (CSO) occurrences. Journal of Hydrology 523, 602-609. 712
Marcoux, C., Bacon, S., Beaumont, G., Fortier, V., Laverdière, M., Nantel, È., Pugin, S. and 713
Tremblay, K. (2011 ) Ville de Thetford Mines. Mise aux Normes des Ouvrages 714
715
Canada 716
31 nt des 717
718
la Lutte contre les Changements Climatiques, <http://www.mddelcc.gouv.qc.ca/eau/eaux-719
usees/ouvrages-municipaux/position-ministere.htm> (Consulted 20.04.18) 720
MDDEL Statistiques intensité-durée-fréquence (IDF) des
721
pluies de grandes récurrences 1981-2010, Ministère du Développement Durable de 722
723
Québec, Québec, Canada. 724
Montalto, F., Behr, C., Alfredo, K., Wolf, M., Arye, M. and Walsh, M. (2007) Rapid 725
assessment of the cost-effectiveness of low impact development for CSO control. Landscape 726
and Urban Planning 82(3), 117-131. 727
Müller, T., Schütze, M. and Bárdossy, A. (2017) Temporal asymmetry in precipitation time 728
series and its influence on flow simulations in combined sewer systems. Advances in Water 729
Resources 107, 56-64. 730
Nasrin, T., Sharma, A.K. and Muttil, N. (2017) Impact of short duration intense rainfall 731
events on sanitary sewer network performance. Water 9(3), 225. 732
Nie, L., Lindholm, O., Lindholm, G. and Syversen, E. (2009) Impacts of climate change on 733
urban drainage systems a case study in Fredrikstad, Norway. Urban Water Journal 6(4), 734
323-332. 735
Nilsen, V., Lier, J.A., Bjerkholt, J.T. and Lindholm, O.G. (2011) Analysing urban floods and 736
combined sewer overflows in a changing climate. Journal of Water and Climate Change 2(4), 737
260-271. 738
Passerat, J., Ouattara, N.K., Mouchel, J.-M., Rocher, V. and Servais, P. (2011) Impact of an 739
intense combined sewer overflow event on the microbiological water quality of the Seine 740
River. Water Res 45(2), 893-903. 741
32 Powell, D.N., Khan, A.A., Aziz, N.M. and Raiford, J.P. (2007) Dimensionless rainfall
742
patterns for South Carolina. Journal of Hydrologic Engineering 12(1), 130-133. 743
Rivard, G. (2005) Gestion des eaux pluviales en milieu urbain: concepts et applications, 744
second Ed (in French). Alias communication design Inc., Québec, Canada, 329 p. 745
Rossman, L. and Huber, W. (2016) Storm Water Management Model Reference Manual 746
Volume I, Hydrology. US EPA Office of Research and Development (ed), Washington, DC. 747
Rousselle, J., Watt, W., Lathem, K., Neill, C. and Richards, T. (1990) Hydrologie des crues 748
au Canada: Guide de planification et de conception (in French). Conseil National de 749
Recherches Canada, Ottawa, 227. 750
Ruan, M. (1999) Continuous simulation of CSO emissions. Urban Water 1(3), 201-205. 751
Sandoval, S., Torres, A., Pawlowsky-Reusing, E., Riechel, M. and Caradot, N. (2013) The 752
evaluation of rainfall influence on combined sewer overflows characteristics: the Berlin case 753
study. Water Science and Technology 68(12), 2683-2690. 754
Schroeder, K., Riechel, M., Matzinger, A., Rouault, P., Sonnenberg, H., Pawlowsky-Reusing, 755
E. and Gnirss, R. (2011) Evaluation of effectiveness of combined sewer overflow control 756
measures by operational data. Water Science and Technology 63(2), 325-330. 757
Schütze, M., Willems, P. and Vaes, G. (2002) Global Solutions for Urban Drainage, pp. 1-11. 758
SCS (1968) Hydrology, Supplement A to Sec. 4, Engineering Handbook, Soil Conservation 759
Service Washington, DC. 760
Sebti, A., Fuamba, M. and Bennis, S. (2016) Optimization Model for BMP Selection and 761
Placement in a Combined Sewer. Journal of Water Resources Planning and Management 762
142(3), 04015068. 763
Semadeni-Davies, A., Hernebring, C., Svensson, G. and Gustafsson, L.-G. (2008) The 764
impacts of climate change and urbanisation on drainage in Helsingborg, Sweden: Combined 765
sewer system. Journal of Hydrology 350(1-2), 100-113. 766
33 Shoemaker, L., Riverson, J., Alvi, K., Zhen, J.X. and Murphy, R. (2011) Report on Enhanced 767
Framework (SUSTAIN) and Field Applications to Placement of BMPs in Urban Watersheds. 768
U.S. Environmental Protection Agency, Washington, DC. 769
Tavakol-Davani, H. (2016) Watershed-scale life cycle assessment of rainwater harvesting 770
systems to control combined sewer overflows, The University of Utah. 771
Thorndahl, S. and Willems, P. (2008) Probabilistic modelling of overflow, surcharge and 772
flooding in urban drainage using the first-order reliability method and parameterization of 773
local rain series. Water Res 42(1-2), 455-466. 774
USEPA (1993) Manual Combined Sewer Overflow Control, U.S. Environmental Protection 775
Agency, Cincinnati, OH. 776
Vaes, G., Clemens, F., Willems, P. and Berlamont, J. (2002) Design Rainfall for Combined 777
Sewer System Calculations: Comparison between Flanders and the Netherlands. Global 778
Solutions for Urban Drainage, pp. 1-16. 779
Vaes, G., Willems, P. and Berlamont, J. (2001) Rainfall input requirements for hydrological 780
calculations. Urban Water 3(1-2), 107-112. 781
Verwom, H.-R. and Stuecken, L. (2001) The effects of uniform versus distributed rainfall 782
input on urban drainage modelling results. Engineers, A.S.o.C. (ed), pp. 30-40, Orlando, 783
Florida, USA. 784
Villarreal, E.L., Semadeni-Davies, A. and Bengtsson, L. (2004) Inner city stormwater control 785
using a combination of best management practices. Ecological Engineering 22(4-5), 279-298. 786
Watt, E. and Marsalek, J. (2013) Critical review of the evolution of the design storm event 787
concept. Canadian Journal of Civil Engineering 40(2), 105-113. 788
Willems, P. (2011) Revision of urban drainage design rules based on extrapolation of design 789
rainfall statistics. 790
34 Yazdanfar, Z. and Sharma, A. (2015) Urban drainage system planning and design challenges 791
with climate change and urbanization: a review. Water Science and Technology 72(2), 165-792
179. 793
Yen, B.C. and Chow, V.T. (1980) Design hyetographs for small drainage structures. Journal 794
of the Hydraulics Division 106(ASCE 15452). 795
Yen, B.C. and Chow, V.T., 1980. Design hyetographs for small drainage structures. Journal 796
of the Hydraulics Division, 106(ASCE 15452). 797
Yu, Y., Kojima, K., An, K. and Furumai, H. (2013) Cluster analysis for characterization of 798
rainfalls and CSO behaviours in an urban drainage area of Tokyo. Water Science and 799
Technology 68(3), 544-551. 800