HAL Id: hal-03085728
https://hal.archives-ouvertes.fr/hal-03085728
Submitted on 21 Dec 2020HAL is a multi-disciplinary open access archive for the deposit and dissemination of sci-entific research documents, whether they are pub-lished or not. The documents may come from teaching and research institutions in France or abroad, or from public or private research centers.
L’archive ouverte pluridisciplinaire HAL, est destinée au dépôt et à la diffusion de documents scientifiques de niveau recherche, publiés ou non, émanant des établissements d’enseignement et de recherche français ou étrangers, des laboratoires publics ou privés.
Exploring the Kinetic Limitations Causing Unusual
Low-Voltage Li Reinsertion in Either Layered or
Tridimensional Li 2 IrO 3 Cathode Materials
Biao Li, Gaurav Assat, Paul Pearce, Victoria Nikitina, Antonella Iadecola,
Charles Delacourt, Jean-marie Tarascon
To cite this version:
Biao Li, Gaurav Assat, Paul Pearce, Victoria Nikitina, Antonella Iadecola, et al.. Exploring the Kinetic Limitations Causing Unusual Low-Voltage Li Reinsertion in Either Layered or Tridimensional Li 2 IrO 3 Cathode Materials. Chemistry of Materials, American Chemical Society, 2020, 32 (5), pp.2133-2147. �10.1021/acs.chemmater.9b05362�. �hal-03085728�
Exploring the Kinetic Limitations Causing Unusual Low-Voltage Li Reinsertion in
either Layered or Tri-Dimensional Li
2IrO
3Cathode Materials
Biao Li 1,2†, Gaurav Assat 1,2,3†, Paul Pearce 1,2,3, Victoria Nikitina 4,Antonella Iadecola 2, Charles Delacourt 2,5, Jean-Marie Tarascon 1,2,3*
1Chimie du Solide et de l’Energie—UMR CNRS 8260, Collège de France, Paris, France. 2Réseau sur le Stockage Electrochimique de l’Energie, FR CNRS 3459, Amiens, France. 3
Faculty of Science and Engineering, Sorbonne University, Paris, France.
4
Center for Energy Science and Technology, Skolkovo Institute of Science and Technology, Nobel str. 3, 143026 Moscow, Russia.
5
Laboratoire de Réactivité et Chimie des Solides (LRCS)—UMR CNRS 7314, Université de Picardie Jules Verne, 33 rue Saint Leu, 80039 Amiens Cedex, France
† These authors contributed equally.
*Corresponding author: J.-M. Tarascon: [email protected]
Abstract
The - and -Li2IrO3 polymorphs were recently studied in view of their anionic redox
capabilities that were triggered by full Li removal. Herein, we solely focused on the reacting mechanism involved during the first reversible Li removal (Li2IrO3 LiIrO3). We found
that the charge and discharge processes show significant deviations from the equilibrium potential, with especially the appearance of a peculiar low-voltage feature during discharge with increasing the discharge current. Through detailed electrochemical experiments, such as rate dependence and relaxation, we show that this feature is associated to a kinetically limited phase transition behavior. Moreover, we demonstrated that the large voltage hysteresis pertaining to the removal and uptake of one Li from Li2IrO3 is nested in the different way that the biphasic transition
proceeds between charge and discharge, as deduced by operando X-ray diffraction. Additionally, electroanalytical measurements coupled with scanning electron microscopy unveils that the sluggish biphasic transition is rooted in the slow diffusion of Li+ ion together with the existence of high nucleation barrier of the biphasic reaction. Lastly, the similarities and differences between the kinetics limitations in both Li2IrO3 polymorphs are then discussed with respect to similar type
of limitations occasionally encountered in conventional layered oxides and other cathodes.
Introduction
Li-ion batteries have become about four-times cheaper over the last decade and can now store up to three-times more energy within the same size (volume), hence the reason why we have witnessed the transfer of know-how from the portable electronic sector to the sectors of transportation and stationary storage. However, the long lasting success of Li-ion batteries will
depend on whether we can continue to improve their energy density while lowering their cost and enhancing their sustainability. Li-rich Mn-based layered oxide cathodes, e.g. Li1.2Ni0.13Mn0.54Co0.13O2 (Li-rich NMC) that is an archetypical composition, have been
demonstrated to hold the highest promise regarding practical energy density at the cell level.1,2 Indeed, it was shown that such Li-rich NMC phases can deliver capacities reaching 300 mA h g–
1, as compared to 200 mA h g–1 for classical Li-stoichiometric NMC materials.3,4 Such an enhanced
capacity was demonstrated to be nested in combined anionic and cationic redox processes5,6 – a new paradigm now worldwide studied to design high capacity electrode materials.7-11
Despite the promise of large capacity, unfortunately, a decade-long research effort in commercializing Li-rich NMC cathodes (Li1.2Ni0.13Mn0.54Co0.13O2) has remained unsuccessful.
This is because the extra capacity comes with undesirable practical drawbacks, such as voltage fade, voltage hysteresis leading to low round-trip energy efficiency and thermal dissipation, and poor rate capability.12-14 Strategies for mitigation of these issues have early on targeted their fundamental origins, but this turns out to be quite difficult using Li-rich NMC since it is complicated by interweaved electrochemical activity of three transition metals (TMs) and oxygen.15 Aware of the aforementioned complexity, our group designed simplified (or ‘model’) Li-rich layered oxide based on the solid solution Li2M1–xM’xO3 (M= Ru, M’=Sn, Mn, Ti) within
which the cationic and anionic redox processes were nicely decoupled.16-18 Moreover, we show the feasibility to partially solve the voltage fade via well-selected chemical substitutions to prevent trapping of cations in tetrahedral sites.18 Equally, specific surface treatments or the design of core– shell and concentration-gradient particles were shown to be beneficial to partially mitigate voltage changes.19-21
On the other hand, solving the issues of voltage hysteresis and sluggish anionic kinetics is more challenging. To address them, we decided to study materials within which cationic and anionic redox processes are not decoupled but occur at the same potential so that cationic redox with fast kinetics can serve as a redox-mediator for the sluggish anionic process – a situation offered by the model - and -Li2IrO3 polymorphs, studied in our group, which adopts a 2D and
3D structure, respectively.22,23 The voltage-composition curves for such compounds display a low
voltage (3.5 V) and high voltage (4.5 V) plateau reminiscent of coexisting anionic-cationic redox processes and of anionic solely, respectively, as deduced by XPS analysis. Since we have started this work, it is worth mentioning that the existence of anionic redox activity on this plateau has been quite controversial with RIXS measurements claiming no oxygen activity24 and XAS the opposite25.
Whatever, independently of such a debate, we studied the kinetic aspects of this 3.5 V combined cationic-anionic redox plateau in both - and -polymorphs. Although we could not decouple cationic and anionic redox processes, we unravel in contrast an unusual phenomenon that is the passage of a single voltage plateau to a two-step voltage profile by increasing the cycling rates. Additionally we found a low-voltage feature that forms large hysteresis in both - and -polymorphs. The absence of this anomaly in the GITT measurements suggests specific kinetic limitations alike those found in other insertion compounds. Through combined electrochemical
and operando X-ray diffraction (XRD) measurements we could determine that the origin of such voltage anomaly is due to subtle phase changes, and differs from those observed in conventional layered compounds for sluggish lithium “monovacancy hopping” and high-voltage spinel phase that is ascribed to cation disorder.
Experimental Section
Materials synthesis and electrochemical tests. The synthesis for - and -Li2IrO3 was done by
solid-state methods, as reported elsewhere.22,23 Bellcore-type method was applied to prepare high-porosity free-standing electrodes that are composed of 73 wt% active material (without ball-milling), 9% Carbon Super P and 18% binder–Poly(vinylidene fluoride-co-hexafluoropropylene) (Arkema). The as-prepared Bellcore film was cut into discs of ~1 cm2 to obtain the positive electrodes. By using Li metal foil as the anode, two layers Whatman GF/D borosilicate glass microfibre sheet (GE Healthcare Life Sciences) as the separator, and a LP100 (Merck) electrolyte with the composition of 1 M LiPF6 in ethylene carbonate:propylene carbonate:dimethyl carbonate
in a 1:1:3 volume ratio, the 2032-type test coin cells were fabricated in an argon-filled glovebox. Cyclic voltammetry, chronoamperometry and impedance spectroscopy measurements were performed in three-electrode cells using working electrodes with active material loading of 0.5 mg per cm2 of Al foil with Li reference and Li counter electrodes. All the electrochemical tests were
performed with BioLogic potentiostats.
XRD and XAS. Operando XRD was conducted by an airtight electrochemical cell equipped with a Beryllium window in a BRUKER D8 Advance diffractometer with Cu K radiation (λKα1 =
1.54056 Å, λKα2 = 1.54439 Å). The cell was charging and discharging with the XRD scans being
collected simultaneously. Ir LIII-edge XAS spectra were acquired in transmission mode at the
ROCK beamline of SOLEIL synchrotron (France). A Si(111) channel-cut quick-XAS monochromator with an energy resolution of 2 eV at 11 keV was used. The intensity of the monochromatic X-ray beam was measured by three consecutive ionization detectors. Measurements were performed on bellcore electrodes cycled to desired Li content. The energy calibration was established with simultaneous absorption measurements on an Ir metal foil placed between the second and the third ionization chamber. The obtained data were then processed by Athena software for energy calibration and normalization. Fourier transforms of extended X-ray absorption fine-structure (EXAFS) oscillations were further carried out within a k-range between 3.5 Å−1 to 16 Å−1.
Figure 1. Schematic crystal structures of (a) - and (b) -Li2IrO3. (c) The XRD patterns of - and
-Li2IrO3, showing different long range order. (d) Full range electrochemical curves of - and
-Li2IrO3 between 0<x<2. Note that about 0.5 lithium cannot be extracted from -Li2IrO3 due to
some structural reason, unlike the phase. (e) Ir LIII-edge XANES spectra and (f) the
corresponding k3-weighted EXAFS oscillations of - and -Li2IrO3. The inset shows the
magnitude of Fourier Transform of k3-weighted EXAFS of - and -Li
2IrO3. The similar local
structures around every Ir center atom in both the two phases are shown at bottom left (dark blue and red atoms correspond to Ir and O, respectively).
0.0 0.5 1.0 1.5 2.0 1.5 2.0 2.5 3.0 3.5 4.0 4.5 5.0 20 25 30 35 40 45 0 3000 6000 9000 12000 15000 11200 11225 11250 11275 11300 0.0 0.5 1.0 1.5 2.0 2.5 4 6 8 10 12 14 16 -40 -30 -20 -10 0 10 20 0 1 2 3 4 0 5 10 15 Vo lt age ( V vs Li +/Li ) x of -LixIrO3 -Li2IrO3 -Li2IrO3 Int ensi ty (a. u. ) 2q(degree) Li Ir Ir Li c a -Li2IrO3 -Li2IrO3 N orm al ized m (E) Energy (eV) a b c d e f k 3 c(k) ( Å -3 ) k (Å) -Li2IrO3 -Li2IrO3 -Li2IrO3 -Li2IrO3
-Li2IrO3 -Li2IrO3
c b b a |X(R )| Å -4 R (Å)
Results and Discussions
Brief introduction of - and -Li2IrO3
The synthesis of - and -Li2IrO3 was performed by a solid-state method as we reported
previously22-23. - and -Li
2IrO3 adopt different long-range structures as illustrated by Figure
1a-1b, which is also reflected by the different XRD patterns shown in Figure 1c, and the full-range electrochemistry can be found in Figure 1d. -Li2IrO3 crystalizes into a typical 2D layered
rock-salt oxides with a honeycomb superstructure in a C2/m symmetry, while -Li2IrO3 forms a 3D
framework constructed by edge-sharing IrO6 octahedra. Although being different in long-range
order, they havesurprisingly identical local structures as suggested by the perfectly superimposed Ir LIII-edge X-ray absorption near-edge structure (XANES) (Figure 1e) and the corresponding
EXFAS spectra (Figure 1f) as well as the R space magnitudes (inset of Figure 1f). The local atomic arrangement around Ir atoms in both two phases were extracted (schematic in Figure 1f), showing exactly the same coordination environments extended from 1st shell to 3rd shell (Li atoms are excluded due to negligible scattering factors with X-rays). Hence, these identical local structures produce very similar electronic structures that lead to their similar electrochemical behavior, as we will show later.
Unusual electrochemistry of - and -LixIrO3 (2 ≥ x ≥ 1)
The whole electrochemistry of these two Li2IrO3 polymorphs upon delithiation has been
well studied for their anionic redox capabilities22,23, while here we just focus on the first lithium removal from Li2IrO3 to Li1IrO3 that takes place around the equilibrium potential (Ueq) of ~3.45
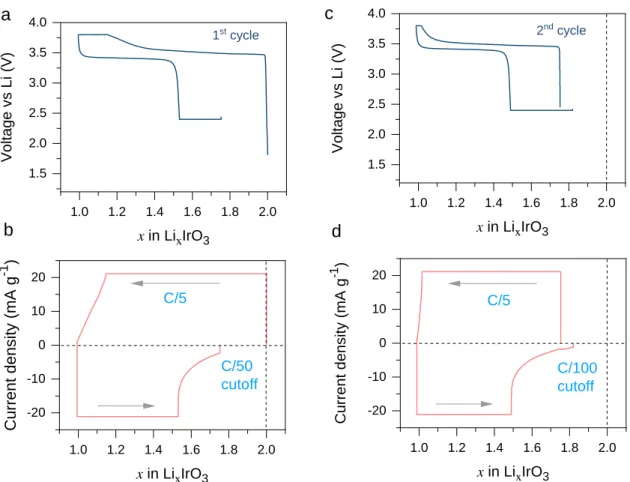
V. Figure 2 shows the unusual electrochemical behavior of -Li2IrO3 such that after one lithium
extraction, there is a large portion of lithium (about 0.5 Li) that cannot be reinserted back using a cutoff of 2.4 V. By holding the voltage at the end of the discharging with very small cutoff current of C/50, about 0.2 Li can further be recovered, but this remains far from the initial state of x = 2
(Figure 2a and 2b). This “irreversibility” is further structurally supported by the ex situ XRD
patterns, which shows incomplete phase transformation from Li1IrO3 back to Li2IrO3 when
discharged to 2.4V and even after 2.4 V potentiostatic holding (Figure S1). In the subsequent cycle, we even imposed an extremely small cutoff current of C/100 for the current decay during the 2.4 V potentiostatic hold (Figure 2c and 2d), but still could only reach x = ~1.85. Noting the sluggish nature of the current decay during the 2.4 V potentiostatic hold (panels b and d), such a large “irreversibility” cannot simply be ascribed to the irreversible phase change or side reactions caused by electrolyte decomposition, especially under shallow delithiation (only half of structural Li extracted) and the voltage cutoff (3.9 V) being well within the electrolyte stability window.
Figure 2. (a) Constant-current and constant-voltage (CCCV) charge-discharge profiles of
-Li2IrO3 at first cycle with the evolution of specific current shown in (b). A constant current was
first applied at C/5 (22 mA g-1), and the cutoff current was set to C/50. (c) CCCV
charge-discharge profiles of -Li2IrO3 over the second cycle, with the evolution of specific current
shown in (d), where the cutoff current was set to C/100.
To further understand these kinetic limitations in -Li2IrO3, we next studied the effect of
gradually varying the current rates from a low-rate of C/100 to a high rate of 1C using a CCCV protocol (C/100 cutoff) within 3.9 V to 2.4 V leading to cycling in the range from x = 1 to x = ~1.85 (Figure 3a). At the slowest rate of C/100, the electrochemical reaction takes place very close to the Ueq of 3.45 V as a flat plateau, typical for biphasic processes. On discharge, gradually
increasing the C rate leads to an earlier polarization of the process, such that at 1C, less than half of the capacity is delivered during the CC step. On the other hand, on charge, this effect is less drastic but still a significant polarization is observed at 1C with the appearance of two voltage features. This implies that there is overall an asymmetrical response of the charge and discharge processes. To assess the polarization response to the current rate, we plotted dQ/dV figures listed from Figure 3b to 3h, where they show increasing asymmetry of the oxidative and reductive peaks along with the increasing current rates. Most notably, the oxidative peak splits into two, with the gap between peaks that increases with the C-rate. This uncovers that as the charge process is pushed faster, it leads to a non-equilibrium situation with seemingly two separate electrochemical
1.0 1.2 1.4 1.6 1.8 2.0 1.5 2.0 2.5 3.0 3.5 4.0 1.0 1.2 1.4 1.6 1.8 2.0 -20 -10 0 10 20 1.0 1.2 1.4 1.6 1.8 2.0 1.5 2.0 2.5 3.0 3.5 4.0 1.0 1.2 1.4 1.6 1.8 2.0 -20 -10 0 10 20 V o lt a g e v s L i (V) x in LixIrO3 a b 1st cycle 2nd cycle Curr ent dens ity (mA g -1 ) x in LixIrO3 c d C/5 C/50 cutoff V o lt a g e v s L i (V) x in LixIrO3 Cur re n t d e n s it y ( mA g -1 ) x in LixIrO3 C/5 C/100 cutoff
processes possibly differing in terms of their kinetics, whereas the discharge process is apparently a single electrochemical behavior near Ueq. However, bearing in mind that the discharge terminates
at a much lower capacity, it is possible that there are other processes, similar to the one observed on charge, but that are triggered below the 2.4 V cutoff. So next, we decided to lower the discharge cutoff voltage.
Figure 3. (a) CCCV charge-discharge profiles of -Li2IrO3 at C/100, C/5 and 1C rates (intermediate rates not shown for the sake of clarity). Note that the longer than usual charge capacity at C/100 is due to side reactions whose effect is accentuated at such low rates. (b)–(h) dQ/dV plots of different current rates (y-axis scales differ across panels).
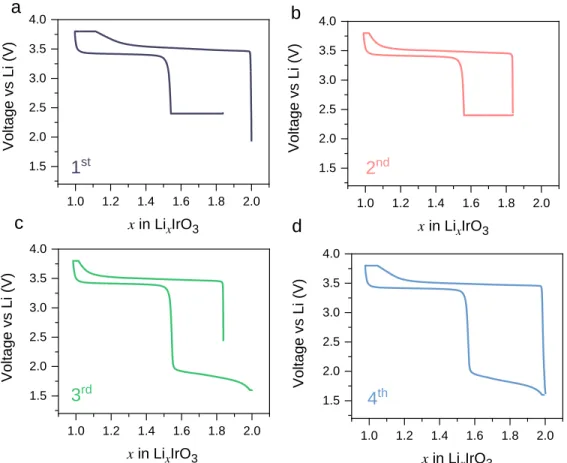
We first performed CCCV procedures for the first two cycles with a 2.4 V cutoff, as shown
in Figure 4a-4b. Similar to Figure 2, it is apparent that the constant voltage step helps in Li
reinsertion, but never leads to a full recovery to x = 2. However, by lowering the discharging cutoff voltage down to 1.65 V in the 3rd cycle, a low-voltage sloped feature at about 1.8 V emerges, which completely recovers the initial state of x = 2 (Figure 4c). Further cycling showing the same 1.8 V feature during discharge with closed charge-discharge curves (Figure 4d) demonstrates that this is a reversible lithium insertion-extraction behavior, but with a large voltage asymmetry during the charge and discharge processes.
0 20 40 60 80 100 2.4 2.8 3.2 3.6 4.0 3.3 3.4 3.5 3.6 3.7 3.8 3.3 3.4 3.5 3.6 3.7 3.83.3 3.4 3.5 3.6 3.7 3.8 3.3 3.4 3.5 3.6 3.7 3.8 3.3 3.4 3.5 3.6 3.7 3.8 3.3 3.4 3.5 3.6 3.7 3.8 3.3 3.4 3.5 3.6 3.7 3.8 1C Voltag e vs Li ( V) Capacity (mAh/g) C/100 C/5 a b C/100 dQ /dV Voltage (V) c C/50 Voltage (V) d C/25 Voltage (V) e C/10 Voltage (V) f C/5 Voltage (V) dQ /dV g C/2.5 Voltage (V) h 1C Voltage (V)
Figure 4. (a) 1st cycle of -Li
2IrO3 to Li1IrO3 cutting off at 2.4V at discharging, followed by
constant voltage method with the cutoff current as C/100. (b) Second cycle following the first cycle
in (a) in the same voltage range. (c) 3rd cycle of the same cell but with lowered cutoff voltage of
1.65V at the discharge process. (d) 4th cycle following the 3rd cycle in (c) discharging to 1.65V.
Thus, it is now clear that the two different kinetic regimes observed in the charging process
in Figure 3 also exist during discharge and with higher severity, as thoroughly unveiled by the two
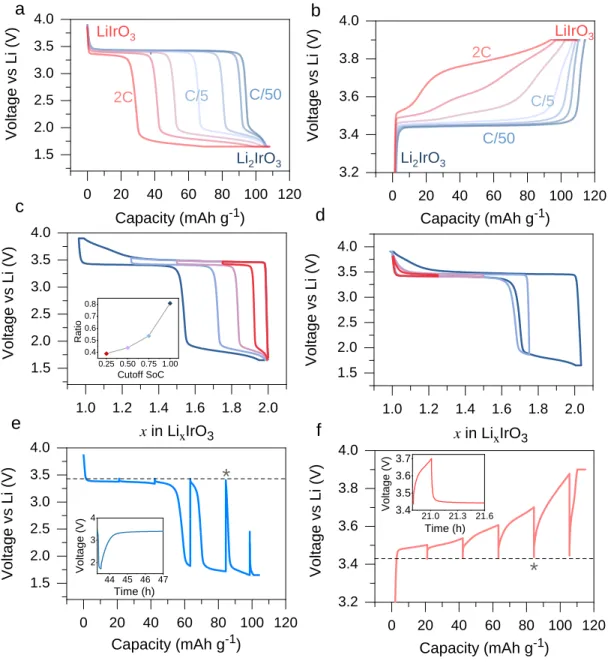
well separated staircase-like voltage steps. We further performed the kinetic analysis with different current rates and GITT experiments in this whole range from x = 2 to 1 (3.9 V to 1.65 V). As shown in Figure 5a, the discharge capacity at the 3.45 V plateau decreases gradually with increasing the C rate from C/50 to 2C (CCCV protocol), as the remaining capacity is transferred to the low 1.8 V step, thus highlighting the large kinetic limitation. Note that the 1.8 V feature is visible even at the lowest rate of C/50. This kinetic limitation is apparently not due to electronic conductivity which causes capacity loss that can never been recovered by lowering the voltage limit, as further supported by the minor contribution of IR drop in the GITT profiles (Figure 5e inset). Correspondingly, the charge voltage also shows larger polarization with larger C rates
(Figure 5b, note the different scale than panel a), with the electrochemical curves changing from a
flat plateau to multiple voltage features. However, the responses of charge and discharge are also asymmetrical such that the latter is predominated by capacity rearrangement at well-separated voltages rather than the more convoluted features observed in charge. Voltage window opening
1.0 1.2 1.4 1.6 1.8 2.0 1.5 2.0 2.5 3.0 3.5 4.0 1.0 1.2 1.4 1.6 1.8 2.0 1.5 2.0 2.5 3.0 3.5 4.0 1.0 1.2 1.4 1.6 1.8 2.0 1.5 2.0 2.5 3.0 3.5 4.0 1.0 1.2 1.4 1.6 1.8 2.0 1.5 2.0 2.5 3.0 3.5 4.0 Vo ltag e vs Li (V) x in LixIrO3 1st Vo ltag e vs Li (V) x in LixIrO3 2nd Vo ltag e vs Li (V) x in LixIrO3 3rd Vo ltag e vs Li (V) x in LixIrO3 a b c d 4th
experiments were also employed to inspect this path-dependent character, which is a method used to understand hysteresis by previous studies.26 As shown in Figure 5c and 5d, by opening the charging voltage, the low voltage feature increases as a function of the charge capacity. The inset of Figure 5c further demonstrates that, with increasing cutoff state of charge (SoC), the ratio of the length of low-voltage plateau to that of high-voltage plateau at discharge increases acceleratingly, implying more severity of the kinetic limitation with deep delithiation. This might suggest that with deep delithiation from Li2IrO3 to Li1IrO3, the electrode follows different path during
discharge from that of reinsertion in partially delithiated electrode. This behavior is reversed in case of discharging-voltage opening experiment, where the charging curve follows the same one almost all the way (a little discrepancy for the full cycle). This actually again manifests the asymmetrical charge-discharge behavior, with respect to the reaction kinetics, as further demonstrated via the GITT results in Figure 5e and 5f. Upon 1C pulse and 4h relaxation, the high voltage polarization is totally eliminated by GITT, with both charge and discharge voltage reaching the same equilibrium potential of about 3.45 V. The huge voltage polarization shown during the low 1.8 V feature really stands out against the charge process, implying great asymmetry as well as the high limitation of kinetics. In addition, the relaxation takes place fast within less than two hour in reaching the Ueq (insets in Figure 5e-5f), which is a typical lithium-diffusion or
phase-redistribution behavior. While comparatively, the charge shows more rapid relaxation (~10 minutes) than discharge, again reflecting the asymmetry of severer sluggishness for discharge kinetics.
Figure 5. (a) Charge and (b) discharge profiles of -Li2IrO3 to Li1IrO3 at different current rates increasing from C/50 to 2C (CCCV protocol with C/100 cutoff). (c) Charge and (d) discharge voltage window opening results at C/5. The inset of c shows the ratio of the length of low-voltage plateau to that of high-voltage plateau of discharge as a function of the cutoff SoC in the voltage-window-opening experiment. GITT curve of (e) charge and (f) discharge process with a 1C pulse and 4 hours rest. The insets show the representative relaxation process of the * marked GITT unit.
0 20 40 60 80 100 120 1.5 2.0 2.5 3.0 3.5 4.0 0 20 40 60 80 100 120 3.2 3.4 3.6 3.8 4.0 1.0 1.2 1.4 1.6 1.8 2.0 1.5 2.0 2.5 3.0 3.5 4.0 1.0 1.2 1.4 1.6 1.8 2.0 1.5 2.0 2.5 3.0 3.5 4.0 0 20 40 60 80 100 120 1.5 2.0 2.5 3.0 3.5 4.0 0 20 40 60 80 100 120 3.2 3.4 3.6 3.8 4.0 44 45 46 47 2 3 4 3.4 21.0 21.3 21.6 3.5 3.6 3.7 0.25 0.50 0.75 1.00 0.4 0.5 0.6 0.7 0.8 Voltage vs L i (V) Capacity (mAh g-1) b c d e f Li2IrO3 LiIrO3 C/50 C/5 2C C/50 C/5 2C Voltage vs L i (V) Capacity (mAh g-1) Li2IrO3 LiIrO3 Voltage vs L i (V) x in LixIrO3 Voltage vs L i (V) x in LixIrO3 Voltage vs L i (V) Capacity (mAh g-1)
*
*
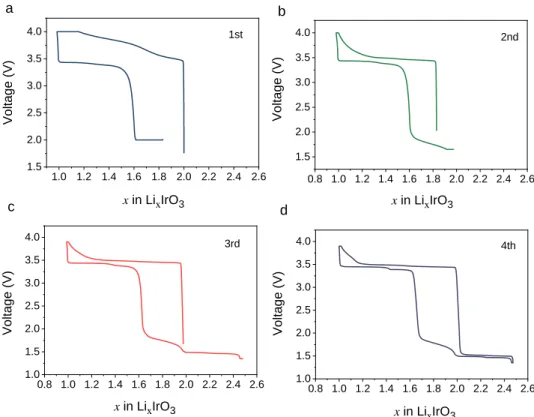
Voltage vs L i (V) Capacity (mAh g-1) a V olt ag e (V) Time (h) Time (h) V olt ag e (V) R a tio Cutoff SoCFigure 6. Electrochemical curves of (a) 1st cycle, (b) 2nd cycle, (c) 3rd cycles and (d) 4th cycle of
-Li2IrO3 to LiIrO3 at different discharge cutoff voltages by the CCCV procedure. The current rate
used is C/5. Note that the high polarization on first charge is always observed on the phase and is simply due to the large as-synthesized particles (>10 μm), as it disappears in subsequent cycles due to electrochemical grinding as the particles crack upon first Li removal.
Before gaining further insight into the origin of the large hysteresis, we replicated our study from layered -Li2IrO3 to -Li2IrO3, which is known to have a tri-dimensional framework and thus
higher robustness of the structure against anionic redox, to see if the structural dimensionality will play a role. Figure 6 presents the CCCV cycle results of -Li2IrO3, which displays two slightly
separated plateaus around 3.4 V during discharge as opposed to a single one for -Li2IrO3.
Moreover, it surprisingly shows the similar inability to get back to x = 2 Li stoichiometry on discharge as in -Li2IrO3 due to the sluggishness of Li reinsertion, despite a long 2.0 V
potentiostatic hold. Here again, by further lowering the cutoff voltage to 1.65 V, the lithium can be fully reinserted back at the 1.8 V sloped feature leading to a large voltage hysteresis (Figure 6b). Note that the phase allows further lowering of the cutoff voltage to 1.3 V as it can reversibly uptake about 0.5 extra Li per formula at the potential of about 1.45 V without any hysteresis
(Figure 6c and 6d), with two faintly distinguishable plateaus corresponding to two biphasic
processes according to our previous study.23 Regardless of this 1.45 V plateau for extra Li insertion, the behavior of -Li2IrO3 bears remarkable similarity with that of -Li2IrO3 in terms of the
hysteresis feature, implying its independence with regard to the long-range structural dimensionality. Furthermore, the rate analysis and voltage relaxation test (Figure 7) provides clear
1.0 1.2 1.4 1.6 1.8 2.0 2.2 2.4 2.6 1.5 2.0 2.5 3.0 3.5 4.0 0.8 1.0 1.2 1.4 1.6 1.8 2.0 2.2 2.4 2.6 1.5 2.0 2.5 3.0 3.5 4.0 0.8 1.0 1.2 1.4 1.6 1.8 2.0 2.2 2.4 2.6 1.0 1.5 2.0 2.5 3.0 3.5 4.0 0.8 1.0 1.2 1.4 1.6 1.8 2.0 2.2 2.4 2.6 1.0 1.5 2.0 2.5 3.0 3.5 4.0 Vo ltag e (V) x in LixIrO3 1st Vo ltag e (V) x in LixIrO3 Vo ltag e (V) x in LixIrO3 x in LixIrO3 2nd 3rd Vo ltag e (V) 4th a b c d
evidence of sluggish kinetics of the low-voltage plateau as well as the asymmetry of the charge and discharge responses, fully consistent with the -Li2IrO3 phase.
Although these two polymorphs have different long-range dimensionalities, the similar Ir-O electronic structure resulted from their identical local structures (even applicable for Li1IrO3, as
shown in Figure S2),which defines the electrochemical property, makes it not surprising for the existence of similar hysteresis behavior in both two phases. Given that the relaxation of the voltage back to Ueq is very fast at the low-voltage feature, we reasonably attribute this kinetic limitation to
the lithium-diffusion or phase-redistribution problem, which is a very short time scale. To decipher between them, we next used operando XRD to track the evolution of long ranger order in order to pursue an answer.
Figure 7. Cycling curve of -Li2IrO3 at different rates of (a) C/5, (b) 1C, and (c) 3C with CCCV protocols (C/100 current cutoff). (d) The 4h relaxation during the low-voltage feature while cycling at 1C. The inset shows the relaxation along with time, which is similar to phase that it
almost reaches Ueq within less than 1 hour.
0.8 1.0 1.2 1.4 1.6 1.8 2.0 2.2 2.4 2.6 1.0 1.5 2.0 2.5 3.0 3.5 4.0 0.8 1.0 1.2 1.4 1.6 1.8 2.0 2.2 2.4 2.6 1.0 1.5 2.0 2.5 3.0 3.5 4.0 0.8 1.0 1.2 1.4 1.6 1.8 2.0 2.2 2.4 2.6 1.0 1.5 2.0 2.5 3.0 3.5 4.0 0.6 0.8 1.0 1.2 1.4 1.6 1.8 2.0 2.2 2.4 2.6 1.0 1.5 2.0 2.5 3.0 3.5 4.0 112 113 114 115 116 2.0 2.5 3.0 3.5 Vo lta g e vs L i (V) Vo lta g e vs L i (V) x in LixIrO3 x in Li xIrO3 Vo lta g e vs L i (V) x in LixIrO3 x in LixIrO3 Vo lta g e vs L i (V) C/5 1C 3C a b c d 1C 4 h relax V o lt a g e ( V ) Time (h)
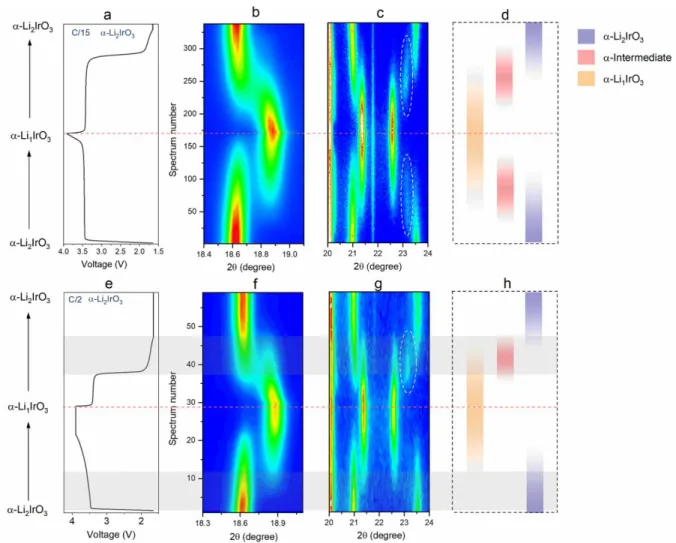
Figure 8. (a) Electrochemical cycling curve of -Li2IrO3 at C/15 (after initial formation cycles) within an operando XRD cell. Contour plots of the evolution of operando XRD scan between (b)
18.4-19.1 2θ degree and (c) 20-24 2θ degree for -Li2IrO3 at C/15. (d)Schematic illustration of
the phase change at C/15, with the strips in different colors corresponding to the evolution of different phases, as indicated by the right-side legend. (e) Electrochemical cycling curve of
-Li2IrO3 at C/2 for the subsequent cycle within an operando XRD cell. Contour plots of the
evolution of operando XRD scan between (f) 18.3-19.3 2θ degree and (g) 20-24 2θ degree for
-Li2IrO3 at C/2. (h) Schematic illustration of the phase change at C/2. The grey shaded bands
highlight the equivalent processes of the hysteretic range during charge and discharge.
Operando XRD study of -Li2IrO3 and -Li2IrO3
Operando XRD measurements were carried out by cycling the -Li2IrO3 electrode in an
operando cell for 5 cycles in the whole 3.9 - 1.65 V range, meanwhile simultaneously collecting XRD scans. The following discussion excludes the first cycle because it is just a formation cycle that leads to some electrochemical grinding followed by stabilized subsequent cycles. Figure 8
shows the operando XRD results of -Li2IrO3 at a low current rate of C/15, with the evolution of
selected peaks shown by the contour plots. Initially, upon charging the first peak at 18.6 slightly shifts indicative of a solid solution prior to reach a biphasic domain (Figure 8b). During the subsequent discharge, we observe nearly the reverse phase sequence except for a strong solid-solution-like behavior of the biphasic transition that is a result of deviation from equilibrium path. Interestingly, when looking at the range of 20-24 degree, there is partial appearance (white dashed circles in Figure 8c) of an intermediate phase that is possibly related to a -Li1.5IrO3 phase in
analogy to the well crystallized -Li1.5IrO3 phase that we have reported previously.23 The reaction
can hence be viewed as a triphasic reaction where the charged phase forms at the expense of the pristine O3 phase via an kinetically stable intermediate transition state, and vice-versa on discharge. The schematic of the phase transition at C/15 shows quite a symmetrical phase evolution upon charging and discharging (Figure 8d). However, this evolution is not perfectly symmetric as there are strong hints of solid-solution behavior.
Figure 8e-8g show the operando XRD results of the same cell cycled at a faster rate of C/2.
The 18.3-19.2 region in 2q remains the same as at C/15 (Figure 8f). In contrast, the second 2q region (Figure 8g) reveals a drastic difference, namely the disappearance of the intermediate phase in charge but not on discharge while this intermediate phase is present both on charge and discharge at C/15 as better illustrated in the schematic (Figure 8h). This does not come as a surprise since it is well known that increasing high rate cycling leads to a greater departure from the equilibrium regime and more so when the system is kinetically limited. Moreover, the disappearance of intermediate in charge and not in discharge suggests slightly different reacting paths that could have an impact on the kinetics of the system.
A further analysis of this room temperature phase evolution for -LixIrO3 at C/2 reveals an
additional difference in the way the -Li2IrO3 ↔ -Li1IrO3 transformation proceeds during charge
versus discharge (see shaded areas in Figure 8 bottom). In charge, it shows only a single -Li2IrO3
phase and the accumulation of the intermediate phase appears to be skipped, highlighting the rapidity of the -intermediate → -Li1IrO3. However, for discharge the intermediate phase
accumulates significantly, highlighting the sluggishness of -intermediate → -Li2IrO3. This
retarded phase transition in discharge suggests that the kinetics of the reacting path of the discharge process is more sluggish than the charge one, hence needing a higher overpotential.
A similar operando XRD study was also done on 3D -Li2IrO3 to check the effect of
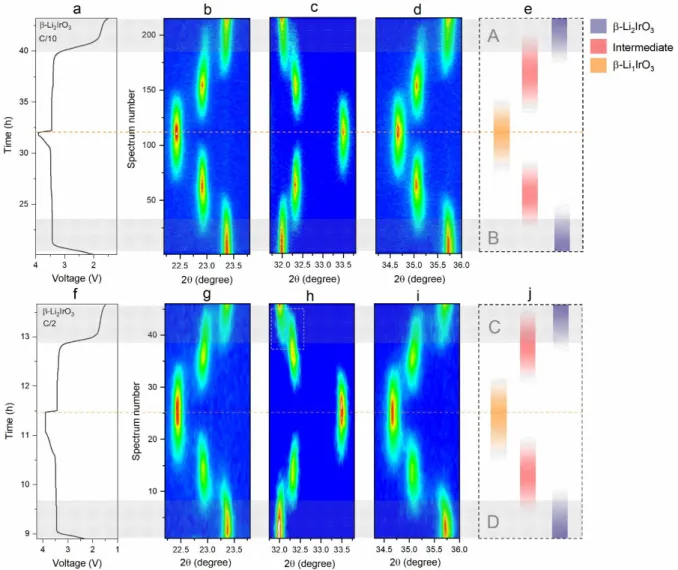
structural dimensionality 2D () vs. 3D () on the phase transformation kinetics. Alike previously, after initial formation cycles the X-ray data collected at a current rate of C/10 and then at C/2 is shown as contour plots in Figure 9 top and bottom, respectively, along with the schematics of phase evolution. The results indicate the presence of two consecutive well-defined biphasic reactions parted by an intermediate phase (-Li1.5IrO3) during charge and discharge at C/10 (Figure
9b-9d). Such difference is however more dimmed at C/2, namely in discharge (see dashed
rectangle in Figure 9h) and further highlighted in Figure 9j top (shaded area C) by the large domain of coexistence of the -Li2IrO3 and -intermediate phase as contrasted by the charge process
(shaded area D). This, to some extent, mirrors in a less dramatic behavior of -Li2IrO3,which
shows a pronounced asymmetrical phase evolution. Altogether, these results indicate that to a few differences, both 2D and 3D Li2IrO3 behave alike and show sluggish phase conversion in discharge.
This is not a total surprise since these two polymorphs nearly adopt the same local structure as we have demonstrated initially in Figure 1 and Figure S2.
Figure 9. (a) Electrochemical cycling curve of -Li2IrO3 at C/10 within an operando XRD cell. Contour plots of the evolution of operando XRD scan between (b) 22.2-23.8 degree, (c) 32.2-33.8
degree and (d) 34.2-36 degree for -Li2IrO3 at C/10. (e) Schematic illustration of the phase change
in -Li2IrO3 at C/10. (f) Electrochemical cycling curve of -Li2IrO3 at C/2 in the subsequent cycle
within an operando XRD cell. Contour plots of the evolution of operando XRD scan between (g)
22.2-23.8 degree, (h) 32.2-33.8 degree and (i) 34.2-36 degree for -Li2IrO3 at C/2. (j) Schematic
illustration of the phase change in -Li2IrO3 under C/2. The bands shaded in grey marked by A, B,
C, and D highlight the equivalent processes during charge and discharge in the hysteretic range for both current rates.
Cyclic voltammetry analysis
Being aware of the phase transition problem, as deduced by XRD, we further applied cyclic voltammetry (CV) to understand the kinetics of phase transformation. We first examined the CVs of α-Li2IrO3 with different cathodic limits and the results are shown in Figure 10a. After the first
formation cycle between 2.7 V-3.9 V, we could observe two separated processes (anodic peaks 1 and 2), but with only single-behavior-like cathodic peak in discharge (blue line in Figure 10a). Afterwards, there is the appearance of a new additional peak (peak 3 in Figure 10b) by extending the cathodic limit to 2.0 V, with some capacity redistribution between the processes 1 and 2 (orange line in Figure 10a). Further decreasing the cathodic limit to 1.65 V triggers an onset of a new reduction peak, which corresponds to the aforementioned low-voltage feature where finally the stoichiometry of -Li2IrO3 is reached. An additional peak 4 (Figure 10b) in further charge reminds
us that there is possibly a little overlithiation during discharge to 1.65 V. Moreover, once Li2IrO3
is restored, the reversed charge scan shows a more severe capacity redistribution at 3.4-3.9 V, with the anodic peak 1 almost invisible and peak 2 getting broadened (black line in Figure 10a). Nevertheless, there are still two distinct processes on both charge and discharge, as shown by CVs with different anodic limits (Figure 10c), where we could see a sharp cathodic peak 2 grows based on a broad peak 1 upon widening the voltage window.
Figure 10.(a) CVs (0.1 mV/s) of -Li2IrO3 electrodes with cathodic potential limits 2.7, 2.0, and
1.65 V. (b) Enlarged part of the CVs in the 1.65 – 3.0 V region. (c)CVs of -Li2IrO3 electrodes
(with 1.65 V cathodic limit) registered with different anodic limits (3.50 V, 3.60 V, 3.90 V).
2.8 3.0 3.2 3.4 3.6 3.8 -0.15 -0.10 -0.05 0.00 0.05 0.10 2.0 2.5 3.0 3.5 -0.10 -0.05 0.00 0.05 0.10 1.8 2.1 2.4 2.7 3.0 -0.02 -0.01 0.00 E (V) I ( m A ) 1' 2' I ( m A ) first charging 2.7 V 2.0 V 1.65 V a 1 2 2.7 V 2.0 V 1.65 V b 3 3' 4 c I ( m A ) E (V) E (V)
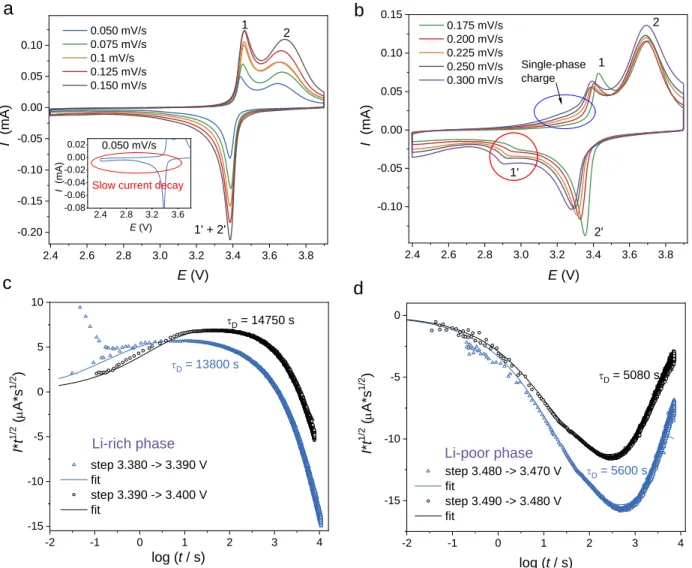
Figure 11. CVs of α-Li2IrO3 electrode in the 2.4 – 3.9 V range at different scan rates: (a) low to intermediate scan rates (inset marks out the slow current decay region at scan rate of 0.05 mV/s);
(b) high scan rates. (c)Current transients registered upon delithiation for the potential steps from
3.380 to 3.390 V, 3.390 to 3.400 V (diffusion in the α-Li1.85IrO3 phase). (d) Current transients
registered upon lithiation for the potential steps from 3.460 to 3.470 V, 3.470 to 3.380 V (diffusion
in the LiIrO3 phase).
At this stage it become difficult to further exploit from the CV scan the mechanism involved in the 1.65 V3.9 V voltage range, since the anodic peaks are not well defined and capacity is redistributed at high scan rates. Instead, we concentrated on the CV scan between 2.43.9 V, namely the reversible process of extraction (-Li1.85IrO3 → -Li1IrO3) and insertion
(-Li1IrO3 → -Li1.85IrO3) corresponding to the galvanostatic cycle in Figure 4b. In Figure 11a,
CVs at different (relatively low) scan rates show two distinct processes (peak 1 and 2) on charge, which can be assigned to -Li1.85IrO3→-intermediate and -intermediate → -Li1IrO3 phase
transition, respectively, while we could only observe a single-behavior-like cathodic peak in
2.4 2.6 2.8 3.0 3.2 3.4 3.6 3.8 -0.20 -0.15 -0.10 -0.05 0.00 0.05 0.10 2.4 2.8 3.2 3.6 -0.08 -0.06 -0.04 -0.02 0.00 0.02 2.4 2.6 2.8 3.0 3.2 3.4 3.6 3.8 -0.10 -0.05 0.00 0.05 0.10 0.15 -2 -1 0 1 2 3 4 -15 -10 -5 0 5 10 -2 -1 0 1 2 3 4 -15 -10 -5 0 I (mA) E (V) 0.050 mV/s 0.075 mV/s 0.1 mV/s 0.125 mV/s 0.150 mV/s a I (mA) E (V) I (mA) E (V) b c 1 2 1' + 2' I 0.050 mV/s
Slow current decay
0.175 mV/s 0.200 mV/s 0.225 mV/s 0.250 mV/s 0.300 mV/s 1 1' 2 2' Single-phase charge tD = 13800 s step 3.380 -> 3.390 V fit step 3.390 -> 3.400 V fit I* t 1 /2 ( m A*s 1 /2 ) log (t / s) tD = 14750 s Li-rich phase Li-poor phase tD = 5600 s tD = 5080 s I* t 1 /2 ( m A*s 1 /2 ) log (t / s) step 3.480 -> 3.470 V fit step 3.490 -> 3.480 V fit d
discharge. However, upon further increasing the scan rate an additional peak 1 is decoupled from peak 2 (Figure 11b) since at low scan rates they are overlapped and therefore cannot differentiated. The large shifting of peak 1 under high scan rates implies a very kinetic-limited reaction, namely -intermediate → -Li1.85IrO3, in accordance with what we have observed from operando XRD.
Besides, when increasing scan rates,there is a single-phase region (Figure 11b) instead of a sharp exponential rise in current, indicative of a nucleation-controlled phase transformations27. This
suggests the reaction 1 (-Li1.85IrO3 → -intermediate) prefers a solid-solution path rather than a
nucleation-controlled two-phase reaction at high scan rates. This is in agreement with the disappearance of the -intermediate phase previously observed by operando XRD when -Li2IrO3
was charged at C/2 (Figure 7g). In contrast, the persistency of the -intermediate phase during the discharge at C/2 reflects a higher nucleation energy barrier for the reversed reaction process (-intermediate → -Li1.85IrO3), which is the origin of the low-voltage feature.
Noted that during discharge there is a very slow current decay (inset of Figure 11a), which could be related with slow Li diffusion. To better understand Li diffusivity, we used Montella approach28,29 to determine the diffusion time constants (τD) for Li-rich phase (-Li1.85IrO3) and
Li-poor phase (-Li1IrO3), as shown in Figure 11c-d. Since it’s hard to estimate the τD in extremely
large particles in the samples (see SEM images in Figure S3a-3b), we solely exploited the narrow single-phase regions, just before the phase transformation starts to estimate diffusivities. The evaluated diffusion time constants are believed to correlate with the differences in the phase boundary propagation rates during the phase transformation, while large strain energies should contribute further in the slowness of the phase boundary migration. On discharge, the diffusion occurs in the Li-rich phase, -Li1.85IrO3 (Figure 11c), with a τD of 13 000 – 15 000 s. On charge,
the phase boundary and Li+ ions move in the Li-poor phase(s), -Li1IrO3, with τD of 5000 – 6000
s (Figure 11d). This big difference of the diffusion time constants for charge and discharge well
explains the asymmetry of the charge-discharge kinetics and the long current decay in Figure 11a
(inset) as well.
Since slow Li diffusion dominates the response of -Li2IrO3, it becomes impossible to
determine the nucleation rate constants or the nucleation barriers, but we could deduce that a large nucleation energy barrier associated with high strain exists according to the exfoliation layers observed in SEM images (Figure S3c-3d). Therefore, it is possible that both slow Li diffusion and high nucleation energy barrier of -intermediate → -Li1.85IrO3 contribute to the whole hysteresis
or the low-voltage feature.
For the β-Li2IrO3 electrodes, the CVs show similar features, with only minor differences
from the phase electrochemical behavior. Anodic peaks 1 and 2 are now poorly resolved even in the 2.4 – 3.8 V potential range (Figure S4a) and the cathodic peak appears as a single process even at very high scan rates: 0.4 – 0.5 mV/s (Figure S4b). This is indicative of somewhat lower nucleation barriers for the β phase compared to the α-Li2IrO3 sample. Correspondingly, the
single-phase region on charge, which appears at high scan rates for the single-phase, is less pronounced (though clearly observed in Figure S4b at 3.4 – 3.5 V) for the β-Li2IrO3 sample. Additionally, at
3.7 – 3.8 V further delithiation of β-Li1IrO3 starts as a single-phase process, which manifests itself
in the appearance of two small cathodic peaks at 3.65 and 3.78 V in the reverse scan. The diffusivities near the phase transformation potentials again show the pronounced asymmetry for the Li-poor and Li-rich phases (3 500 and 11 500 s, Figure S4c), which explains the differences in the charge and discharge kinetics alike for the α-Li2IrO3 electrodes. Extending the cathodic
potential limit to 1.65 V also results in quite similar trends, with the additional Li-ions being inserted in the low-voltage region (Figure S4d). However, unlike the observed changes in the CVs of α-Li2IrO3 electrodes, the restoration of the β-Li2IrO3 stoichiometry results in the diminution of
the nucleation barriers, as evidenced by the sharper rises in current in the ascending branches of the peaks (Figure S4d). These minor dissimilarities in the behavior of the two polymorphs should originate from the structural differences between the layered and tri-dimensional material.
The existence of a single-phase region is the very close proximity of the two-phase process for the β-Li2IrO3 material (Figure S5a) allows probing the Li-ion diffusivity at β-Li2-δIrO3
composition. The diffusion time constant evaluated from impedance spectroscopy data equals to ~70 s-1 at 3.7 V (Figure S5b), where single-phase Li+ insertion/extraction takes place. This value
is two orders of magnitude higher than the diffusion time constants near the phase-transformation potentials for the Li1.85IrO3 → intermediate and Li1IrO3 → intermediate processes. This shows that
the low Li diffusivities account for the processes involving deep lithiation of the LiIrO3 structures.
Discussion
Prior to confront our results with previous studies on this topic, it is imperative to recall some aspects regarding the thermodynamics and kinetics of voltage hysteresis as well as some examples. For tens of years, the voltage hysteresis problem has been found in a variety of electrodes for not only Li-ion batteries, but also other systems like nickel-based alkaline batteries.30 Although great efforts were contributed to exploring the underlying origin of these hysteresis problems, some of them still remain elusive and controversial. This dilemma arises from the confusion between the thermodynamic origin of the hysteresis and the kinetic polarization due to their different time-scales of relaxation. For a typical kinetic polarization, the relaxation has a very short time-scale so that the voltage can reach the equilibrium potential very fast. These polarizations are supposed to be rooted in either low electronic or ionic conductivity, and can be referred as electron diffusion or ion (Li etc.) diffusion problem. Normally a high surface current density, generated by high charge-discharge rate or large particle size, will aggravate such polarizations.
However, for some electrodes, it turns that the equilibrium potential is hard to reach even after weeks of relaxation. Such systems possess a prominent quasi-static hysteresis that originates from some thermodynamic origins. Among them are the conversion reaction type electrodes which show large voltage hysteresis owing to thermodynamic limitations associated to either bond breaking/re-formation31, different charge-discharge reacting paths32-35 or surface/interface energy penalty caused by particle electrochemical nanosizing36. Similar quasi OCV hysteresis caused by
sp2 to sp3 bond changes was also reported in hydrogen-containing carbons by T. Zheng et al.37 Besides, a totally different thermodynamic-origin explanation to account for the “zero-current” hysteresis of LiFePO4 was proposed by W. Dreyer et al. based on a so-called “rubber balloon”
model, which is nested in the non-monotonic shape of the “single particle” equilibrium potential curve.38 In this case, the “thermodynamic” hysteresis between the charge and discharge plateaus
can be attributed to the supersaturation required to form a critical nucleus of another phase inside the pristine phase-transforming material. These thermodynamic origins are apparently different from the one rooted in conventional kinetic polarizations.
Anionic redox further complicates these hysteretic issues by providing a variety of Li-rich electrodes with diverse magnitudes of quasi-static hysteresis. Initially, the origin of the anionic-redox-induced hysteresis was simply believed to be nested in the reversible cation migration.26,39 This simple picture has been challenged by recent studies which correlate hysteresis to a charge-transfer bandgap effect40 and O-O bond stabilization41 in d0 cation-disorder compounds. Lastly, micro-calorimetry studies of the LRSO compound conclusively demonstrated that hysteresis is present as long as a deviation from the equilibrium path is triggered by some sluggish structural reorganizations, including cation migration, O-O dimerization, layered gliding etc.42
Now coming back to our study of the Li2IrO3 polymorphs, we have demonstrated a sluggish
phase transition appearing in discharge that causes the low-voltage 1.8 V feature associated with the hysteresis. Thus a legitimate question deals with the origin of the sluggish (intermediateα or -Li2IrO3) phase transition. Bearing in mind the coexistence of both cationic and anionic processes
on the 3.4 V plateau in these compounds, it was at first tempting to correlate this phase transition to anionic redox process, which is now well known to show slow kinetics as compared to the fast cationic process. This was consistent with the path-dependent feature of -Li2IrO3 which
resembles lithium-rich NMC compound for which a gradual opening of the charging voltage window leads to larger hysteresis in discharge as more contribution of anionic redox is released.15,26 However, operando XAS measurements were unsuccessful in establishing phase transitionanionic redox correlation due to the requirement of high energy beam that cannot be access to anions. Moreover, GITT analysis has revealed a short-time scale of relaxation, that is quite different from what we have observed in Li-rich NMC and LRSO unless the cationic redox (Ir5+/4+) can accelerate the relaxation which is quite unlikely, hence the need to look for an alternative explanation.
On the other hand, as shown by the electrochemical analysis, the sluggishness of phase transition could be attributed to very slow Li diffusion and high nucleation energy barrier. It needs to be mentioned that the spinel LiMn1.5Ni0.5O4 ↔ Li2Mn1.5Ni0.5O4 also shows a very similar
overpotential features as the Li1IrO3 ↔ Li2IrO3 reported herein.43 Within this spinel, the
transition-metal ions disordering incurs a smaller space for lithium accommodation into the 16c octahedral sites, hence leading to sluggish kinetics for lithium diffusion whose consequence is the appearance of an hysteresis. This kinetic limitation in LiMn1.5Ni0.5O4 was also found to be accompanied with
a sluggish phase transition from T2 to T1 phase, with the former transforming to equilibrium T1 phase by a fast relaxation process alike in our iridates. This hypothesis is further strengthened by
the fact that Li occupies tetrahedral sites in the Li1IrO3 polymorphs as well as Li1Mn1.5Ni0.5O4,
while it moves upon Li insertion to octahedral sites in the Li2IrO3 polymorphs as well as in
over-lithiated Li2Mn1.5Ni0.5O4 spinel, thus possibly explaining the very similar overpotential features in
the two families of compounds.
There are also several reports about kinetic limitations pertaining to Ni-containing conventional O3-type layered compounds showing similar sluggish phase transitions, as exemplified by LiNi1/3Co1/3Mn1/3O2 (NCM) and LiNi0.80Co0.15Al0.05O2 (NCA).44-47 For these
compounds, the lithium diffusion was considered to be worsened for a low threshold of lithium-vacancy concentrationbased on the “monovacancy hopping” model proposed by Van der Ven et al. lithium hopping via monovacancy path having higher kinetic energy barrier48. Experimentally, this is manifested as a substantial “irreversibility” during the first cycle that can nevertheless be recovered via a low voltage plateau by lowering the cutoff discharge voltage. This led to the well-known over-lithiation of, for instance, LiNiO2 into a Li2NiO2 at the particle surface
with the latter having Li in tetrahedral instead of octahedral sites for the former.44
Could this surface scenario apply to LixIrO3 with the formation of Li2[Li1/3Ir2/3]O2 hence
explaining the drastic voltage drop at 3.4 V for both α and polymorphs? Several observations do not support this scenario. First, the over-lithiation plateau of -Li2IrO3 can be observed clearly
at lower voltage for both polymorphs (Figure 12a-12b and Figure 6d), and it is also highly reversible with small hysteresis unlike in LiNiO2. Second, the formation of Li2MO2 phase cannot
explain the path-dependent behavior of the low-voltage feature. Finally, we could not observe any Li2MO2 phase formation for layered -Li2IrO3 at 1.8 V as one previously did in conventional
compounds (Figure 12c), while when the cell was over-discharged to 1.35 V a distinct peak at 18.2 shows up indicating the transformation to Li2MO2 phase (Figure 12d).
Overall, having excluded the Li2MO2 surface scenario as well as the interplay between
phase transition and anionic redox we are falling short of other structural/transport phenomena that could account for lithium-diffusion or nucleation problems. A certainty is that the hysteresis spotted for both Li2IrO3 polymorphs possesses specific signatures that cannot be found in other
insertion compounds presenting hysteresis phenomena. Thus, Li2IrO3 polymorphs broaden the
diversity and complexity of hysteresis problems in insertion compounds that are too hastily ascribed to cation migration.
Figure 12. (a)The first three cycles of -Li2IrO3 charged and discharged between 1.35V and 2.5V
at C/5, with overlithiation/delithiation of one lithium. (b) The 4th cycle reacted between 1.35V and
3.75V at C/5, with differentiated plateaus from kinetic limitation of the phase change and
formation of Li2MO2 phase. (c) Selected XRD patterns from -Li2IrO3 at C/2 between 17-19.6
degree. There is no new phase formation in the range of 17.2-18.2 degree at the end of 1.8V plateau
and the end of constant-voltage discharge at 1.65V. (d) XRD patterns for -Li2IrO3 at the end of
discharge at C/2 and the one further discharged to 1.35V. The peak at 18.2 corresponds to the
Li2MO2 phase (M=Li1/3Ir2/3).
Conclusion
In summary, we have studied the electrochemical delithiation/lithiation of both - and -Li2IrO3 to Li1IrO3 and found the lithiation process is kinetically limited with the appearance of a
1.8 V low-voltage feature associated to a large voltage hysteresis. From GITT measurements we could totally eliminate the hysteresis as the materials display fast relaxation. Moreover, via the opening-voltage-window experiment we could evidence that the low-voltage feature shows a path-dependent behavior and changes as a function of the charge depth. By means of operando XRD
2.0 2.5 3.0 1.5 2.0 2.5 1.0 1.5 2.0 2.5 3.0 3.5 1.0 1.5 2.0 2.5 3.0 3.5 4.0 18 20 22 24 26 0 2000 4000 6000 8000 10000 17.0 17.5 18.0 18.5 19.0 19.5 200 400 600 800 1000 1200 1400 1600 Vo lt a g e ( V) x of LixIrO3 1st 2nd3rd Vo lt a g e ( V) x of LixIrO3
kinetic limitation of phase transition
a b c 4th cycle Overlithiation to Li2MO2 phase End of discharge Overdischarged to 1.35V Inten s it y ( a .u.) 2q (degree) Li2MO2 phase (M=Li1/3Ir2/3) Li2IrO3 Inten s it y ( a .u.) Pristine End of 1.8V plateau End of CV discharge at 1.65V 2q (degree) d
technique, we unraveled asymmetrical phase changes between charge and discharge for both polymorphsthe biphasic reaction intermediate (Li1.5IrO3) Li2IrO3 is hindered kinetically.
Finally, the sluggishness of phase transition was ascribed to the slow Li diffusion and its high nucleation barrier as deduced from the CV analysis coupled with Montella approach and from both the exfoliated layers as observed from SEM results and the phase evolution analysis by operando XRD, respectively.
Overall, we believe this low-voltage feature and hysteresis observed in Li2IrO3 polymorphs
are caused by the kinetically limited reaction of intermediate (Li1.5IrO3) Li2IrO3 rooted in
sluggish Li diffusivity and the high nucleation barrier of this biphasic transition. In a broad sense, this finding will fertilize the diversity of the hysteresis in insertion compounds of Li-ion batteries. It also exemplifies that the hysteretic behavior is more complex than expected, especially in Li-rich compounds involving anionic redox where cation migration was widely considered to be responsible for hysteresis. This kinetic limitation in Li2IrO3 will also enrich our understanding of
the analogous phenomena in other electrodes.
ASSOCIATED CONTENT
Supporting Information. This material is available free of charge via the Internet at
http://pubs.acs.org. It includes XANES of Ir collected on both and Li1IrO3, SEM images for
-LixIrO3 and electrochemical analysis data of -Li2IrO3.
AUTHOR INFORMATION Corresponding Author
*Jean-Marie Tarascon: [email protected]
ACKNOWLEDGMENT
The authors thank the ROCK beamline (financed by the French National Research Agency (ANR) as a part of the "Investissements d'Avenir" program, reference: ANR-10-EQPX-45;), SOLEIL synchrotron, for the X-ray absorption spectroscopy experiment (proposal 20171299). B.L, G.A, P.P, and J.-M.T. acknowledge funding from the European Research Council (ERC) (FP/2014)/ERC, Grant-Project 670116-ARPEMA. Use of the 11-BM mail service of the APS at Argonne National Laboratory was supported by the US Department of Energy under contract No. DE-AC02-06CH11357 and is gratefully acknowledged.
REFERENCES
(1) Thackeray, M. M.; Kang, S.-H.; Johnson, C. S.; Vaughey, J. T.; Benedek, R.; Hackney, S. A., Li2MnO3-stabilized LiMO2 (M = Mn, Ni, Co) electrodes for lithium-ion batteries. J. Mater.
Chem. 2007, 17, 3112-3125.
(2) Rozier, P.; Tarascon, J. M., Review—Rich Layered Oxide Cathodes for Next-Generation Li-Ion Batteries: Chances and Challenges. J. Electrochem. Soc. 2015, 162, A2490-A2499.
(3) Zheng, J.; Myeong, S.; Cho, W.; Yan, P.; Xiao, J.; Wang, C.; Cho, J.; Zhang, J.-G., Li- and Mn-Rich Cathode Materials: Challenges to Commercialization. Adv. Energy Mater. 2017, 7, 1601284.
(4) Yu, H.; Zhou, H., High-Energy Cathode Materials (Li2MnO3-LiMO2) for Lithium-Ion Batteries.
J. Phys. Chem. Lett. 2013, 4, 1268-1280.
(5) Koga, H.; Croguennec, L.; Menetrier, M.; Douhil, K.; Belin, S.; Bourgeois, L.; Suard, E.; Weill, F.; Delmas, C., Reversible Oxygen Participation to the Redox Processes Revealed for
Li1.20Mn0.54Co0.13Ni0.13O2. J. Electrochem. Soc. 2013, 160, A786-A792.
(6) Luo, K.; Roberts, M. R.; Hao, R.; Guerrini, N.; Pickup, D. M.; Liu, Y. S.; Edstrom, K.; Guo, J.; Chadwick, A. V.; Duda, L. C.; Bruce, P. G., Charge-compensation in 3d-transition-metal-oxide intercalation cathodes through the generation of localized electron holes on oxygen. Nat. Chem. 2016, 8, 684-691.
(7) Yabuuchi, N.; Takeuchi, M.; Nakayama, M.; Shiiba, H.; Ogawa, M.; Nakayama, K.; Ohta, T.; Endo, D.; Ozaki, T.; Inamasu, T.; Sato, K.; Komaba, S., High-capacity electrode materials for rechargeable lithium batteries: Li3NbO4-based system with cation-disordered rocksalt structure.
Proc. Natl. Acad. Sci. 2015, 112, 7650-7655.
(8) Seo, D. H.; Lee, J.; Urban, A.; Malik, R.; Kang, S.; Ceder, G., The structural and chemical origin of the oxygen redox activity in layered and cation-disordered Li-excess cathode materials. Nat.
Chem. 2016, 8, 692-697.
(9) Zhan, C.; Yao, Z.; Lu, J.; Ma, L.; Maroni, V. A.; Li, L.; Lee, E.; Alp, E. E.; Wu, T.; Wen, J.; Ren, Y.; Johnson, C.; Thackeray, M. M.; Chan, M. K. Y.; Wolverton, C.; Amine, K., Enabling the high capacity of lithium-rich anti-fluorite lithium iron oxide by simultaneous anionic and cationic redox. Nat. Energy 2017, 2, 963-971.
(10) Maitra, U.; House, R. A.; Somerville, J. W.; Tapia-Ruiz, N.; Lozano, J. G.; Guerrini, N.; Hao, R.; Luo, K.; Jin, L.; Perez-Osorio, M. A.; Massel, F.; Pickup, D. M.; Ramos, S.; Lu, X.; McNally, D. E.; Chadwick, A. V.; Giustino, F.; Schmitt, T.; Duda, L. C.; Roberts, M. R.; Bruce, P. G., Oxygen redox chemistry without excess alkali-metal ions in Na2/3[Mg0.28Mn0.72]O2. Nat. Chem. 2018, 10, 288-295.
(11) Li, B.; Jiang, N.; Huang, W.; Yan, H.; Zuo, Y.; Xia, D., Thermodynamic Activation of Charge Transfer in Anionic Redox Process for Li-Ion Batteries. Adv. Funct. Mater. 2018, 28, 1704864. (12) Erickson, E. M.; Schipper, F.; Penki, T. R.; Shin, J.-Y.; Erk, C.; Chesneau, F.-F.; Markovsky, B.;
Aurbach, D., Review—Recent Advances and Remaining Challenges for Lithium Ion Battery Cathodes. J. Electrochem. Soc. 2017, 164, A6341-A6348.
(13) Assat, G.; Delacourt, C.; Corte, D. A. D.; Tarascon, J.-M., Editors' Choice—Practical Assessment of Anionic Redox in Li-Rich Layered Oxide Cathodes: A Mixed Blessing for High Energy Li-Ion Batteries. J. Electrochem. Soc. 2016, 163, A2965-A2976.
(14) Li, B.; Xia, D., Anionic Redox in Rechargeable Lithium Batteries. Adv. Mater. 2017, 29, 1701054.
(15) Assat, G.; Foix, D.; Delacourt, C.; Iadecola, A.; Dedryvere, R.; Tarascon, J. M., Fundamental interplay between anionic/cationic redox governing the kinetics and thermodynamics of lithium-rich cathodes. Nat. Commun. 2017, 8, 2219.
(16) Sathiya, M.; Ramesha, K.; Rousse, G.; Foix, D.; Gonbeau, D.; Prakash, A. S.; Doublet, M. L.; Hemalatha, K.; Tarascon, J. M., High Performance Li2Ru1–yMnyO3(0.2 ≤y≤ 0.8) Cathode
Materials for Rechargeable Lithium-Ion Batteries: Their Understanding. Chem. Mater. 2013, 25, 1121-1131.
(17) Sathiya, M.; Rousse, G.; Ramesha, K.; Laisa, C. P.; Vezin, H.; Sougrati, M. T.; Doublet, M. L.; Foix, D.; Gonbeau, D.; Walker, W.; Prakash, A. S.; Ben Hassine, M.; Dupont, L.; Tarascon, J. M., Reversible anionic redox chemistry in high-capacity layered-oxide electrodes. Nat. Mater. 2013, 12, 827-835.
(18) Sathiya, M.; Abakumov, A. M.; Foix, D.; Rousse, G.; Ramesha, K.; Saubanere, M.; Doublet, M. L.; Vezin, H.; Laisa, C. P.; Prakash, A. S.; Gonbeau, D.; VanTendeloo, G.; Tarascon, J. M., Origin of voltage decay in high-capacity layered oxide electrodes. Nat. Mater. 2015, 14, 230-238. (19) Liu, S.; Liu, Z.; Shen, X.; Li, W.; Gao, Y.; Banis, M. N.; Li, M.; Chen, K.; Zhu, L.; Yu, R.;
Wang, Z.; Sun, X.; Lu, G.; Kong, Q.; Bai, X.; Chen, L., Surface Doping to Enhance Structural Integrity and Performance of Li-Rich Layered Oxide. Adv. Energy Mater. 2018, 8, 1802105. (20) Li, J.; Camardese, J.; Shunmugasundaram, R.; Glazier, S.; Lu, Z.; Dahn, J. R., Synthesis and
Characterization of the Lithium-Rich Core–Shell Cathodes with Low Irreversible Capacity and Mitigated Voltage Fade. Chem. Mater. 2015, 27, 3366-3377.
(21) Pajot, S.; Feydi, P.; Weill, F.; Ménétrier, M.; Yildirim, G.; Simonin, L.; Croguennec, L., Synthesis of Li and Mn-Rich Layered Oxides as Concentration-Gradients for Lithium-Ion Batteries. J. Electrochem. Soc. 2018, 165, A425-A433.
(22) McCalla, E.; Abakumov, A. M.; Saubanere, M.; Foix, D.; Berg, E. J.; Rousse, G.; Doublet, M. L.; Gonbeau, D.; Novak, P.; Van Tendeloo, G.; Dominko, R.; Tarascon, J. M., Visualization of O-O peroxo-like dimers in high-capacity layered oxides for Li-ion batteries. Science 2015, 350, (6267), 1516-1521.
(23) Pearce, P. E.; Perez, A. J.; Rousse, G.; Saubanere, M.; Batuk, D.; Foix, D.; McCalla, E.; Abakumov, A. M.; Van Tendeloo, G.; Doublet, M. L.; Tarascon, J. M., Evidence for anionic redox activity in a tridimensional-ordered Li-rich positive electrode beta-Li2IrO3. Nat. Mater.
2017, 16, 580-586.
(24) Hong, J.; Gent, W. E.; Xiao, P.; Lim, K.; Seo, D. H.; Wu, J.; Csernica, P. M.; Takacs, C. J.; Nordlund, D.; Sun, C. J.; Stone, K. H.; Passarello, D.; Yang, W.; Prendergast, D.; Ceder, G.; Toney, M. F.; Chueh, W. C., Metal-oxygen decoordination stabilizes anion redox in Li-rich oxides. Nat. Mater. 2019, 18, 256-265.
(25) Li, L.; Castro, F. C.; Park, J. S.; Li, H.; Lee, E.; Boyko, T. D.; Freeland, J. W.; Yao, Z.; Fister, T. T.; Vinson, J.; Shirley, E. L.; Wolverton, C.; Cabana, J.; Dravid, V. P.; Thackeray, M. M.; Chan, M. K. Y., Probing Electrochemically Induced Structural Evolution and Oxygen Redox Reactions in Layered Lithium Iridate. Chem. Mater. 2019, 31, 4341-4352.
(26) Croy, J. R.; Gallagher, K. G.; Balasubramanian, M.; Chen, Z.; Ren, Y.; Kim, D.; Kang, S.-H.; Dees, D. W.; Thackeray, M. M., Examining Hysteresis in Composite xLi2MnO3·(1–x)LiMO2 Cathode Structures. J. Phys. Chem. C 2013, 117, 6525-6536.
(27) Vassiliev, S. Y.; Levin, E. E.; Presnov, D. E.; Nikitina, V. A., Electrochemical Patterns of Phase Transforming Intercalation Materials: Diagnostic Criteria for the Case of Slow Nucleation Rate Control. J. Electrochem. Soc. 2019, 166, A829-A837.
(28) Montella, C., Discussion of the potential step method for the determination of the diffusion coefficients of guest species in host materials: Part I. Influence of charge transfer kinetics and ohmic potential drop. J. Electroanal. Chem. 2002, 518, 61-83.
(29) Montella, C., Apparent diffusion coefficient of intercalated species measured with PITT: A simple formulation. Electrochim. Acta 2006, 51, 3102-3111.
(30) Bardé, F.; Palacin, M. R.; Chabre, Y.; Isnard, O.; Tarascon, J. M., In Situ Neutron Powder Diffraction of a Nickel Hydroxide Electrode. Chem. Mater. 2004, 16, 3936-3948.
(31) Bruce, P. G.; Scrosati, B.; Tarascon, J. M., Nanomaterials for rechargeable lithium batteries.
(32) Doe, R. E.; Persson, K. A.; Meng, Y. S.; Ceder, G., First-Principles Investigation of the Li−Fe−F Phase Diagram and Equilibrium and Nonequilibrium Conversion Reactions of Iron Fluorides with Lithium. Chem. Mater. 2008, 20, 5274-5283.
(33) Li, L.; Jacobs, R.; Gao, P.; Gan, L.; Wang, F.; Morgan, D.; Jin, S., Origins of Large Voltage Hysteresis in High-Energy-Density Metal Fluoride Lithium-Ion Battery Conversion Electrodes. J.
Am. Chem. Soc. 2016, 138, (8), 2838-2848.
(34) Meggiolaro, D.; Gigli, G.; Paolone, A.; Reale, P.; Doublet, M. L.; Brutti, S., Origin of the Voltage Hysteresis of MgH2 Electrodes in Lithium Batteries. J. Phys. Chem. C 2015, 119, 17044-17052.
(35) Khatib, R.; Dalverny, A. L.; Saubanère, M.; Gaberscek, M.; Doublet, M. L., Origin of the Voltage Hysteresis in the CoP Conversion Material for Li-Ion Batteries. J. Phys. Chem. C 2013, 117, 837-849.
(36) Cabana, J.; Monconduit, L.; Larcher, D.; Palacin, M. R., Beyond intercalation-based Li-ion batteries: the state of the art and challenges of electrode materials reacting through conversion reactions. Adv. Mater. 2010, 22, E170-E192.
(37) Zheng, T., Hysteresis during Lithium Insertion in Hydrogen-Containing Carbons. J. Electrochem.
Soc. 1996, 143, 2137-2145.
(38) Dreyer, W.; Jamnik, J.; Guhlke, C.; Huth, R.; Moskon, J.; Gaberscek, M., The thermodynamic origin of hysteresis in insertion batteries. Nat. Mater. 2010, 9, 448-453.
(39) Dogan, F.; Long, B. R.; Croy, J. R.; Gallagher, K. G.; Iddir, H.; Russell, J. T.; Balasubramanian, M.; Key, B., Re-entrant lithium local environments and defect driven electrochemistry of Li- and Mn-rich Li-ion battery cathodes. J. Am. Chem. Soc. 2015, 137, 2328-2335.
(40) Jacquet, Q.; Iadecola, A.; Saubanere, M.; Li, H.; Berg, E. J.; Rousse, G.; Cabana, J.; Doublet, M. L.; Tarascon, J. M., Charge Transfer Band Gap as an Indicator of Hysteresis in Li-Disordered Rock Salt Cathodes for Li-Ion Batteries. J. Am. Chem. Soc. 2019, 141, 11452-11464.
(41) Taylor, Z. N.; Perez, A. J.; Coca-Clemente, J. A.; Braga, F.; Drewett, N. E.; Pitcher, M. J.; Thomas, W. J.; Dyer, M. S.; Collins, C.; Zanella, M.; Johnson, T.; Day, S.; Tang, C.; Dhanak, V. R.; Claridge, J. B.; Hardwick, L. J.; Rosseinsky, M. J., Stabilization of O-O Bonds by d(0) Cations in Li4+xNi1-xWO6 (0 <= x <= 0.25) Rock Salt Oxides as the Origin of Large Voltage Hysteresis. J. Am. Chem. Soc. 2019, 141, 7333-7346.
(42) Assat, G.; Glazier, S. L.; Delacourt, C.; Tarascon, J.-M., Probing the thermal effects of voltage hysteresis in anionic redox-based lithium-rich cathodes using isothermal calorimetry. Nat. Energy 2019, 4, 647-656.
(43) Lee, E.-S.; Nam, K.-W.; Hu, E.; Manthiram, A., Influence of Cation Ordering and Lattice Distortion on the Charge–Discharge Behavior of LiMn1.5Ni0.5O4 Spinel between 5.0 and 2.0 V.
Chem. Mater. 2012, 24, 3610-3620.
(44) Kang, S.-H.; Yoon, W.-S.; Nam, K.-W.; Yang, X.-Q.; Abraham, D. P., Investigating the first-cycle irreversibility of lithium metal oxide cathodes for Li batteries. J. Mater. Sci. 2008, 43, 4701-4706.
(45) Kasnatscheew, J.; Evertz, M.; Streipert, B.; Wagner, R.; Klopsch, R.; Vortmann, B.; Hahn, H.; Nowak, S.; Amereller, M.; Gentschev, A. C.; Lamp, P.; Winter, M., The truth about the 1st cycle Coulombic efficiency of LiNi1/3Co1/3Mn1/3O2 (NCM) cathodes. Phys. Chem. Chem. Phys. 2016, 18, 3956-3965.
(46) Robert, R.; Novák, P., Switch of the Charge Storage Mechanism of LixNi0.80Co0.15Al0.05O2 at Overdischarge Conditions. Chem. Mater. 2018, 30, 1907-1911.
(47) Mueller-Neuhaus, J. R.; Dunlap, R. A.; Dahn, J. R., Understanding Irreversible Capacity in LixNi1−yFeyO2 Cathode Materials. J. Electrochem. Soc. 2000, 147, 3598-3605.
(48) Van der Ven, A., Lithium Diffusion in Layered LixCoO2. Electrochem. Solid-State Lett. 1999, 3, 301-304.