HAL Id: hal-01843989
https://hal.archives-ouvertes.fr/hal-01843989
Submitted on 19 Jul 2018
HAL is a multi-disciplinary open access
archive for the deposit and dissemination of
sci-entific research documents, whether they are
pub-lished or not. The documents may come from
teaching and research institutions in France or
abroad, or from public or private research centers.
L’archive ouverte pluridisciplinaire HAL, est
destinée au dépôt et à la diffusion de documents
scientifiques de niveau recherche, publiés ou non,
émanant des établissements d’enseignement et de
recherche français ou étrangers, des laboratoires
publics ou privés.
Geographic Variations of Stroke Hospitalization across
France: A Diachronic Cluster Analysis
Yacine Lachkhem, Etienne Minvielle, Stéphane Rican
To cite this version:
Yacine Lachkhem, Etienne Minvielle, Stéphane Rican. Geographic Variations of Stroke Hospitalization
across France: A Diachronic Cluster Analysis. Stroke Research and Treatment, Hindawi, 2018, 2018,
pp.1-6. �10.1155/2018/1897569�. �hal-01843989�
Research Article
Geographic Variations of Stroke Hospitalization across France:
A Diachronic Cluster Analysis
Yacine Lachkhem
,
1Étienne Minvielle,
1,2and Stéphane Rican
31Equipe d’Accueil Management des Organisations de Sant´e, French School of Public Health, avenue du Professeur L´eon-Bernard,
35043 Rennes, France
2Gustave Roussy Cancer Center, 114 rue Edouard Vaillant, 94805 Villejuif, France 3LADYSS, Paris Nanterre University, F92000 Nanterre, France
Correspondence should be addressed to Yacine Lachkhem; yacine.lachkhem@ehesp.fr Received 9 March 2018; Accepted 12 June 2018; Published 18 July 2018
Academic Editor: Tauheed Ishrat
Copyright © 2018 Yacine Lachkhem et al. This is an open access article distributed under the Creative Commons Attribution License, which permits unrestricted use, distribution, and reproduction in any medium, provided the original work is properly cited.
Background. This study evaluates the clustering of hospitalization rates for stroke and compares this clustering with two different
time intervals 2009-2010 and 2012-2013, corresponding to the beginning of the French National Stroke Plan 2010–2014. In addition, these data will be compared with the deployment of stroke units as well as socioeconomic and healthcare characteristics at zip code level. Methods. We used the PMSI data from 2009 to 2013, which lists all hospitalizations for stroke between 2009 and 2013, identified on the most detailed geographic scale allowed by this database. We identify statistically significant clusters with high or low rates in the zip code level using the Getis-Ord statistics. Each of the significant clusters is monitored over time and evaluated according to the nearest stroke unit distance and the socioeconomic profile. Results. We identified clusters of low and high rate of stroke hospitalization (23.7% of all geographic codes). Most of these clusters are maintained over time (81%) but we also observed clusters in transition. Geographic codes with persistent high rates of stroke hospitalizations were mainly rural (78% versus 17%, P< .0001) and had a least favorable socioeconomic and healthcare profile. Conclusion. Our study reveals that high-stroke hospitalization rates cluster remains the same during our study period. While access to the stroke unit has increased overall, it remains low for these clusters. The socioeconomic and healthcare profile of these clusters are poor but variations were observed. These results are valuable tools to implement more targeted strategies to improve stroke care accessibility and reduce geographic disparities.
1. Introduction
Stroke is a leading cause of death, adult long-term disability, and loss of quality-adjusted life years in western countries [1]. It is a major public health issue with an increasing economic and social burden given the aging population context (the risk of stroke increases with age) and the potentially devastating consequences for survivors [2]. Stroke management requires neurology expertise and specific resources in a restrictive timeframe.
Geographic variations of stroke risk have been revealed at various scales. In the US, the so-called “stroke belt ”, has been monitored since 1939 [3]. Across Europe, an east-west decreasing gradient has been observed by compiling multi-ple stroke registries [4]. In France, recent studies reported
association between increasing neighborhood deprivation and stroke mortality [5, 6]. Because access to stroke care can explain a part of these variations, the French ministry of health launched the Stroke National Action Plan, 2010–2014. One of the objectives of this plan was to increase the deployment of stroke units in order to constitute a regional stroke care network with these units at the center of the care pathway.
Various studies focused on the identification of the barriers influencing stroke care and showed a wide spectrum of factors, related to the patient (stroke knowledge, age, stroke severity, etc.) [7] and to the spatial (deprivation areas, distance, etc.) [8] or organizational factors (transport modal-ity, prenotification, etc.) [9] or associated with physicians training [10]. In this context, interventions to improve care
Volume 2018, Article ID 1897569, 6 pages https://doi.org/10.1155/2018/1897569
2 Stroke Research and Treatment pathways have, on the one hand, pushed towards a global
approach by supporting the implementation of combined interventions that cover all the acute care pathway [11]. On the other hand, to increase efficiency, these interventions must also be targeted. Spatial statistics methods prove to be valuable tools in a public health approach aimed at identifying risk areas where it appears relevant to strengthen, adapt, or prioritize action.
We used zip code level data and spatial statistics to identify geographic clusters of high and low rate of stroke hospitalization from 2009–2010 to 2012–2013 in a nationwide analysis. We them compared to stroke unit spreading to assess accessibility and used socioeconomic, healthcare, and environmental data to characterize identified clusters.
2. Method
2.1. Study Population. The main variable of our study is the
stroke hospitalization rate. We extracted all hospitalizations for stroke from the national PMSI database. The PMSI (Programme de M´edicalisation des Syst`emes d’Information) is the French Medical Information System provided by the ATIH (Technical Agency for Information on Hospitalization) which covers all French public and private hospitals. Stroke hospitalization was selected using the ICD-10 code (10th revi-sion of the International Statistical Classification of Diseases and Related Health Problems) referring to cerebrovascular disease (I60, I61, I62, I63, I64, and G46) recorded as a principal discharge diagnosis. These data have been extracted for two periods: 2009-2010 and 2012-2013 and restricted to France Metropolitan Area. All hospitalizations were assigned to PMSI geographic codes available in the database which indicate where the patient lives and correspond to ZIP codes. Hospital stays ending and stroke unit admission were also extracted. Two-year stroke hospitalization rates were calculated for each period and standardized on age and sex using the 2011 French census population as reference and we used the Empirical-Bayes standardization method to account for the variance instability caused by small population size.
Healthcare, environmental, and socioeconomic variables were collected at the PMSI code level. Healthcare profile is described by the distance between the patient and the location of its hospital admission, calculated using OSRM engine (Open Source Routing Machine) and GP (General Practitioner) accessibility and availability using the LPA indi-cator of 2010 and 2013. The Local Potential Accessibility (LPA) is a local indicator of accessibility applied to GP that also considers healthcare supply and demand factors in neighbor-ing municipalities. Urban/rural profiles were collected from 2010 INSEE (Institut National de la Statistique et des Etudes Economiques: The French National Institute for Statistics and Economic Studies) two-level typology (urban/rural and city center, suburb, isolated city, and rural areas). Finally, the socioeconomic profile was estimated using the FDep deprivation index that considers four variables: average household income, percentage of high school graduates in the
population aged≤15 years, percentage of blue-collar workers
in the active population, and unemployment rate [12].
2.2. Spatial Clustering Analysis. To understand where on
the landscape clustering of stroke hospitalization rates may be occurring, Getis-Ord Gi∗ statistics were used [13]. The clustering was assessed at national scale. We used the Gi∗ statistics at France Metropolitan Area scale to identify the location of significant hotspots/coldspots clusters of stroke hospitalization rate using first-order queen contiguity spatial weight and nine hundred ninety-nine Monte Carlo
replica-tions at 𝑃 value less than 0.05. Hotspots represent higher
hospitalization rates than would be expected if distribution was random, while coldspots represent lower hospitalization rates than would be expected if distribution was random. In terms of temporal trends, we follow the approach of
Schieb et al. and compare Gi∗ for 2009–2010 with clusters for
2012–2013 by categorizing them as persistent and transitional clusters [14].
All spatial clustering analysis was implemented in GeoDA software, statistical analysis was performed using JMP 13 (SAS Institute Inc., Cary, NC), and mapping was performed in ArcGIS 10.5 (Esri). According to French governmental regulations, the examination of the study protocol by the National Ethics Committee was not required.
3. Results
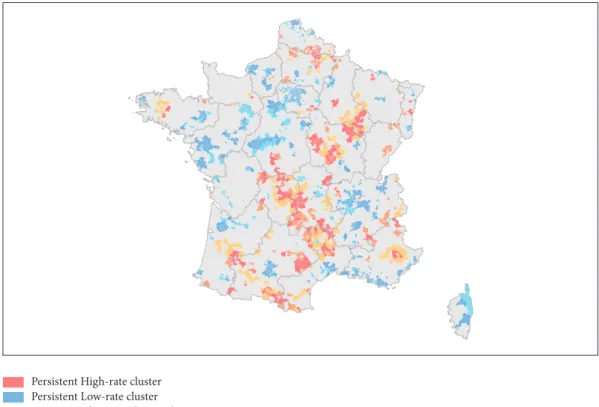
Our two study periods represent 405,874 stroke hospitaliza-tions. The age-sex-adjusted stroke hospitalization rate was 169 per 100,000 during 2009–2010 and increased to 179 per 100,000 during 2012–2013. Cluster analysis conducted at the national scale using the Gi∗ statistic identified areas where the stoke hospitalization rate was statistically higher. These high rate clusters represent 5.3% of all geographic codes (n = 303) and were mainly located along a northeast/southwest axis and sparkled in various regions such as Bretagne, Rhˆone-Alpes, Nord-Pas-de-Calais, and southwest regions.
18.4% of all geographic codes are low rate clusters and were mainly observed in the northwest region such as Haute-Normandie, ˆIle-de-France, a large part of the Center region, and Pays-de-la-Loire. We also observed these clusters along the Mediterranean coast and in the Rhˆone-Alpes region. In both cases, we find a similar distribution over the previous study period.
Regarding the comparison between Gi∗ clusters
2009–2010 and 2012–2013, 48% of high rate clusters remained over the two-study period (n = 177) with the same spatial pattern despite a decreasing area (see Figure 1). If the northeast/southwest axis remained, regional singularities identified earlier are attenuated. Regarding low rate clusters, 81% of them identified in 2009–2010 remained in 2012–2013 (n = 841) with a reinforcement of the axis from the ˆIle-de-France region to the Pays-de-la-Loire regions. Geographic code that transitioned into high rate clusters was mainly located along the northeast/southwest axis and close to high rate clusters in Nord-Pas-de-Calais, Picardie, or the southwest. We also identified geographic codes that transitioned out of high rate clusters. It represents 14% of the statistically significant clusters and shared a similar spatial pattern.
Clusters of age-sex-adjusted stroke hospitalization rate in France, 2009-10 and 2012-13
Persistent High-rate cluster Persistent Low-rate cluster Transitioned into High-rate cluster Transitioned out of High-rate cluster Transitioned into Low-rate cluster Not significant
Figure 1: Clusters of age-sex-adjusted stroke hospitalization rate in France, 2009-2010 and 2012-2013.
Healthcare and socioeconomic profiles of geographic codes can be compared in Table 1. In general, geographic codes located in a persistent high rate cluster had a disad-vantageous healthcare and socioeconomic profile compared to geographic codes identified in a persistent low rate clusters. Mainly located in a rural area, high rate cluster was described with longest admission travel (42.4 min versus 29.3 min,
P <.0001) and lower accessibility to stroke units (29.5%
admissions versus 40.5%, P<.0001). In-hospital mortality was
significantly higher (15.3%, P<.0001) and only accessibility
to the GP was similar. In terms of socioeconomic conditions, persistent high rate cluster reported a higher rate of
disad-vantaged geographic codes (31.1% versus 11.1%, P <.0001).
Regarding transitioned clusters, we observe a similar trend between geographic codes that transitioned into or out of a high rate cluster and a persistent high rate cluster. Geographic codes that transitioned into a low rate cluster were described as a hybrid profile. Geographic codes that transition into a high rate cluster had better accessibility to stroke units where geographic codes that transitioned out of a high rate cluster were more distant. Geographic codes that transitioned into a low rate cluster were described by an urban-rural balance and a distance and accessibility to the average between high and low rate cluster.
4. Discussion
Our study reveals that high rate geographic codes (N= 177) were mainly located in a northeast/southwest axis and small clusters are sparkled at regional and interregional scales. Low rate geographic codes (N= 841) were observed in an axis between ˆIle-de-France and Pays-de-la-Loire region and in a second axis between Rhˆone-Alpes and Bouche du Rhˆone region. The observed geographic code remains stable between the two study periods. However, we observed some variations: 126 geographic codes transitioned into high rate clusters, 189 transitioned out of high rate clusters, and 200 transitioned into low rate clusters.
Geographic codes with persistent high rates of stroke hospitalizations were mainly rural and had a least favorable socioeconomic and healthcare profile. These findings are consistent with previous studies assessing such relationships. Associations between neighborhood deprivation and stroke have been reported across the entire stroke care pathway. In Japan, a large population based prospective study of 91,723 men and women aged 40–69 years reported the impact of neighborhood deprivation level (i.e., the proportions of elderly couple households, elderly single households, single-mother households, sales and service workers, agricultural workers, blue-collar workers, and unemployed persons) on
4 Stroke Research and Treatment T a b le 1: C o m p ariso n o f p ers is ten t h ig h-ra te cl us ters w ith p ers is ten t lo w -ra te cl us ters an d tra n si tio nal cl u sters . P er si ste n t cl u ste rs T ran si ti one d cl u ste rs H ig h -ra te L o w -ra te P val u e In to H ig h-ra te P val ue O u t o f H ig h -ra te P val ue In to L o w -ra te P val ue N u m b er o f cl u st er s 17 7 841 12 6 18 9 20 0 N u m b er o f p atien ts ,20 0 9/1 0 38 50 56 97 8 < ,000 1 29 21 < ,000 1 39 00 < ,000 1 81 03 < ,000 1 N u m b er o f p atien ts ,2 01 2/1 3 4 0 4 2 61 43 3 < ,000 1 31 11 < ,000 1 4 0 19 < ,000 1 8068 < ,000 1 Ur b an /R u ra l R u ra l 78 % 17 % < ,000 1 77 % 0 ,7 4 09 83 % 0 ,1 85 4 4 4 ,2 % < ,0 0 0 1 U rba n 22% 83 % < ,000 1 23 % 0 ,7 4 09 17 % 0 ,1 85 4 55 ,8 % < ,0 0 0 1 Amo n g u rba n uni t Ci ty cen ter 7% 7% 0,7 12 3 7% 0,9 38 3 4% 0,1 94 9 7, 6% 0,8 39 3 Su b u rb 10 % 70 % < ,0 0 0 1 13% 0,5 279 9% 0,7 43 0 42,1 % < ,0 0 0 1 Is o la ted ci ty 4% 6% 0,2051 3% 0,5 6 41 4% 0,8 28 7 6,1 % 0,3 88 6 H eal thca re A d m is si o n to SU 29 ,5% 4 0,5% < ,0 0 0 1 35,3% 0,0 28 1 30 ,3% 0 ,7 55 4 35,9 0 ,0 0 61 N ea res t SU (min) 55,3 17 ,1 < ,000 1 49 ,1 < ,000 1 61 ,1 < ,000 1 31 ,6 < ,0 0 0 1 A dmi ssi o n di st an ce (m in ) 4 2, 4 29 ,3 < ,0 0 0 1 4 1,0 0 ,6 57 2 4 8,8 0 ,0 217 34,4 0 ,0 03 5 St ay ou tp u t H o m e 4 6 ,4 % 53 ,0 % < ,0 0 0 1 51,5% 0,0 0 19 47 ,4% 0 ,5113 51,0% 0 ,0 015 Dea th 15,3% 13,9 % < ,000 1 15 ,4 % 0 ,9 26 9 17 ,4 % 0 ,0 36 1 16 ,1 % 0 ,4009 M u ta tio n 10,7% 8,2% 0 ,0 017 8,9 % 0 ,10 36 10,0% 0,5 0 94 9, 4% 0,179 0 T ra n sf er 27 ,6% 24,9 % 0,01 05 24 ,3% 0 ,0 270 25,2% 0,07 67 23 ,5% 0 ,0 02 7 GP ac ce ssi b il it y 20 13 4 8, 9 62 ,7 < ,0 0 0 1 4 7,9 0 ,6 57 5 4 5,9 0 ,17 10 62,2 0 ,0 25 6 So ci o ec o n o mic F De p in d ex 31 ,1% 11,1% < ,000 1 30 ,2 % 0 ,04 9 0 26 ,5 % < ,000 1 14 ,0 % < ,000 1
stroke incidence even after adjustment for individual socioe-conomic indicators [15]. A Danish study observed reduced odds of having good-quality acute treatment and increased mortality for low socioeconomic status patients (defined as income, education, or occupation) [16].
In our study, healthcare situation has been observed using both GP and stroke unit accessibility. Our findings revealed no association with GP access. However, high rate clusters were mainly located in rural areas with longer distance and poorer admission rate to stroke unit. These results are consistent with studies exploring geographic disparities of stroke hospitalization. In Florida, excess risks of stroke hospitalization and mortality have been located in north, more rural compared to the rest of the state [17]. Difference has also been observed in stroke management and poststroke rehabilitation [18, 19]. These works revealed suboptimal care provided in rural area with significant care quality dispari-ties.
During our study period, 43 stroke units were created in France. Globally, distance to stroke reduces from 45.5 min to 36.6 min and stroke unit admission increased from 23.3% to 40.4%. However, for persistent high rate clusters, stroke unit accessibility did not reduce significantly. While rural-urban health disparities are widely recognized and documented, our study identified two points to highlight. First, issues observed in rural areas are complex and cannot be addressed in a standardized way. Observed cumulative disadvantages differ according to the areas analyzed indicating heterogeneous weight of associated factors. Second, stroke unit accessibility for areas with low-populated areas raises the question of the cost/benefit of major stroke unit deployment. Even if at patient-level, the benefit would be clear, the heavy resource investment compared to the small number of patients who benefit from it remains expensive for the health system, forcing us to explore specific strategies for these areas.
In France, a telestroke network has been tested in three pilot regions according to the Stroke Plan 2010–2014 and appeared to be effective and safe with an increase of the proportion of patients who will access thrombolysis [20]. It is consistent with longer experienced telestroke network which showed an increase of access to stroke unit and thrombolysis rates and associated with long-term improve-ment in terms of quality indicators of acute hospital care [21]. Complementary thinking should also be conducted on organizational change. Implementation of a hub and spoke model provides successful evidence for improving stroke care in rural locations. In New South Wales (Australia), a historical control cohort study reports improved stroke care in rural hospital with increase of patients discharged home after the implementation of a hub and spoke model driven by clinical coordinators [22].
This study is not without limitations. First, it is a nation-wide study using administrative data. Parameters applied for the analysis at this scale do not allow us to report on variations appearing at regional scale. Because of the absence of distinction between first-ever and recurrent stroke on the database, we used the algorithm of patient selection already used by other French studies using the national PMSI database [23]. Second, if geographic codes can mostly be
referred to as zip codes, municipalities under 1000 inhabitants are aggregated according to the anonymity constraints.
This study identified persistent high rate stroke hospi-talization clusters with their socioeconomic and healthcare characteristics helping to prioritize interventions. The spa-tiotemporal approach is also relevant because it attempts to highlight dynamics by identifying geographic codes that transitioned into high or low rate clusters, regarding stroke unit deployment efforts. Several studies use spatial statistics method in stroke but also in breast cancer [24], lower respiratory tract infection [25], or suicide [26] and make it an essential decision-making tool to implement effective strate-gies to improve health and reduce geographic disparities.
In France, geographic disparities of stroke hospitalization exist. Stroke high rate hospitalization clusters were mainly located in rural areas, with longer distance to stroke unit and low socioeconomic characteristics. To attain these areas, new strategies should be adopted that consider these isolated areas and associated factors. Several works observed the persistent disadvantage of rural areas, explained by the combination of lack of healthcare facilities and demographic/socioeconomic factors [27, 28]. Implementation of telemedicine strategy to bypass the distance threshold and organized stroke care to improve the efficacy of available resources are strategic. But because stroke factors are complex, global approach became fundamental and should be context-based, targeting public prevention with various vectors and mobilizing all parts of the stroke care chain.
Data Availability
The data used to support the findings of this study are available from the corresponding author upon request.
Conflicts of Interest
The authors declare that they have no conflicts of interest.
References
[1] C. D. Mathers and D. Loncar, “Projections of global mortality and burden of disease from 2002 to 2030,” PLoS Medicine, vol. 3, no. 11, article e442, 2006.
[2] S. C. Johnston, S. Mendis, and C. D. Mathers, “Global variation in stroke burden and mortality: estimates from monitoring, surveillance, and modelling,” The Lancet Neurology, vol. 8, no. 4, pp. 345–354, 2009.
[3] D. J. Lanska, “Geographic distribution of stroke mortality in the United States: 1939- 1941 to 1979-1981,” Neurology, vol. 43, no. 9, pp. 1839–1851, 1993.
[4] Y. Bejot, “What has changed for stroke at the beginning of the 21st century,” Rev Neurol (Paris), vol. 165, no. 8-9, pp. 617–625, 2009.
[5] O. Grimaud, Y. B´ejot, Z. Heritage et al., “Incidence of stroke and socioeconomic neighborhood characteristics: An ecological analysis of dijon stroke registry,” Stroke, vol. 42, no. 5, pp. 1201– 1206, 2011.
[6] A. Roussot, J. Cottenet, M. Gadreau, M. Giroud, Y. B´ejot, and C. Quantin, “The use of national administrative data
6 Stroke Research and Treatment
to describe the spatial distribution of in-hospital mortality following stroke in France, 2008-2011,” International Journal of
Health Geographics, vol. 15, no. 1, article no. 2, 2016.
[7] Y. Teuschl and M. Brainin, “Stroke education: Discrepancies among factors influencing prehospital delay and stroke knowl-edge,” International Journal of Stroke, vol. 5, no. 3, pp. 187–208, 2010.
[8] J. Addo, L. Ayerbe, K. M. Mohan et al., “Socioeconomic status and stroke: an updated review,” Stroke, vol. 43, no. 4, pp. 1186– 1191, 2012.
[9] K. Fassbender, C. Balucani, S. Walter, S. R. Levine, A. Haass, and J. Grotta, “Streamlining of prehospital stroke management: The golden hour,” The Lancet Neurology, vol. 12, no. 6, pp. 585–596, 2013.
[10] R. El Khoury, R. Jung, A. Nanda et al., “Overview of key factors in improving access to acute stroke care,” Neurology, vol. 79, no. 13, pp. S26–S34, 2012.
[11] M. Bouckaert, R. Lemmens, and V. Thijs, “Reducing prehospital delay in acute stroke,” Nature Reviews Neurology, vol. 5, no. 9, pp. 477–483, 2009.
[12] F. Windenberger, S. Rican, E. Jougla, and G. Rey, “Spatiotem-poral association between deprivation and mortality: Trends in France during the nineties,” European Journal of Public Health, vol. 22, no. 3, pp. 347–353, 2012.
[13] A. Getis and J. K. Ord, “The analysis of spatial association by use of distance statistics,” Geographical Analysis, vol. 24, no. 3, pp. 189–206, 1992.
[14] L. J. Schieb, L. R. Mobley, M. George, and M. Casper, “Tracking stroke hospitalization clusters over time and associations with county-level socioeconomic and healthcare characteristics,”
Stroke, vol. 44, no. 1, pp. 146–152, 2013.
[15] K. Honjo, H. Iso, T. Nakaya et al., “Impact of Neighborhood Socioeconomic Conditions on the Risk of Stroke in Japan,”
Journal of Epidemiology, vol. 25, no. 3, pp. 254–260, 2015.
[16] V. Langagergaard, K. H. Palnum, F. Mehnert et al., “Socioeco-nomic differences in quality of care and clinical outcome after stroke: A nationwide population-based study,” Stroke, vol. 42, no. 10, pp. 2896–2902, 2011.
[17] S. Roberson, M. Dutton, M. Macdonald, and A. Odoi, “Does place of residence or time of year affect the risk of stroke hospitalization and death? A descriptive spatial and temporal epidemiologic study,” PLoS ONE, vol. 11, no. 1, Article ID e0145224, 2016.
[18] E. C. Leira, D. C. Hess, J. C. Torner, and H. P. Adams Jr., “Rural-urban differences in acute stroke management practices: A modifiable disparity,” JAMA Neurology, vol. 65, no. 7, pp. 887– 891, 2008.
[19] M. E. Sandel, H. Wang, J. Terdiman et al., “Disparities in Stroke Rehabilitation: Results of a Study in an Integrated Health System in Northern California,” PM&R : The Journal of Injury,
Function, and Rehabilitation, vol. 1, no. 1, pp. 29–40, 2009.
[20] N. Legris, M. Hervieu-B`egue, B. Daubail et al., “Telemedicine for the acute management of stroke in Burgundy, France: an evaluation of effectiveness and safety,” European Journal of
Neurology, vol. 23, no. 9, pp. 1433–1440, 2016.
[21] P. M¨uller-Barna, G. J. Hubert, S. Boy et al., “Telestroke units serving as a model of care in rural areas: 10-year experience of the telemedical project for integrative stroke care,” Stroke, vol. 45, no. 9, pp. 2739–2744, 2014.
[22] D. A. Cadilhac, T. Purvis, M. F. Kilkenny et al., “Evaluation of rural stroke services does implementation of coordinators and
pathways improve care in rural hospitals?” Stroke, vol. 44, no. 10, pp. 2848–2853, 2013.
[23] C. De Peretti et al., “Personnes hospitalis´ees pour accident vasculaire c´er´ebral en France?: tendances 2002-2008,” BEH, vol. 10-11, p. 125, 2002.
[24] Z. Tatalovich, L. Zhu, A. Rolin, D. R. Lewis, L. C. Harlan, and D. M. Winn, “Geographic disparities in late stage breast cancer incidence: Results from eight states in the United States,”
International Journal of Health Geographics, vol. 14, no. 1, article
no. 31, 2015.
[25] A. F. Beck, T. A. Florin, S. Campanella, and S. S. Shah, “Geographic variation in hospitalization for lower respiratory tract infections across one county,” JAMA Pediatrics, vol. 169, no. 9, pp. 846–854, 2015.
[26] M. Torok, P. Konings, P. J. Batterham, and H. Christensen, “Spatial clustering of fatal, and non-fatal, suicide in new South Wales, Australia: Implications for evidence-based prevention,”
BMC Psychiatry, vol. 17, no. 1, 2017.
[27] M. S. Phipps, H. Jia, N. R. Chumbler et al., “Rural-Urban differences in inpatient quality of care in US veterans with ischemic stroke,” The Journal of Rural Health, vol. 30, no. 1, pp. 1–6, 2014.
[28] D. A. Cadilhac, M. F. Kilkenny, M. Longworth, M. R. P. Pollack, and C. R. Levi, “Metropolitan-rural divide for stroke outcomes: Do stroke units make a difference?” Internal Medicine Journal, vol. 41, no. 4, pp. 321–326, 2011.
Stem Cells
International
Hindawi www.hindawi.com Volume 2018 Hindawi www.hindawi.com Volume 2018 INFLAMMATIONEndocrinology
International Journal ofHindawi www.hindawi.com Volume 2018 Hindawi www.hindawi.com Volume 2018
Disease Markers
Hindawi www.hindawi.com Volume 2018 BioMed Research InternationalOncology
Journal of Hindawi www.hindawi.com Volume 2013 Hindawi www.hindawi.com Volume 2018Oxidative Medicine and Cellular Longevity
Hindawi
www.hindawi.com Volume 2018
PPAR Research
Hindawi Publishing Corporationhttp://www.hindawi.com Volume 2013 Hindawi www.hindawi.com
The Scientific
World Journal
Volume 2018 Immunology Research Hindawi www.hindawi.com Volume 2018 Journal ofObesity
Journal of Hindawi www.hindawi.com Volume 2018 Hindawi www.hindawi.com Volume 2018 Computational and Mathematical Methods in Medicine Hindawi www.hindawi.com Volume 2018Behavioural
Neurology
Ophthalmology
Journal of Hindawi www.hindawi.com Volume 2018Diabetes Research
Journal ofHindawi
www.hindawi.com Volume 2018
Hindawi
www.hindawi.com Volume 2018 Research and Treatment
AIDS
Hindawi
www.hindawi.com Volume 2018
Gastroenterology Research and Practice
Hindawi www.hindawi.com Volume 2018