O
pen
A
rchive
T
OULOUSE
A
rchive
O
uverte (
OATAO
)
OATAO is an open access repository that collects the work of Toulouse researchers and makes it freely available over the web where possible.
This is an author-deposited version published in : http://oatao.univ-toulouse.fr/
Eprints ID : 10898
To link to this article : DOI:10.1016/j.proeng.2012.07.525
URL : http://dx.doi.org/10.1016/j.proeng.2012.07.525
To cite this version : Dorai, Ferdaous and Rolland, Matthieu and
Wachs, Anthony and Marcoux, Manuel and Climent, Eric Packing
fixed bed reactors with cylinders: influence of particle length distribution. (2012) In: 20th International Congress of Chemical and
Process Engineering - CHISA 2012, 25 August 2012 - 29 August 2012 (Prague, Czech Republic)
Any correspondance concerning this service should be sent to the repository administrator: [email protected]
20
thInternational Congress of Chemical and Process Engineering CHISA 2012
25 – 29 August 2012, Prague, Czech Republic
Packing fixed bed reactors with cylinders: Influence of
particle length distribution
F. Dorai
aa*, M. Rolland
a, A. Wachs
a, M. Marcoux
band E. Climent
ba : IFPEN, Rond Point de l'Echangeur de Solaize, 69390 Solaize, France b : IMFT, 1 Allée du Professeur Camille Soula, 31400 Toulouse, France
Abstract
In this work, we are interested in a better understanding of the local packing structure of fixed bed reactors made of cylindrical pellets packed in cylindrical tubes. Packing of cylindrical particles is simulated using Grains3D DEM code and results are analyzed in terms of void fraction using 3D analysis tools. With tube diameter as a secondary parameter, we investigate the porous structure depending on the pellet length distribution: average porosity, radial porosity, orientation of the pellets and variability of those indicators when repeating the numerical experiments.
Keywords : Fixed bed; packing; cylindrical particle; void fraction; DEM; length distribution
1. Introduction
Nomenclature
D reactor inner diameter (mm)
* Tel.: 33-4-37 70 20 65; fax: +33-4 -37 70 23 09.
L cylindrical particle length (mm)
Fixed packed bed reactors have several applications in chemical industry. They are used in reaction, separation and purification processes. Small size catalytic fixed bed reactors are commonly used to assess the performances of heterogeneous catalysts (spheres or cylinders with a characteristic size of 2-3 mm). We are interested in the reactive testing of cylindrical catalyst pellets inserted in narrow tubular reactors and have observed that in some conditions, catalyst tests results present a large variability which may be due to the random position and orientation of the catalyst pellets. In order to test that assumption and propose design rules for small scale reactors, we are studying the link between local packing, local flows and chemical responses.
Previous studies of local reactive flow have focused on single phase hydrodynamics either experimentally [1] or using CFD [2, 3, 4]. Most papers focus on average radial porosity, which is the void fraction as a function of the radius for an infinite length reactor. Previous work showed that local flow is strongly related to void fraction: flow velocity is higher where the void fraction is higher [1, 3, 4, 5].
Regarding packing of small cylinders in cylindrical tubes, there are few published studies. Leva and Grummer [6] measured mean void fraction inside a pipe filled with cylinders, spheres and rings with different surface smoothness. They concluded that mean void fraction is not influenced by surface smoothness but rather by the ratio of tube diameter to particle equivalent diameterb and by packing procedure (packing with and without vibration). A higher tube to particle diameter ratio leads to a lower average void fraction. Küfner and Hofmann [5] measured the radial void fraction for two ratios of particle diameter to tube diameter (4.44 and 9.33). Unfortunately the particles length is not specified. They suggested a correlation to predict radial void fraction profiles based on these 2 cases. Giese [1] measured radial void fraction for a tube diameter with cylindrical particles whose length is equal to diameter; the ratio of tube to particle diameter is 10. Void fraction profiles are similar in all published results. Void fraction equals 1 at the wall; when decreasing the radius, it follows an amplitude decreasing oscillatory shape with sharp peaks and smooth valleys. To the best of our knowledge, there has been no publication yet on the simulation of cylindrical particles packing.
The aforementioned studies do not consider effect of particle size distribution on void fraction which we believe has an importance. In addition, we would like to look at repeatability i.e. how different can porous structure be when repeating a packing.
The purpose of this work is to study the packing of cylindrical reactors with small cylindrical catalyst pellets of different length distributions with a focus on local porous structures. We employ a numerical approach as tools are now available and as simulated structure analysis is quite straightforward. The numerical approach allows repeating packing with exactly the same particles and procedure.
2. Methodology
The numerical simulation is performed using the Grains3D library [7] which uses the DEM approach [8]. Particles of a given shape and size are inserted at the top of the tube and fall under gravity. Simulation accounts for collisions with other particles and the walls. All trajectories and collisions are individually treated using Newton laws (translational and rotational momentum equations), with possibly non-elastic rebounds. The simulation provides full details on final position and orientation of each
particle. The code can manage any collection of convex particles of various shape and size. Grains3D has been validated with spherical and non-spherical particles [9].
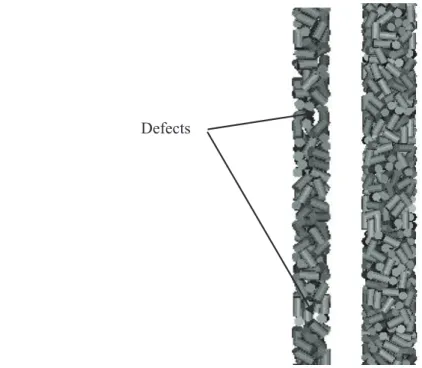
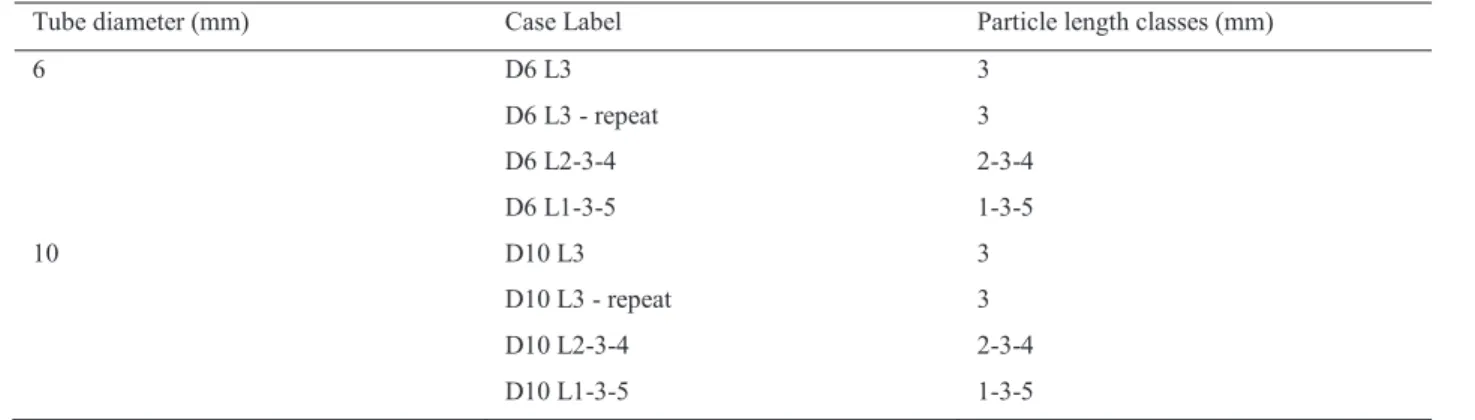
In our case, we have chosen to simulate different length distributions of cylindrical pellets. For each container diameter (6 and 10 mm), there are 3 classes of particles length with a percentage of 25, 50 and 25 for each class so as to mimic a Gaussian distribution. Average particle length is thus equal in all simulations. All particles have a diameter of 1.6 mm, which is typical of hydrotreatment catalyst. In Table 1, a summary of the simulated cases is given. Bed height is of the order of 180 mm in all simulations with 400 particles for the 6 mm tube and 1200 for the 10 mm tube. A 3D view of the packing is presented in Fig. 1.
Fig. 1. Particles structure in 6mm and 10 mm tubes
We have developed numerical tools to investigate the porous structure: orientation of each particle, mean bed void fraction and radial void fraction profiles. Post-treatment involves reconstruction of the structure in a 3D matrix and then integration.
Table 1. Summary of the simulations
Tube diameter (mm) Case Label Particle length classes (mm)
6 D6 L3 3 D6 L3 - repeat 3 D6 L2-3-4 2-3-4 D6 L1-3-5 1-3-5 10 D10 L3 3 D10 L3 - repeat 3 D10 L2-3-4 2-3-4 D10 L1-3-5 1-3-5 3. Results
3.1. Mean void fraction
Table 2 presents the mean void fraction for all simulated cases. Calculated void fraction for the uniform length cases fit quite well with the results by Leva [6] who reported an average standard deviation of 0.01 on his results. As expected, void fraction is higher in the 6 mm tube than in the 10 mm tube due to a higher frequency of large voids (Fig 1).
Table 2. Mean void fraction of simulated cases
Case label Mean void fraction Mean void fraction deduced from [6]
D6 L3 0.494 0.5 D6 L3 - repeat 0.523 D6 L2-3-4 0.533 D6 L1-3-5 0.540 D10 L3 0.420 0.41 D10 L3 - repeat 0.428 D10 L2-3-4 0.439 D10 L1-3-5 0.467
Repeating the simulation leads to major variations of the average void fraction in the 6 mm tube case but not in the 10 mm case. We suggest that the variability is related to the number of "out-of-average" structures that may be different in both simulations. In the 10 mm case, the wider tube allows for more averaging and a relatively lower impact of packing out-of-average structures.
In both cases, a wider particle length distribution (from L=3 to L=2-3-4 to L=1-3-5) leads to a higher void fraction. In the 10 mm cases, the void fraction evolution is significantly higher that its repeatability. In narrow tubes, we could expect that long cylinders would lead to a higher void faction, whereas short
cylinders would fit easily in narrow spaces and increase packing density. As void fractions for L=2-3-4 cases are lower than for L=1-3-5 cases, we conclude that void fraction depends more on longer particles which have more effect on void fraction than shorter ones.
3.2. Radial profiles
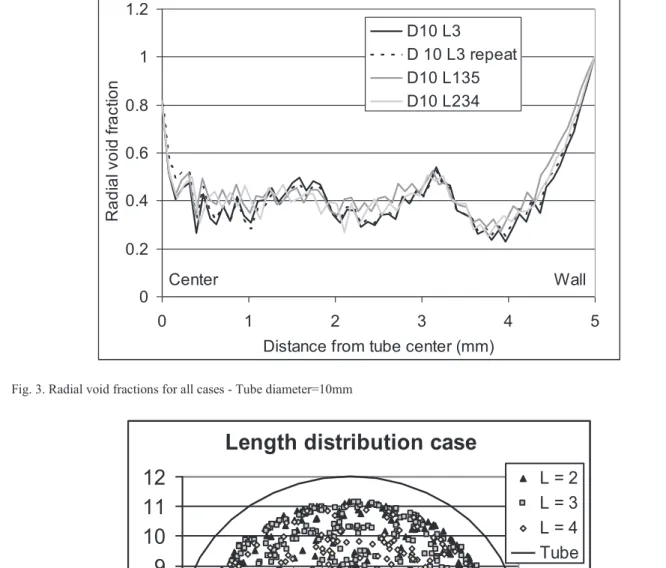
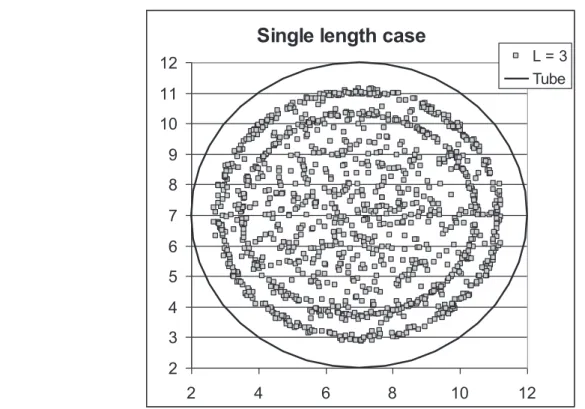
In Fig. 2 and Fig. 3, we present the radial void fraction for the simulations in the 6 and 10 mm diameter tubes. All curves have the same form: from the tube wall to the center, radial void fraction starts at 1, quickly decreases to a value of almost 0.25 and presents some dampened oscillations with a peak and smooth valley shape. Oscillation period is larger than particle diameter. Overall shape from the wall is similar to measurements reported by Giese [1] or Küffner [5] except near the centre, void fraction increases to a higher value (~0.8) which was not reported previously in the literature on cylindrical particles packing but has been observed with spheres (see for example [10]). This is not a computation artefact as there are indeed a lower number of particles near the centre (see Fig. 4 and Fig. 5 that show the projected positions of particles centres of mass in a horizontal plane).
0 0.2 0.4 0.6 0.8 1 1.2 0 1 2 3
Distance from tube center (mm)
R a d ia l v o id f ra c ti o n D6 L3 D6 L3 repeat D6 L234 D6 L135 Center Wall
0 0.2 0.4 0.6 0.8 1 1.2 0 1 2 3 4 5
Distance from tube center (mm)
R a d ia l v o id f ra c ti o n D10 L3 D 10 L3 repeat D10 L135 D10 L234 Center Wall
Fig. 3. Radial void fractions for all cases - Tube diameter=10mm
Length distribution case
2
3
4
5
6
7
8
9
10
11
12
2
7
12
L = 2 L = 3 L = 4 TubeSingle length case
2 3 4 5 6 7 8 9 10 11 12 2 4 6 8 10 12 L = 3 TubeFig. 5. Projected positions (in mm) of mass centres of particles in a horizontal plane-D=10mm, L=3 mm
Interestingly, we can see in Fig. 4 and Fig. 5 that particles tend to be organized in concentric circles. This tendency is even more visible in the vicinity of walls. In the 10 mm tube, the two first circles close to the walls are clearly observed in all simulations and diameters. Distance between circles is a bit higher than a particle radius, and larger with increasing particle length. It is interesting to notice that the distance between two consecutive circles is about half of the period of the void fraction oscillations.
In the 6 mm case, radial void fraction profile for the repeated L3 simulations is more dissimilar than the L135 and L234 cases (Fig. 2). We interpret this as an indication that each packing structure in the 6 mm case is very dependent on random effects and suspect that increasing the number of simulations would essentially lead to a wider "cloud". In the 10 mm case (Fig. 3), repetitions of the L3 case give almost identical radial void fraction profiles. Radial void fraction profiles are flatter with polydisperse particles (whereas overall void fraction is higher). In those simulations of polydisperse particles, void fraction is almost constant between the centre and 3 mm away from the centre.
3.3. Orientation of cylinders
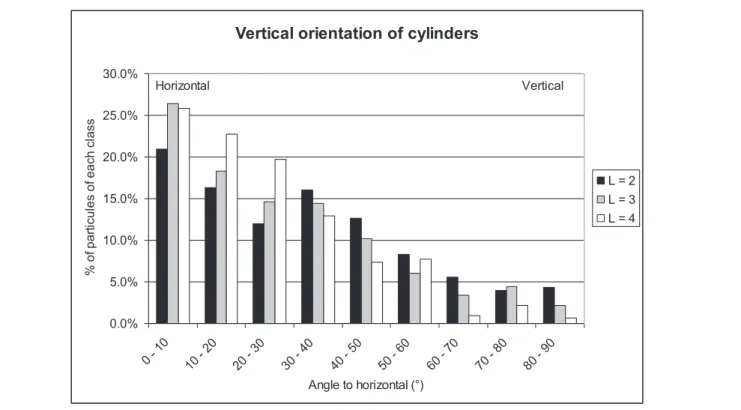
Fig. 6 presents the histogram of the angle between the horizontal plane and the axis of the cylindrical particles for the 10 mm tube diameter (L=2-3-4 mm). An angle of 0° means the particle is horizontal, while an angle of 90° that the particle is vertical. All simulations presented the same histogram regardless of particle length or tube diameter. Particles are more likely to settle in a horizontal position. Mean angle varies between 27 and 35° in all investigated cases. This compares quite well with 2 optical measurements of the orientation of visible cylinders packed in a glass tube for which were measured an average value of 32°. [11]
Vertical orientation of cylinders 0.0% 5.0% 10.0% 15.0% 20.0% 25.0% 30.0% 0 - 1 0 10 - 20 20 - 30 30 - 40 40 - 50 50 - 60 60 - 70 70 - 80 80 - 90 Angle to horizontal (°) % o f p a rt ic u le s o f e a c h c la s s L = 2 L = 3 L = 4 Horizontal Vertical
Fig. 6. Histogram of vertical orientation of cylinders
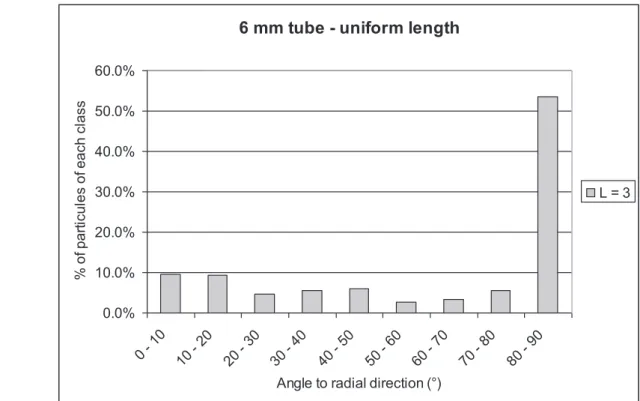
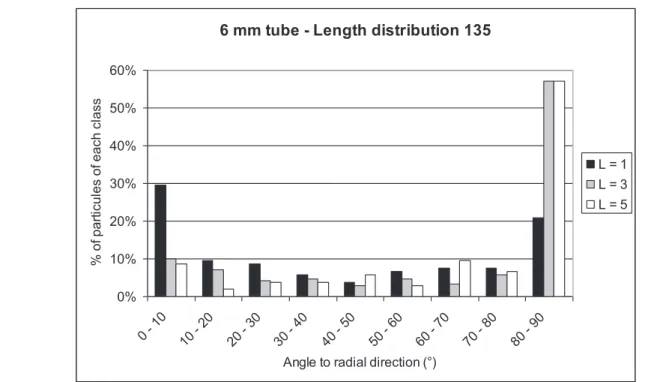
Next, we investigated the angular position of the particles in the horizontal plane and computed the angle between the cylinders axis projection on the horizontal plane and the radial direction. An angle of 0° means that the cylinder is oriented in the radial direction; while 90° refers to the tangential direction. The resulting histograms (Fig. 7, Fig. 8 and Fig. 9) present 3 features: (1) a uniformly random orientation of some particles occuring in all simulations, (2) occurrence of a dominant peak (sometimes more than 50%) at 90° (see for example Fig. 8) and (3) in some cases an additional peak at 0° (see for example Fig. 9). The 90° peak has been observed in all simulations expect those of non uniform length in 10 mm tube. The 0° peak has only been observed for 1 mm length particle in the 6 mm tube and to a lower extent in the 10 mm case.
Radial orientation tends to become random when tube diameter increases. For low tube diameters, the wall presence tends to force the particles in a tangential direction. Particle length non uniformity tends to favor a more random orientation. Diameter effect is more important on the structure than the particle length polydispersity.
10 mm tube, Length distribution 234 0% 2% 4% 6% 8% 10% 12% 14% 16% 0 - 1 0 10 - 20 20 - 30 30 - 40 40 - 50 50 - 60 60 - 70 70 - 80 80 - 90
Angle to radial direction (°)
% o f p a rt ic u le s o f e a c h c la s s L = 2 L = 3 L = 4 Radial Tangential
Fig. 7. Histogram of radial orientation of cylinders-D=10mm, L=2-3-4 mm
6 mm tube - uniform length
0.0% 10.0% 20.0% 30.0% 40.0% 50.0% 60.0% 0 - 1 0 10 - 20 20 - 30 30 - 40 40 - 50 50 - 60 60 - 70 70 - 80 80 - 90
Angle to radial direction (°)
% o f p a rt ic u le s o f e a c h c la s s L = 3
6 mm tube - Length distribution 135 0% 10% 20% 30% 40% 50% 60% 0 - 1 0 10 - 20 20 - 30 30 - 40 40 - 50 50 - 60 60 - 70 70 - 80 80 - 90 Angle to radial direction (°)
% o f p a rt ic u le s o f e a c h c la s s L = 1 L = 3 L = 5
4. Conclusion & perspectives
Using a DEM approach, we simulated the packing of cylindrical particles in narrow tubes, compared and discussed these results with the scarce literature available and provided detailed analysis of packing structure, especially with polydisperse particles.
Simulated packing densities have been calculated to be identical to measurement in "loose" packing (no densification through vibrations), which was expected as our simulations are performed in a static container.
Among the random organization of the particles, some structuring features were noticed. Particles centres tend to locate along concentric circles starting at the wall, the circle structure disappearing near the centre. Distance between circles is larger than a particle diameter but lower than a particle length and increases with the particle length. Particles tend to align more horizontally than vertically with a continuous distribution and mean angle of 30° regardless of particle or diameter size. Near the wall, the particles tend to align in a tangential direction (perpendicular to radius). Near the center, the particles are less constrained by the wall and align in a more random direction. Increasing tube diameter and /or widening the particle size distribution leads to a more random orientation of the particles.
To extend our work, we suggest to work with larger diameter tubes, study the axial porosity profiles which we know will be very dependant on integration scale and study the packing evolution when submitting the structure to vibrations. This geometrical characterization of the packing will help us to study the local flows inside the reactor and this will be our focus in the next step of our survey.
References
[1] Giese M, Rottschafer K, Vortmeyer D. Measured and modeled superficial flow profiles in packed beds with liquid flow.
AIChE Journal 1998;44:2–484.
[2] Calis HPA, Nijenhuis J, Paikert BC, Dautzenberg FM, van den Bleek CM. CFD modeling and experimental validation of pressure drop and flow profile in a novel structured catalytic reactor packing. Chem Eng Sci 2001;56:4–1713.
[3] Freund H, Zeiser T, Huber F, Klemm E, Brenner G, Durst F, Emig G. Numerical simulations of single phase reacting flows in randomly packed fixed-bed reactors and experimental validation. Chem Eng Sci 2003;58–903.
[4] Freund H, Bauer J, Zeiser T, Emig G. Detailed Simulation of Transport Processes in Fixed-Beds. Industrial Engineering
Chem Res 2005;44–6423.
[5] Küfner R, Hofmann H. Implementation of radial porosity and velocity distribution in a reactor model for heterogeneous catalytic gas phase reactions (Torus model). Chem Eng Sci 1990;45(8):2141–2146.
[6] Leva M, Grummer M. Pressure drop through packed tubes-Part III Prediction of voids in packed tubes. Chemi Eng Prog 1947;43:12–713.
[7] Wachs A. PeliGRIFF, a parallel DEM-DLM/FD direct numerical simulation tool for 3D particulate flows. J Eng Math 2010;71–131.
[8] Cundall PA, Strack ODL. A discrete numerical model for granular assemblies. Geotechnique 1979;29–47.
[9] Wachs A, Girolami L, Vinay G, Ferrer G. Grains3D, a flexible DEM approach for particles of arbitrary convex shape - Part I: numerical model and validations. Powder Tech 2012 (under submission).
[10] Mueller GE. Radial void fraction distributions in randomly packed fixed beds of uniformly sized spheres in cylindrical containers. Powder Tech1992;72–269.
[11] Rolland M, Rosenberg E. Caractérisation des empilements de grains en réacteur à lit fixe (apport de la micro-tomographie).