OATAO is an open access repository that collects the work of Toulouse
researchers and makes it freely available over the web where possible
Any correspondence concerning this service should be sent
to the repository administrator:
[email protected]
This is an author’s version published in:
http://oatao.univ-toulouse.fr/24220
To cite this version:
Schorne-Pinto, Juliano
and Janghorban, Amin and Lomello-Tafin, Marc and
Pisch, Alexander and Mikaelian, Georges and Benigni, Pierre and Barnabé,
Antoine
and Cassayre, Laurent
Assessment of thermodynamic data for
CuCrO2 delafossite from calorimetric measurements. (2019) Thermochimica
Acta, 680. 178345. ISSN 0040-6031
Assessment of thermodynamic data for CuCrO
2
delafossite from calorimetric
measurements
J. Schorne-Pinto
a,b, A. Janghorban
c, M. Lomello-Tafin
c, A. Pisch
d, G. Mikaelian
e, P. Benigni
e,
A. Barnabé
b, L. Cassayre
a,⁎aLaboratoire de Génie Chimique, Université de Toulouse, CNRS, INP, UPS, Toulouse, France bCIRIMAT, Université de Toulouse, CNRS, UT3 - Paul Sabatier, 31062 Toulouse Cedex 9, France cLaboratoire SYMME, Université Savoie Mont Blanc, Annecy, France
dSIMAP, UGA/CNRS/Grenoble INP, 38000 Grenoble, France eAix Marseille Univ., Univ. Toulon, CNRS, IM2NP Marseille, France
A R T I C L E I N F O
Keywords:
Cuprous delafossite CuCrO2thermodynamic properties
Heat capacity Drop calorimetry
Differential scanning calorimetry
A B S T R A C T
A detailed investigation of the thermodynamic properties of delafossite CuCrO2was carried out by
experi-mental methods on synthetic CuCrO2delafossite samples (differential scanning calorimetry from ambient to
871 K and drop calorimetry from 823 to 1123 K) and theoretical methods (density functional theory). Based on these data and available literature (low temperature heat capacity measurements and calculations, high temperature emf data), we propose, for the first time, a full set of thermodynamic data for the phase CuCrO2.
Our selection comes to: fH°298(CuCrO2)= −670.8 ± 1.3 kJ mol−1, °S298(CuCrO2)= 88.9 J K−1, and cp° =
T T T
( ) 1.02564. 102 2.87159. 107 3 1.28542. 105 1.5(298 < T < 1300 K).
1. Introduction
Cuprous delafossite type oxides Cu1+M3+O
2with M = (Cr3+, Fe3+, Al3+, among others) have been a topic of intense scientific activity over the last two decades due to their unique physical and chemical prop-erties. Among them, the cuprous chromite CuCrO2, also named “Mac Connellite” in its mineral form and sometimes noted as Cu2Cr2O4 in older works, is one of the most promising candidates for transparent p-type conducting oxide in optoelectronic devices [1–3]. This compound is also of interest for its catalyst/photocatalytic [4,5] and thermo-electric applications [6–8]. Moreover, the CuCrO2 phase presents re-markable physical properties such as multiferroic behavior [9,10] at low temperatures.
The CuCrO2delafossite crystallizes with the rhombohedral structure (space group R 3m) composed of alternating layers of linearly co-ordinated O-Cu1+-O and Cr3+O
6 edge-shared octahedra. In air, this phase is stable from 1073 K [4] up to a temperature higher than 1833 K based on observations of a quenched sample by Gadalla et al. [11]. This phase is one of the three mixed oxide (together with the CuCr2O4spinel and CuCrO4copper chromate [12,13]) composing the Cu-Cr-O ternary system, in which Hamuyuni and Taskinen recently performed liquidus measurements [14].
However, limited thermodynamic data for CuCrO2are available in the literature. As evidenced by Perrot in his review of the Cu-Cr-O system in 2010 [15], there is a strong lack of experimental information such as heat capacity, entropy, and enthalpy for CuCrO2, at room temperature and above. At high temperature, two systematics studies were performed on the Cr-Cu-O system by emf method. Jacob et al. [16] reported information on mixed oxides CuCrO2and CuCr2O4in addition to the single oxides Cr2O3, CuO, and Cu2O in the 900–1350 K tem-perature range. The same year, Vlach et al. [17] performed similar measurements, and included an extensive review of Gibbs energy va-lues for the formation reaction of CuCrO2. Among the twelve studies they reported for the CuCrO2phase, their emf values, the values of Jacob et al. [16] and the derived function obtained by Schmahl and Minzl [18] are in good agreement. The applicative interest of the CuCrO2phase also favored studies of the low-temperature heat capa-city, magnetization, and resistivity. Indeed, Okuda et al. [19] made estimations of the heat capacity between 0 to 150 K, and Poienar et al. [20] carried out heat capacity measurements between 2.5 and 50 K. Finally, a value for the enthalpy of formation of the phase at 0 K was proposed by Scanlon & Waston [21], based on density functional theory (DFT) calculations.
Due to some lack of experimental data, especially for the heat
https://doi.org/10.1016/j.tca.2019.178345
⁎Corresponding author.
Cuboid samples of around 40 mg (≈3 × 3 × 3 mm3) were obtained by cutting the initial pellet using a wire saw.
2.2. Drop calorimetry: apparatus and procedure
An isothermal Multi-HTC calorimeter from Setaram Instrumentation was used for this study. The calorimetric cell was heated by a vertical furnace and connected to an atmosphere controlled-tight container, loaded alternately with alumina pieces and CuCrO2cuboid samples. The experiments were done in an alumina crucible containing a one-centimeter-thick bed of HfO2powder in order to ensure the best re-producibility of heat transfers. The drop measurements were performed in flowing argon (99,999% N50) having an impurity of O2less than 2 ppm, that leads to a maximal value of oxygen partial pressure of 2.10−6atm. The temperature was calibrated with respect to pure standard metals (Al, Ag, Au). Their melting temperature was recorded at three heating rates (1, 2.5 and 5 K min−1) and were linearly extra-polated to zero heating rate. The calibration of the calorimeter was achieved by dropping an alumina sample into the crucible before and after each drop of CuCrO2sample. The sensitivity of the calorimetric cell was determined by comparing the calorimetric signals with tabu-lated data for Al2O3[24]. The temperature of the Ar-tight container was measured using an individual thermometer prior to each drop. The cell temperature had a fluctuation range between ± 0.01 K and ± 0.03 K as
the isotherms increased from 823 K to 1123 K. The thermopile fluc-tuations for all isotherms was found to be less than ± 1.6 μV. The baseline treatment and the peak integration were done with the CA-LISTO Setaram software.
2.3. DSC: apparatus and procedure
The DSC 111 instrument and the procedure used for measuring the heat capacity of CuCrO2are the same as used for ZnSb and described in [25]. Further relevant experimental details are described in this section. A mass of 114.220 mg of CuCrO2powder was weighed with a mi-crobalance ( ± 1 μg), and hermetically sealed in a first stainless steel crucible under argon within a glovebox. Then, a mass of 68.345 mg of Standard Reference Material SRM720 α-Al2O3 [24] was sealed in a second stainless steel crucible, and finally, two other similar crucibles were sealed empty. The four crucibles of equal weights were all sealed inside the glovebox, in which the oxygen level was lower than 2 ppm, and the water level was measured at 53 ppm using a cermet hygro-meter.
The heat capacity was measured between 300 and 871 K using the small temperature step method. The three parameters of the tempera-ture program were as follows: temperatempera-ture step of 2.5 K, heating rate of 1.5 K min−1between each step and stabilization time of 800 s after each temperature step.
The heat capacity measurement by DSC requires three consecutive heating runs: the so-called zeroline, calibration, and sample runs as detailed in [25]. To protect the steel crucibles from possible oxidation during these runs, the experiments were performed under a flow of argon gas, Alphagaz 1 commercial grade (purity > 99.999% vol., O2< 2 ppm, H2O < 3 ppm, CnHm< 0.5 ppm) supplied by the Air Liquide company. Before starting the temperature program, the two tubes of the differential calorimeter were flushed with an argon flow-rate of approximately 0.5 L min−1during 1 h. This argon flowrate was maintained during the whole duration of the experiments.
The temperature measurement within the DSC device was calibrated with respect to the melting temperature of pure In, Sn, Zn, and Al.
2.4. Theoretical methods
The ground state properties of CuCrO2were calculated using DFT [26,27]. The calculations were performed using the VASP software package [28,29] in its most recent version (5.4.4).
The many-body exchange semi-local density functional SCAN (Strongly Conditioned and Appropriately Normed) [30] was used to compute the ground state properties of Cu2O, Cr2O3,and CuCrO2. For Cu and Cr, the 3d and 4s orbitals and for O the 2s and 2p orbitals are considered as valence states in the calculations. The energy cut-off for the projector augmented plane-wave bases was set to 800 eV. An au-tomatically generated, gamma centred grid of k-points in the irre-ducible part of the Brillouin zone was used following the Monkhorst-Pack scheme [31]. The k-point grid for Cu2O was 11 × 11 × 11, for Cr2O37 × 7 × 7 and for CuCrO211 × 11 × 2. The magnetic properties for Cr2O3(antiferromagnetic) and CuCrO2(ferromagnetic) were taken into account.
The lattice parameters for all three solids as well as the internal atomic coordinates were fully relaxed. The linear tetrahedron method with Blöchl corrections [32] was used to calculate the electronic Den-sity of States (DOS). The relaxations were performed with a con-vergence criterion of 10−8eV Å−1for the total energy and 10−6eV Å−1 for the forces to avoid any kind of residual stress in the Hellman-Feynman forces.
The energy of formation at 0 K for CuCrO2with respect to the simple oxides was calculated using the relation:
ΔE(CuCrO2, 0 K) = E(CuCrO2, 0 K) – 0.5 x E(Cu2O, 0 K) – 0.5 x E(Cr2O3,
0 K) (1)
capacity between 150 and 1000 K, no thermodynamic functions were proposed so far for the CuCrO2 delafossite phase. In this work, we performed heat capacity measurements with differential scanning ca-lorimetry (DSC) from ambient temperature to 871 K and drop calori-metry from 823 to 1123 K on synthetic CuCrO2 delafossite samples, as well as DFT calculations at 0 K. Then, we assessed a full set of refined thermodynamic data from 298.15 K (which will be noted 298 K in the rest of the paper) to 1300 K, based on a third law analysis of our data and literature data, following a similar procedure as presented by Jacob et al. [22] for the MnO phase.
2. Materials and methods
2.1. Preparation and characterization of CuCrO2 samples
2.1.1. Polycrystalline powder synthesis
CuCrO2 was prepared by high-temperature solid-state reaction in nitrogen atmosphere as described elsewhere [23]. The Cu2O (Alfa Aesar 99%) and Cr2O3 (Acros Organics, 99+%) powders were mixed in stoichiometric quantities in a mortar and then treated at 900 and 1000 °C for 30 h, with intermediate grindings to ensure good homo-geneity.
2.1.2. Sintering & pellets preparation
Resulting powder was mixed with an organic binder (Rhodoviol®) and uniaxially pressed into a pellet of 2 cm in diameter. The debinding was carried out under air at 400 °C, and the sintering at 1050 °C with a dwell time of 10 h under Ar atmosphere.
2.1.3. Composition analysis
The cationic molar ratio of the CuCrO2 product was checked by Field Emission Gun - Electron Probe Microanalysis FEG-EPMA (SX Five FE, CAMECA) before and after drop calorimetry. X-Ray Fluorescence spectroscopy (XRF) (S2 Ranger, Bruker) was also performed to confirm the composition.
2.1.4. Structural analysis
The pellets were characterized before and after drop calorimetry by room-temperature X-Ray Diffraction ( Bruker D 4 d iffractometer, λCu Kα1 = 1.54056 Å and Kα2 = 1.54443 Å radiation).
2.5. Selected thermodynamic data and functions
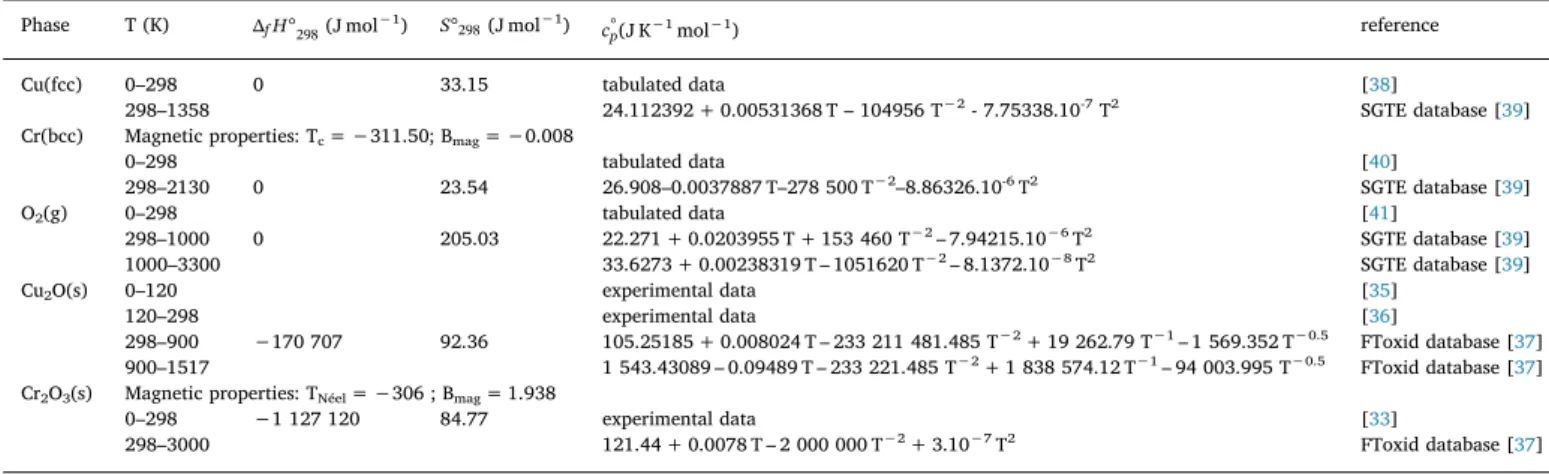
Thermodynamic data and functions for all pure compounds con-sidered in this work (Cu(fcc), Cr(bcc), O2(g), Cr2O3(s) and Cu2O(s)) are compiled inTable 1. We have selected tabulated or experimental data for heat capacity below 298 K, and polynomial functions above 298 K. For Cr2O3(s), the low temperature heat capacity was taken from recent measurements from [33]. For Cu2O(s), according to the recommenda-tions of NIST-JANAF [34], we selected the data from [35] for 0 < T < 120 K and from [36] for 120 < T < 298 K. For these two single oxides, the polynomial regression are from FTOxid [37], which reproduces tabulated data recommended by NIST-JANAF [34] for T > 298 K.
3. Results
3.1. Structural and chemical characterizations
The sintered sample was checked by room temperature XRD that confirmed the presence of the CuCrO2single phase, without any sec-ondary phase, with rhombohedral structure (3R polytype with the space groupR 3m) as illustrated onFig. 1. Based on Rietveld refinement (R factor of 4.54), the lattice parameters are a = 2.9730(3) Å and c = 17.086(2) Å.
EPMA analysis was also carried out on a cross section of a polished sample. The average composition determined by ten random point analyzes is 24.0(7) mol% of copper, 24.5(5) mol% of chromium and 51.4(6) mol% of oxygen, which corresponds to the stoichiometric composition CuCrO2.
3.2. DSC data
The DSC data are plotted vs. temperature onFig. 2(numeric values are provided in the supplementary Excel file). The data are compared to an estimation of the heat capacity using the Neumann-Kopp additivity Rule (NKR) [42] established with the Cr2O3and Cu2O heat capacities reported inTable 1. The heat capacity at room temperature was also estimated by Dulong-Petit limit (99.77 J mol−1K−1), defined as 3nR, where n is the number of atoms by molecule (n = 4) and R is the gas constant. The molar heat capacity at constant volume cV calculated with Einstein’s relation (see for instance the recent work of Zienert and Fabrichnaya [43] for mathematical expression) is also reported.
The calculated NKR curve shows a kink around 320 K which is a pure artefact resulting from the magnetic transition of Cr2O3. Indeed, the delafossite CuCrO2 phase only exhibits a magnetic transition at around 24 K according to [44] and no other transition is expected at 320 K.
Hence, the reason for the increased scattering of the experimental data points between 300 and 400 K is not fully understood. It is possibly due to vaporization of residual water, as the atmosphere of the glo-vebox contained 53 ppm of water when the DSC crucibles were sealed. In the 400–770 K, the DSC signal is smoother. Some scattering above 770 K might be related to the slow decomposition of CuCrO2caused by the low oxygen partial pressure in the crucible.
3.3. Drop calorimetry data
An example of heat flow recorded at 872 K is provided onFig. 3.
Phase T (K) fH°298(J mol−1) S°298(J mol−1) c°p(J K−1mol−1) reference
Cu(fcc) 0–298 0 33.15 tabulated data [38]
298–1358 24.112392 + 0.00531368 T – 104956 T−2- 7.75338.10-7T2 SGTE database [39] Cr(bcc) Magnetic properties: Tc= −311.50; Bmag= −0.008
0–298 tabulated data [40]
298–2130 0 23.54 26.908–0.0037887 T–278 500 T−2–8.86326.10-6T2 SGTE database [39]
O2(g) 0–298 tabulated data [41]
298–1000 0 205.03 22.271 + 0.0203955 T + 153 460 T−2– 7.94215.10−6T2 SGTE database [39]
1000–3300 33.6273 + 0.00238319 T – 1051620 T−2– 8.1372.10−8T2 SGTE database [39]
Cu2O(s) 0–120 experimental data [35]
120–298 experimental data [36]
298–900 −170 707 92.36 105.25185 + 0.008024 T – 233 211 481.485 T−2+ 19 262.79 T−1– 1 569.352 T−0.5 FToxid database [37] 900–1517 1 543.43089 – 0.09489 T – 233 221.485 T−2+ 1 838 574.12 T−1– 94 003.995 T−0.5 FToxid database [37] Cr2O3(s) Magnetic properties: TNéel= −306 ; Bmag= 1.938
0–298 −1 127 120 84.77 experimental data [33]
298–3000 121.44 + 0.0078 T – 2 000 000 T−2+ 3.10−7T2 FToxid database [37]
Fig. 1. a) Crystal structure of CuCrO2, octahedron occupied by Cr3+and Cu1+
in linear coordination. b) X-ray diffractogram of the sintered CuCrO2sample.
Fig. 2. Heat capacity obtained from DSC measurements on CuCrO2sample
compared to NKR, Cv from Einstein relation and the Dulong-Petit limit. Table 1
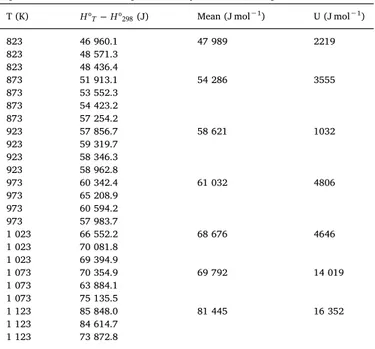
As indicated in the Guide to the Expression of Uncertainty in Measurement (GUM) [45], which remains the reference document re-lated to uncertainty measurement, the nature of certain measurement procedures or tests can make the rigorous application of the GUM dif-ficult. In our case, several sources of uncertainty contribute to a global component when enthalpy increments are measured by drop calori-metry. Then, all effects can be regarded as being addressed by esti-mating the overall uncertainty of the experimental values. However, each experiment must include sampling, accuracy of the instrument, preparation and analysis. Here, the standard uncertainty (u) is gen-erally evaluated from the experimental standard deviation (s) on the data set, assuming that the increment enthalpy values follow a normal distribution. Typically, in that case, the standard uncertainty (u = s/ √n) is multiplied by a coverage interval factor k = 2 to express the expanded uncertainty (U) with a confidence level of 95%. But it should be noted that this treatment is valid for an infinite number of trials only. Because our values are obtained from the average of a maximum of four measurements, we have applied the Student’s coverage factor (t,p), which depends on the degree of freedom (ν = n-1) for a number of n tests and on the confidence level (p) of the coverage gap taken at 95%. The values of the enthalpy increments at fixed temperature T ( °HT H°298) compiled inTable 2 are thus given with a confidence
interval (U) of the mean value ( ¯H) defined by:
° ° = ±
H H H t s
n
¯ .
T 298 ,p (2)
The values of the factors t,p and the details of the estimation of the expanded uncertainties are provided in the Supplementary Excel file.
Between 823 and 1023 K, the values of the confidence intervals reported inTable 2are about 5% of the enthalpy increments, which is fully acceptable. As illustrated inFig. 4a, SEM-FEG characterization in BSE mode of the external part of the pellets after drop calorimetry did not evidence any modification of the pristine delafossite phase (not shown here), the presence of HfO2being attributed to some residual powder stuck to the samples.
Conversely, the confidence intervals reach 20% for the two highest temperatures (1073 and 1123 K). The XRD diffractograms of the pellets after drop calorimetry did not show any noticeable change compared to the initial material. However, SEM-FEG analyses (Fig. 4b) showed the presence of Cu metal nodules, attributed to a partial reduction of the phase during measurement caused by the low oxygen partial pressure imposed in the calorimeter. Consequently, these data were discarded in the assessment of the thermodynamic functions.
3.4. DFT calculations
The ground state properties (lattice parameters, total energy and magnetic moments) calculated by DFT are compiled inTable 3. The magnetic structure of Cr2O3is antiferromagnetic with a spin sequence of +-+- along the [111] direction in the rhombohedral setting, in
Fig. 3. Heat flow measured during successive drops of Al2O3and CuCrO2
samples at 872 K.
Table 2
Experimental data from drop calorimetry of CuCrO2samples.
T (K) H°T H°298(J) Mean (J mol−1) U (J mol−1)
823 46 960.1 47 989 2219 823 48 571.3 823 48 436.4 873 51 913.1 54 286 3555 873 53 552.3 873 54 423.2 873 57 254.2 923 57 856.7 58 621 1032 923 59 319.7 923 58 346.3 923 58 962.8 973 60 342.4 61 032 4806 973 65 208.9 973 60 594.2 973 57 983.7 1 023 66 552.2 68 676 4646 1 023 70 081.8 1 023 69 394.9 1 073 70 354.9 69 792 14 019 1 073 63 884.1 1 073 75 135.5 1 123 85 848.0 81 445 16 352 1 123 84 614.7 1 123 73 872.8
Fig. 4. BSE micrographs of external part of samples recovered after drop ca-lorimetry at 1023 K (a) and 1123 K (b).
Table 3
Ground state properties of Cu2O, Cr2O3and CuCrO2.
Phase Cu2O Cr2O3 CuCrO2
Lattice parameter Å a = 4.228 a = 5.362 a = 2.980 α = 54.991° c = 17.019
Magnetic moment Bohr – 0 (AFM) 8.64 (FM)
Ground state energy eV fu−1 −37.999340 −68.468135 −53.443067 Formation energy at
0 K eV fu
−1 −0.209330
Above 40 K, we established two polynomial expressions,c° ( )T p1 for 40 < T < 298 K andc° ( )T
p2 for 298 < T < 1300 K based on the least square method. The polynomial regression ofc° ( )T
p1 was established with the data from [19] for 40 < T < 150 K. The polynomial regres-sion of c° ( )T
p2 combined our experimental DSC data for 300 < T < 870 K and our experimental drop calorimetry data for 823 < T < 1023 K. The experimental drop calorimetry data
° °
HT H 298are the reference values for the integratedc°p2( )T function, according to Eq.(3). = ° ° ° c ( )T dT (H H ) T p T calc 298 2 298 (3)
The numerical resolution was constrained according to: (i) the continuity of the two functions at 298 K :c° (298)=c° (298)
p1 p2
(ii) the continuity of the derivative of the two functions at 298 K :
= ° ° d c T dT d c T dT ( ) 298 ( ) 298 p1 p2
The resulting polynomial functions are:
= + < < ° cp1( )T 0.955934 0.383138T 4.13581. 10 4T2(40 T 298 K) (4) = < < ° c T T T ( ) 1.02564. 10 2.87159. 10 1.28542. 10 (298 T 1300 K) p2 2 7 3 5 1.5 (5)
The two functions are plotted inFig. 5together with available data. The integral ofc° ( )T
p2 is plotted inFig. 6and compared to our two set of experimental data (integrated DSC data and enthalpy increments).
4.2. Entropy of CuCrO2at 298 K
The entropy of CuCrO2is obtained from Eq.(6).
° = ° S CuCrO c CuCrO T T dT ( ) p( )( ) 298 2 0 298 2 (6) We performed direct numerical integration of the experimental values from [20] between 0 and 40 K (contribution of 9.95 J K−1) and analytic integration of thec° ( )T
p1 function (Eq.(4)) between 40 and 298 K (contribution of 78.94 J K−1). Our recommended value for the
entropy of CuCrO2comes to: °S298(CuCrO2)= 88.89 J K−1.
This value is significantly higher than the value (85.2 J K−1) proposed by Vlach et al. [17], which was evaluated by the structural analog method using the entropy of formation of the CuFeO2delafossite. It is also slightly higher than the value (86.73 J K−1) obtained from ideal mixing of Cu
2O and Cr2O3(integration of Neumann-Kopp function).
4.3. Enthalpy of formation of CuCrO2at 298 K
The enthalpy of formation of CuCrO2, fH°298(CuCrO2), is related to Eq.(7).
+ + =
Cu fcc( ) Cr bcc( ) O g2( ) CuCrO s2( ) (7) Our assessment of fH°298(CuCrO2) takes into account high tem-perature emf data from [14,15], from which we derived values of Gibbs energy of formation fG°T(CuCrO2).
The 14 emf data of [14,15] are related to the following electro-chemical cell:
+ =
Cu O2 Cr O2 3 2CuCrO2 (8)
with rG°T(cell)= 2. .F emf
and ° = ° + ° + ° G (CuCrO) ( G (cell) G (Cu O) G (Cr O)) f T 2 12 r T f T 2 f T 2 3 ° G (Cu O)
f T 2 and fG°T(Cr O2 3) come from the selected thermo-dynamic functions compiled inTable 1. The set of 14 assessed data for
°
G (CuCrO)
f T 2 is provided inTable 4.
For each emf data, a value of fH°298(CuCrO2)is obtained from Eq.
(9):
Fig. 5. Temperature evolution of heat capacity derived from DSC (this work), drop calorimetry (this work), low temperature calculations [19] and experi-mental data [20].
Fig. 6. Comparison of Tc° ( )T dT p
298 2 with drop calorimetry data and integrated
DSC data.
agreement with experimental data from the literature [46]. The ground state for CuCrO2 is ferromagnetic with an overall magnetic moment of 8.64 Bohr.
The values of the cell parameters calculated at 0 K (a = 2.980 Å and c = 17.019 Å) are very close to the ones refined from our room tem-perature XRD pattern (a = 2.973 Å and c = 17.086 Å). The difference is respectively +0.10% and −0.02%, and could be attributed to the temperature dependence of the cell parameters. Indeed, these small variations are consistent with those reported by [20] from the refine-ment of high-resolution neutron powder diffractograms o f CuCrO2, which showed a deviation of +0.25% of a and −0.16% of c between 10 and 300 K. As a consequence, the formation energy calculated at 0 K (−20.2 kJ mol−1) provides an additional data that will be considered in the assessment of the thermodynamic functions of CuCrO2.
4. Discussion
4.1. Temperature evolution of heat capacity from 0 to 1300 K
We have chosen to divide the evolution of the heat capacity into three temperature domains. At low temperature (T < 40 K), we se-lected experimental data from [20], which are consistent with simula-tion from [19]. Due to the occurrence of the magnetic transition, and since our major objective was to obtain an accurate entropy value at 298 K, we did not perform any fit o f t he e xperimental d ata i n this temperature range.
° = ° ° ° + ° + ° ° H G (H H ) T( S (S S )) f 298 f T T 298 f 298 T 298 (9) with ° = ° G G (CuCrO) f T r T 2 ° ° = ° ° ° ° H H c T c Cu fcc c Cr bcc c O g dT ( ) [ ( ) ( ( )) ( ( )) ( ( ))] T T p p p p 298 298 2 2 = ° ° ° ° ° S S (CuCrO) S (Cu fcc( )) S (Cr bcc( )) S (O g( )) f 298 298 2 298 298 298 2 ° ° = ° ° ° ° S S T c T c Cu fcc c Cr bcc c O g dT ( ) 1[ ( ) ( ( )) ( ( )) ( ( ))] T T p p p p 298 298 2 2
The determination of fH°298(CuCrO2) is then built from (i) our assessments of c° ( )T
p2 (Eq. (5)) and °S 298(CuCrO2), (ii) the thermo-dynamic functions compiled inTable 1and (iii) the assessed values of
°
G (CuCrO)
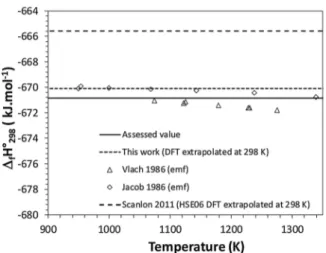
f T 2 compiled inTable 4. As a result, we obtained 14 values of fH°298(CuCrO2), which are plotted as a function of the temperature of emf measurements inFig. 7. Based on the average of these 14 values, our recommended value for the enthalpy of formation of CuCrO2 is
°
H (CuCrO)
f 298 2 = −670.8 ± 1.3 kJ mol−1.
From this value of fH°298, we also derived an enthalpy of reaction corresponding to the formation of CuCrO2from the pure oxides (Eq.
(8)): ° = ° ° ° H H (CuCrO) 1 H Cu O H Cr O 2 ( ) 1 2 ( ) r 298Ox f 298 2 f 298 2 f 298 2 3 (10) The enthalpy value comes to rH°298Ox= −21.9 ± 1.3 kJ mol−1.
4.4. Comparison to DFT calculations
As reported in Table 3, our computed enthalpy of formation of CuCrO2 at 0 K from single oxide compounds (1/2 Eq. (8)) is
° =
H
r 0DFT 1 −20.2 kJ mol−1. This value is compared to our assessed value at 298 K ( rH°298Eq2) using Eq.(11).
° = ° + ° H H ( c ) dT r 298DFT 1 r 0DFT 1 0 p R 298 1 (11) with = ° ° ° ° c c CuCrO c Cu O c Cr O ( p)R1 p( 2) 12 p( 2 ) 12 p( 2 3) °
c CuCrOp( 2): c°p1( )T for 40 < T < 298 K (Eq. (4)) and tabulated value for 0 < T < 40 K
°
cpdata for Cu2O and Cr2O3fromTable 1 The integral of( c°)
p R1 is equal to −1.00 kJ mol−1. The resulting value for fH°298DFT 1is 21.2 kJ mol−1, which is fully consistent with
° H
r 298Ox.
Ab initio calculations from [21] provide another value of enthalpy of formation of CuCrO2at 0 K, from pure metals (Eq.(7)): fH°0DFT 2= −660.9 kJ mol−1. Their value computed at 0 K is compared to our as-sessed value of fH°298by extrapolation to 298 K according to:
° = ° + ° H H ( c ) dT f 298DFT 2 f 0DFT 2 p R 0 298 2 (12) with ° = ° ° ° ° c c CuCrO c Cu fcc c Cr bcc c O g ( p )R2 p( 2) p( ( )) p( ( )) p( 2( )) °
c CuCrOp( 2): same as Eq.(11) °
cpdata for Cu(fcc), Cr(bcc) and O2(g) fromTable 1
The resulting value for fH°298DFT 2 is −665.6 kJ mol−1. As illu-strated inFig. 7, this value is not in full accordance with our assess-ment, however, the relative difference remains lower than 1%.
5. Conclusions
We performed heat capacity measurements with DSC (from ambient to 871 K) and drop calorimetry (from 823 to 1123 K) on synthetic CuCrO2delafossite samples, as well as DFT calculations at 0 K. Our two sets of experimental data are very consistent. Combined with low temperature literature data, the heat capacity is described from 0 to 1300 K, from which we derive the standard enthalpy at 298 K. A “third law” analysis of 14 emf data points provides a mean value for the en-thalpy of formation of CuCrO2at 298 K, which is very consistent with
Table 4
Reassessment of fG°T(CuCrO2)from emf data of [16] and [17], with selected Cu2O and Cr2O3thermodynamic functions fromTable 1.
Data source T (K) emf (mV) rG°T(cell)(J mol−1) fG°T(Cu O2 )(J mol−1) fG°T(Cr O2 3)(J mol−1) fG°T(CuCrO2)(J mol−1)
[16] 950.1 196.36 −37 889 −99 034 −879 473 −508 197 953.5 194.08 −37 449 −98 788 −878 628 −507 433 1000.0 192.71 −37 185 −95 439 −867 091 −499 858 1068.9 189.07 −36 482 −90 504 −850 042 −488 514 1143.0 184.51 −35 603 −85 233 −831 757 −476 296 1237.8 179.50 −34 636 −78 546 −808 418 −460 800 1339.4 174.03 −33 581 −71 449 −783 448 −444 239 [17] 1074.7 198.4 −38 283 −90 069 −848 535 −488 443 1122.4 195.88 −37 797 −86 723 −836 934 −480 727 1125.6 195.74 −37 770 −86 439 −835 948 −480 078 1179.3 193.59 −37 355 −82 686 −822 888 −471 465 1228.2 191.76 −37 002 −79 234 −810 829 −463 532 1230.4 191.65 −36 981 −79 094 −810 337 −463 205 1275.4 189.72 −36 608 −75 939 −799 272 −455 909
Fig. 7. Results of third-law analysis of Gibbs energy of formation of CuCrO2;
our value calculated at 0 K by DFT and extrapolated to 298 K. Based on this assessment, we propose, for the first time, a full set of thermodynamic data for the delafossite phase CuCrO2. These data, ta-bulated inTable 5, present a great interest for research and develop-ment activities linked to the application of the delafossite materials on a very large range of temperature.
Acknowledgments
The authors from Laboratoire de Génie Chimique and CIRIMAT thank the Région Occitanie for the PhD funding of J. Schorne Pinto.
All authors also wish to thank the GDR CNRS n°3584 TherMatHT for the financial contribution to experimental drop calorimetry measure-ments and for fruitful discussions and collaborative work on the present project.
The help of Prof. Xavier Joulia (Laboratoire de Génie Chimique) for the implementation of the numerical method used in the establishment of the heat capacity functions was greatly appreciated.
Appendix A. Supplementary data
Supplementary material related to this article can be found, in the online version, at doi:https://doi.org/10.1016/j.tca.2019.178345.
References
[1] A. Barnabé, Y. Thimont, M. Lalanne, L. Presmanes, P. Tailhades, p-Type conducting transparent characteristics of delafossite Mg-doped CuCrO2thin films prepared by RF-sputtering, J. Mater. Chem. C 3 (2015) 6012–6024,https://doi.org/10.1039/ C5TC01070E.
[2] J. Crêpellière, P. Lunca Popa, N. Bahlawane, R. Leturcq, F. Werner, S. Siebentritt, D. Lenoble, Transparent conductive CuCrO2thin films deposited by pulsed injection metal organic chemical vapor deposition: up-scalable process technology for an improved transparency/conductivity trade-off, J. Mater. Chem. C 4 (2016) 4278–4287,https://doi.org/10.1039/C6TC00383D.
[3] S. Mahapatra, S.A. Shivashankar, Low-pressure metal–organic chemical vapor de-position of transparent and p-Type conducting CuCrO2thin films with high con-ductivity, Chem. Vap. Depos. 9 (2003) 238–240,https://doi.org/10.1002/cvde. 200304147.
[4] A.P. Amrute, Z. Łodziana, C. Mondelli, F. Krumeich, J. Pérez-Ramírez, Solid-state chemistry of cuprous delafossites: synthesis and stability aspects, Chem. Mater. 25 (2013) 4423–4435,https://doi.org/10.1021/cm402902m.
[5] W. Ketir, A. Bouguelia, M. Trari, Visible light induced NO2-removal over CuCrO2 catalyst, Water Air Soil Pollut. 199 (2009) 115–122,https://doi.org/10.1007/ s11270-008-9864-z.
[6] R. Manickam, K. Biswas, Double doping induced power factor enhancement in
CuCrO2for high temperature thermoelectric application, J. Alloys Compd. 775 (2019) 1052–1056,https://doi.org/10.1016/j.jallcom.2018.10.083.
[7] I. Sinnarasa, Y. Thimont, L. Presmanes, A. Barnabé, P. Tailhades, Thermoelectric and transport properties of delafossite CuCrO₂: Mg thin films prepared by RF magnetron sputtering, Nanomaterials (Basel) 7 (2017),https://doi.org/10.3390/ nano7070157.
[8] I. Sinnarasa, Y. Thimont, L. Presmanes, C. Bonningue, A. Barnabé, P. Tailhades, Influence of thickness and microstructure on thermoelectric properties of Mg-doped CuCrO2delafossite thin films deposited by RF-magnetron sputtering, Appl. Surf. Sci. 455 (2018) 244–250,https://doi.org/10.1016/j.apsusc.2018.05.104.
[9] M. Poienar, F. Damay, C. Martin, J. Robert, S. Petit, Spin dynamics in the geome-trically frustrated multiferroic CuCrO2, Phys. Rev. B 81 (2010) 104411,https://doi. org/10.1103/PhysRevB.81.104411.
[10] S. Seki, Y. Onose, Y. Tokura, Spin-driven ferroelectricity in triangular lattice anti-ferromagnets ACrO2(A = Cu, Ag, Li, or Na), Phys. Rev. Lett. 101 (2008) 067204, https://doi.org/10.1103/PhysRevLett.101.067204.
[11] A.M.M. Gadalla, J. White, The system CuO–Cu2O–Cr2O3and its bearing on the
performance of basic refractories in copper-melting furnaces, Trans. Br. Ceram. Soc. 63 (1964) 535–552.
[12] G.M. Kale, Thermal decomposition of CuCrO4·2CuO·2H2O and phase relations in the Cu-Cr-O system, J. Mater. Sci. 30 (1995) 1420–1424,https://doi.org/10.1007/ BF00375241.
[13] K.T. Jacob, G.M. Kale, Y. Waseda, Gibbs energy of formation of CuCrO4and phase relations in the system Cu-Cr-O below 735 K, Thermochim. Acta 208 (1992) 341–348,https://doi.org/10.1016/0040-6031(92)80176-W.
[14] J. Hamuyuni, P. Taskinen, Liquidus experimental data for the system Cu-O-Cr2O3in air, Thermochim. Acta 638 (2016) 96–102,https://doi.org/10.1016/j.tca.2016.06. 020.
[15] P. Perrot, Chromium – copper – oxygen, in: G. Effenberg, S. Ilyenko (Eds.), Refractory Metal Systems: Selected Systems from C-Ta-W to Ti-V-W, Springer, Berlin Heidelberg, 2010, pp. 126–137, , https://doi.org/10.1007/978-3-642-00771-2_9.
[16] K.T. Jacob, G.M. Kale, G.N.K. Iyengar, Oxygen potentials, Gibbs’ energies and phase relations in the Cu-Cr-O system, J. Mater. Sci. 21 (1986) 2753–2758.
[17] K.C. Vlach, Y.-Z. You, Y. Austin Chang, A thermodynamic study of the Cu-Cr-O system by the EMF method, Thermochim. Acta 103 (1986) 361–370,https://doi. org/10.1016/0040-6031(86)85173-5.
[18] N.G. Schmahl, E. Minzl, Ermittlung thermodynamischer Daten Von
Doppeloxidbildungen aus Gleichgewichtsmessungen, Z. Phys. Chem. 47 (1965) 358–382,https://doi.org/10.1524/zpch.1965.47.5_6.358.
[19] T. Okuda, Y. Beppu, Y. Fujii, T. Onoe, N. Terada, S. Miyasaka, Specific heat of delafossite oxide CuCr1-xMgxO2(0 ≤ x ≤ 0.03), Phys. Rev. B 77 (2008),https://doi. org/10.1103/PhysRevB.77.134423.
[20] M. Poienar, F. Damay, C. Martin, V. Hardy, A. Maignan, G. André, Structural and magnetic properties of CuCr1-xMgxO2by neutron powder diffraction, Phys. Rev. B 79 (2009) 014412,https://doi.org/10.1103/PhysRevB.79.014412.
[21] D.O. Scanlon, G.W. Watson, Understanding the p-type defect chemistry of CuCrO2, J. Mater. Chem. 21 (2011) 3655–3663,https://doi.org/10.1039/C0JM03852K. [22] K.T. Jacob, A. Kumar, Y. Waseda, Gibbs energy of formation of MnO: measurement
and assessment, J. Phase Equilib. Diffus. 29 (2008) 222–230,https://doi.org/10. 1007/s11669-008-9280-5.
[23] M. Lalanne, A. Barnabé, F. Mathieu, P. Tailhades, Synthesis and thermostructural studies of a CuFe1−xCrxO2delafossite solid solution with 0 ≤ x ≤ 1, Inorg. Chem. 48 (2009) 6065–6071,https://doi.org/10.1021/ic900437x.
T (K) cp T° (J K−1mol−1) H°T H°298(J mol−1) S°T(J K−1mol−1) fH°T(kJ mol−1) fG°T(kJ mol−1)
298.15 76.51 0 88.89 −670800.0 −619267.6 300 76.76 141.8 89.36 −670801.6 −618947.8 350 82.26 4126.6 101.64 −670735.1 −610308.1 400 86.05 8339.8 112.89 −670518.3 −601689.1 450 88.78 12714.1 123.19 −670212.7 −593103.1 500 90.84 17206.9 132.65 −669855.9 −584554.2 550 92.43 21790.1 141.39 −669473.4 −576042.4 600 93.69 26444 149.49 −669082.6 −567565.9 650 94.70 31154.5 157.03 −668696.3 −559121.9 700 95.54 35911.3 164.08 −668323.3 −550707.2 750 96.24 40706.2 170.69 −667970.2 −542318.5 800 96.83 45533.2 176.92 −667642.5 −533952.6 850 97.33 50387.5 182.81 −667344.6 −525606.2 900 97.76 55265.1 188.38 −667080.4 −517276.5 950 98.14 60162.9 193.68 −666853.0 −508960.4 1000 98.47 65078.4 198.72 −666665.3 −500655.3 1050 98.76 70009.3 203.53 −666520.0 −492358.6 1100 99.02 74953.9 208.13 −666419.8 −484067.7 1150 99.25 79910.7 212.54 −666367.1 −475780.3 1200 99.46 84878.4 216.77 −666364.2 −467494.2 1250 99.64 89855.9 220.83 −666413.6 −459207.1 1300 99.81 94842.2 224.74 −666517.5 −450917.0 Table 5
[24] D.A. Ditmars, S. Ishihara, S.S. Chang, G. Bernstein, E.D. West, Enthalpy and heat-capacity standard reference material: synthetic sapphire (a-Al2O3) from 10 to
2250 K, J. Res. Bur. Stand. 87 (1982) 159–163.
[25] P. Benigni, G. Mikaelian, R. Pothin, A. Berche, R.M. Ayral, J.C. Tedenac, P. Jund, J. Rogez, Measurement of the heat capacity of ZnSb by DSC between 300 and 673 K, Calphad 55 (2016) 238–242,https://doi.org/10.1016/j.calphad.2016.09.008. [26] P. Hohenberg, W. Kohn, Inhomogeneous electron gas, Phys. Rev. 136 (1964)
B864–B871,https://doi.org/10.1103/PhysRev.136.B864.
[27] W. Kohn, L.J. Sham, Self-consistent equations including exchange and correlation effects, Phys. Rev. 140 (1965) A1133–A1138,https://doi.org/10.1103/PhysRev. 140.A1133.
[28] G. Kresse, J. Furthmüller, Efficient iterative schemes for ab initio total-energy cal-culations using a plane-wave basis set, Phys. Rev. B 54 (1996) 11169–11186, https://doi.org/10.1103/PhysRevB.54.11169.
[29] G. Kresse, D. Joubert, From ultrasoft pseudopotentials to the projector augmented-wave method, Phys. Rev. B 59 (1999) 1758–1775,https://doi.org/10.1103/ PhysRevB.59.1758.
[30] J. Sun, A. Ruzsinszky, J.P. Perdew, Strongly Constrained and appropriately normed semilocal density functional, Phys. Rev. Lett. 115 (2015) 036402,https://doi.org/ 10.1103/PhysRevLett.115.036402.
[31] H.J. Monkhorst, J.D. Pack, Special points for Brillouin-zone integrations, Phys. Rev. B 13 (1976) 5188–5192,https://doi.org/10.1103/PhysRevB.13.5188.
[32] P.E. Blöchl, O. Jepsen, O.K. Andersen, Improved tetrahedron method for Brillouin-zone integrations, Phys. Rev. B 49 (1994) 16223–16233,https://doi.org/10.1103/ PhysRevB.49.16223.
[33] V.M. Gurevich, O.L. Kuskov, N.N. Smirnova, K.S. Gavrichev, A.V. Markin, Thermodynamic functions of eskolaite Cr2O3(c) at 0–1800 K, Geochem. Int. 47 (2009) 1170,https://doi.org/10.1134/S0016702909120027.
[34] M.W. Chase, NIST-JANAF thermochemical tables, J. Phys. Chem. Ref. Data. Monogr. 9 (1998).
[35] J.H. Hu, H.L. Johnston, Low temperature heat capacities of inorganic solids. IX. Heat capacity and thermodynamic properties of cuprous oxide from 14 to 300 K, J. Am. Chem. Soc. 73 (1951) 4550–4551,https://doi.org/10.1021/ja01154a017.
[36] A.D. Mah, L.B. Pankratz, W.W. Weller, E.G. King, Thermodynamic Data for Cuprous and Cupric Oxides, US Dept. of the Interior, Bureau of Mines, 1967, p. 7026. [37] C.W. Bale, E. Bélisle, P. Chartrand, S.A. Decterov, G. Eriksson, A.E. Gheribi, K. Hack,
I.-H. Jung, Y.-B. Kang, J. Melançon, A.D. Pelton, S. Petersen, C. Robelin, J. Sangster, P. Spencer, M.-A. Van Ende, FactSage thermochemical software and databases, 2010–2016, Calphad 54 (2016) 35–53,https://doi.org/10.1016/j.calphad.2016.05. 002.
[38] J.W. Arblaster, Thermodynamic properties of copper, J. Phase Equilib. Diffus. 36 (2015) 422–444,https://doi.org/10.1007/s11669-015-0399-x.
[39] A.T. Dinsdale, SGTE data for pure elements, Calphad 15 (1991) 317–425,https:// doi.org/10.1016/0364-5916(91)90030-N.
[40] R.J. Corruccini, J.J. Gniewek, Specific Heats and Enthalpies of Technical Solids at Low Temperatures. A Compilation From the Literature, National Bureau of Standards, Washington, D.C, 1960 (Accessed 11 May 2019),https://www.osti.gov/ biblio/4803576.
[41] H.W. Woolley, Thermodynamic Properties of Molecular Oxygen, National Bureau of Standards, (1953) (Accessed 23 May 2019),http://archive.org/details/ thermodynamicpro2611wool.
[42] J. Leitner, P. Voňka, D. Sedmidubský, P. Svoboda, Application of Neumann–Kopp rule for the estimation of heat capacity of mixed oxides, Thermochim. Acta 497 (2010) 7–13,https://doi.org/10.1016/j.tca.2009.08.002.
[43] T. Zienert, O. Fabrichnaya, Prediction of heat capacity for crystalline substances, Calphad 65 (2019) 177–193,https://doi.org/10.1016/j.calphad.2019.01.017. [44] A. Maignan, C. Martin, R. Frésard, V. Eyert, E. Guilmeau, S. Hébert, M. Poienar,
D. Pelloquin, On the strong impact of doping in the triangular antiferromagnet CuCrO2, Solid State Commun. 149 (2009) 962–967,https://doi.org/10.1016/j.ssc. 2009.02.026.
[45] Working Group 1 of the Joint Committee for Guides in Metrology, Evaluation of Measurement Data — Guide to the Expression of Uncertainty in Measurement, (2008) (Accessed 12 April 2019),https://www.bipm.org/utils/common/ documents/jcgm/JCGM_100_2008_E.pdf.
[46] L.M. Corliss, J.M. Hastings, R. Nathans, G. Shirane, Magnetic structure of Cr2O3, J. Appl. Phys. 36 (1965) 1099–1100,https://doi.org/10.1063/1.1714118.
![Fig. 5. Temperature evolution of heat capacity derived from DSC (this work), drop calorimetry (this work), low temperature calculations [ 19 ] and experi-mental data [ 20 ].](https://thumb-eu.123doks.com/thumbv2/123doknet/2954513.80690/6.892.479.815.79.304/temperature-evolution-capacity-derived-calorimetry-temperature-calculations-mental.webp)