HAL Id: hal-01635414
https://hal.archives-ouvertes.fr/hal-01635414
Submitted on 15 Nov 2017
HAL is a multi-disciplinary open access
archive for the deposit and dissemination of
sci-entific research documents, whether they are
pub-lished or not. The documents may come from
teaching and research institutions in France or
abroad, or from public or private research centers.
L’archive ouverte pluridisciplinaire HAL, est
destinée au dépôt et à la diffusion de documents
scientifiques de niveau recherche, publiés ou non,
émanant des établissements d’enseignement et de
recherche français ou étrangers, des laboratoires
publics ou privés.
the DCASE 2016 Task Results
Grégoire Lafay, Emmanouil Benetos, Mathieu Lagrange
To cite this version:
Grégoire Lafay, Emmanouil Benetos, Mathieu Lagrange. Sound Event Detection in Synthetic Audio:
Analysis of the DCASE 2016 Task Results. IEEE Workshop on Applications of Signal Processing to
Audio and Acoustics (WASPAA 2017), Sep 2017, Mohonk, United States. �hal-01635414�
SOUND EVENT DETECTION IN SYNTHETIC AUDIO:
ANALYSIS OF THE DCASE 2016 TASK RESULTS
Gr´egoire Lafay
1, Emmanouil Benetos
2and Mathieu Lagrange
11
LS2N, CNRS, Ecole Centrale de Nantes, France
2
School of EECS, Queen Mary University of London, UK
ABSTRACT
As part of the 2016 public evaluation challenge on Detection and Classification of Acoustic Scenes and Events (DCASE 2016), the second task focused on evaluating sound event detection systems using synthetic mixtures of office sounds. This task, which fol-lows the ‘Event Detection - Office Synthetic’ task of DCASE 2013, studies the behaviour of tested algorithms when facing controlled levels of audio complexity with respect to background noise and polyphony/density, with the added benefit of a very accurate ground truth. This paper presents the task formulation, evaluation metrics, submitted systems, and provides a statistical analysis of the results achieved, with respect to various aspects of the evaluation dataset.
Index Terms— Sound event detection, experimental valida-tion, DCASE, acoustic scene analysis, sound scene analysis
1. INTRODUCTION
The emerging area of computational sound scene analysis (also called acoustic scene analysis) addresses the problem of automat-ically analysing environmental sounds, such as urban or nature sound environments [1]. Applications of sound scene analysis in-clude smart homes/cities, security/surveillance, ambient assisted living, sound indexing, and acoustic ecology. A core problem in sound scene analysis is sound event detection (SED), which in-volves detecting and classifying sounds of interest present in an au-dio recording, specified by start/end times and sound labels. A key challenge in SED is the detection of multiple overlapping sounds, also called polyphonic sound event detection. To that end, the pub-lic evaluation challenge on Detection and Classification of Acous-tic Scenes and Events (DCASE 2013) [1] ran tasks for both mono-phonic and polymono-phonic SED, attracting 7 and 3 submissions respec-tively.
The follow-up challenge, DCASE 2016 [2], attracted submis-sions from over 80 international teams amongst 4 different tasks. The 2nd task of DCASE 2016 [2] is entitled “Sound event detec-tion in synthetic audio”, and follows the polyphonic “Event Detec-tion - Office Synthetic” task of DCASE 2013. For the 2016 chal-lenge, Task 2 attracted 10 submissions from 9 international teams, totalling 37 authors. The main aim of this task is to evaluate the performance of polyphonic sound event detection systems in of-fice environments, using audio sequences generated by artificially concatenating isolated office sounds. The evaluation data was gen-erated using varying levels of noise and polyphony. The benefits of this approach include very accurate ground truth, and the fact that the scene complexity can be broken into different types, al-lowing us to finely study the sensitivity of the evaluated algorithms
EB is supported by a UK RAEng Research Fellowship (RF/128).
to a given scene characteristic. Here, we evaluate differences be-tween systems with respect to aspects of the dataset, including the event to background ratio (EBR), the scene type (monophonic vs. polyphonic scenes), and scene density. This paper presents the for-mulation of DCASE 2016 - Task 2, including generated datasets, evaluation metrics, submitted systems, as well as a detailed statisti-cal analysis of the results achieved, with respect to various aspects of the evaluation dataset.
2. DATASET CREATION
2.1. Isolated Sounds
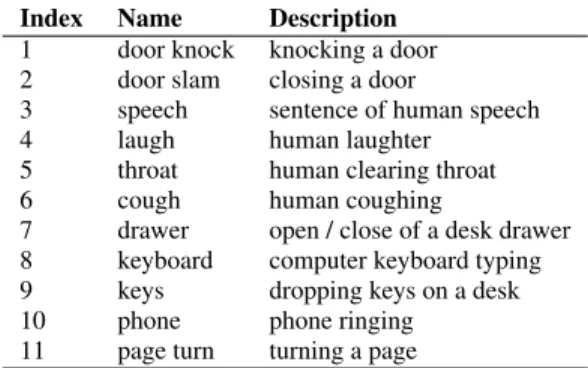
The isolated sound dataset used for simulating the scenes has been recorded in the offices of LS2N (France). 11 sound classes have been considered, presented in Table 1. Compared to DCASE 2013, 5 classes are no longer considered: alert (due to its too broad defini-tion and large diversity compared to other classes), printer, switch, mouse click, and pen drop. After detailed post-analysis of the previ-ous challenge, those latter classes that have been badly recognised and often confused were found to be too short in terms of duration. The class printer is no longer considered since it is composed of sounds that are much longer than the ones of the other classes.
2.2. Simulation process
For simulating the recordings used for Task 2, the morphological sound scene model proposed in [3] is used. Two core parameters are considered to simulate the acoustic scenes:
• EBR: the event-to-background ratio, i.e. the average am-plitude ratio between sound events and the background • nec: the number of events per class
For each scene, the onset locations are randomly sampled using a uniform distribution. For monophonic scenes, a post-treatment that takes into account the duration of the event is done by moving some onsets in order to fulfill the constraint that two events must not overlap. 3 levels are considered for each parameter: EBR: -6, 0 and +6 dB; nec: 1, 2, and 3 for a monophonic scene, and 3, 4, and 5 for polyphonic ones. This set of parameters leads to 18 experimental conditions.
2.3. Task Datasets
The training dataset consists of 220 isolated sounds containing 20 sounds per event class (see subsection 2.1). The scenes of the de-velopment dataset are built using the isolated sounds of the training dataset mixed with 1 background sample. One scene is built for each experimental condition, leading to 18 acoustic scenes. Only
Index Name Description 1 door knock knocking a door
2 door slam closing a door
3 speech sentence of human speech
4 laugh human laughter
5 throat human clearing throat
6 cough human coughing
7 drawer open / close of a desk drawer
8 keyboard computer keyboard typing
9 keys dropping keys on a desk
10 phone phone ringing
11 page turn turning a page
Table 1: Sound event classes used in DCASE 2016 - Task 2.
the EBR is an independent parameter, so for each combination of nec and monophony/polyphony, the chosen samples are different.
The scenes of the test dataset are built using the same rules from a set of 440 event samples, using 40 samples per class, and 3 back-ground samples. For each of the 18 experimental conditions, the simulation is replicated 3 times, leading to a dataset of 54 acoustic scenes, with each scene being 2 minutes long. For each replication, the onset locations are different. The total duration of the develop-ment and test datasets is 34 and 108 minutes, respectively.
3. EVALUATION
3.1. Metrics
Among the four metrics considered in the DCASE 2016 challenge [4], the class-wise event-based F-measure (Fcweb) is considered in this paper for providing a statistical analysis of the results. This met-ric, which was also used in DCASE 2013 [1] and on evaluating the scene synthesizer used in this work [3], assumes a correctly identi-fied sound event if its onset is within 200 ms from a ground truth onset with the same class label. Results are computed per sound event class and are subsequently averaged amongst all classes.
3.2. Statistical Analysis
Contrary to the data published in the DCASE 2016 Challenge web-site [2] where the computation of the performance is done by con-catenating all acoustic scenes along time and computing a single metric, here performance is computed separately for each acoustic scene of the evaluation corpus, and averaged for specific groups of recordings, allowing us to perform statistical significance analyses. Once computed, analysis of the results is done in 3 steps. First, results are considered globally, without considering the different ex-perimental conditions individually. Differences between systems are analysed using a repeated measure ANOVA [5] with one fac-tor being the different systems. Second, the performance difference between monophonic and polyphonic acoustic scenes is analysed using a repeated measure ANOVA with one within-subject factor being the different systems and one between-subject factor being the monophonic/polyphonic factor. Third, the impact of nec and EBR on the performance of the systems considering separately the monophonic and polyphonic acoustic scenes is evaluated. For nec, the differences between the systems are evaluated using a repeated measure ANOVA with one within-subject factor being the different systems and one between-subject factor being nec. For the EBR factor, performance differences between systems are analysed using
System Features Classifier Background Reduction Estimation Komatsu[9] VQT NMF-MLD x Choi[10] Mel DNN x x Hayashi 1[11] Mel BLSTM-PP x Hayashi 2[11] Mel BLSTM-HMM x Phan[12] GTCC RF x Giannoulis[13] Mel CNMF x Pikrakis[14] Bark Template matching x
Vu[15] CQT RNN
Gutierrez[16] MFCC KNN x Kong[17] Mel DNN
Baseline[18] VQT NMF
Table 2: DCASE 2016 - Task 2: description of submitted systems. For brevity, acronyms are defined in the respective citations.
a repeated measure ANOVA with 2 within-subject factors, namely the different systems and the EBR.
For the repeated measure ANOVA, the sphericity is evaluated with a Maulchy test [6]. If the sphericity is violated, the p-value is computed with a Greenhouse-Geisser correction [7]. In this case, we note pggthe corrected p-value. Post hoc analysis is done by fol-lowing the Tukey-Kramer procedure [8]. A significance threshold of α = 0.05 is chosen.
4. SYSTEMS
For Task 2, 10 systems were submitted from various international research laboratories together with one baseline system provided by the authors. An outline of the evaluated systems is provided in Ta-ble 2. Most systems can be split into several successive processing blocks: a feature computation step optionally preceded by a denois-ing step (either estimatdenois-ing the background level in a traindenois-ing stage or performing background reduction) and a classification step where for each feature frame one or several event labels may be triggered. Considering feature extraction, several design options have been taken, which are summarised below:
• mel/bark: auditory model-inspired time/frequency represen-tations with a non linear frequency axis
• VQT/CQT: variable- or constant-Q transforms • MFCC: Mel-frequency cepstral coefficients • GTCC: Gammatone filterbank cepstral coefficients Several classifiers have been considered to process those fea-tures, ranging from nearest neighbour classifiers to spectrogram fac-torisation methods (such as NMF) to deep neural networks (such as RNNs). Classifiers are outlined in Table 2, with more details to be found in the respective technical report of each submission [9]-[18].
5. RESULTS
5.1. Global Analysis
Results in terms of Fcwebare plotted on Fig. 1. An ANOVA analysis on Fcwebshows a positive effect of the system type: F [10, 530] = 466, pgg < 0.01 (F stands for the F-statistic and its arguments stand for the degrees of freedom for systems and error, respec-tively). Post hoc analysis clusters systems into 4 groups where each pair of systems within a group does not have any statistical differ-ences in terms of performance:
KomatsuHayashi 1Hayashi 2
Choi Phan
GiannoulisPikrakisGutierrez Vu Baseline Kong Fcweb 0 0.1 0.2 0.3 0.4 0.5 0.6 0.7 0.8
Figure 1: Global performance of the systems submitted to DCASE
2016 - Task 2, in terms of Fcweb. Baseline performance is shown
with a straight line.
1. Komatsu, Hayashi 1, Hayashi 2 and Choi: performance ranges from 67% (Choi) to 71% (Komatsu);
2. Phan, Giannoulis and Pikrakis: performance ranges from 34% (Pikrakis) to 36% (Phan);
3. Baseline, Vu and Gutierrez: performance ranges from 21% (Baseline) to 23% (Gutierrez);
4. Kong: performance is 2%.
Among the 10 systems, 7 significantly improve upon the Base-line. Systems of Group 2 improve around 15%, while those of Group 1 reach an improvement close to 45%. The impact of the chosen classifier is difficult to grasp from the analysis of the results, as there is a wide variety of chosen architecture for the systems of Group 1. Concerning features though, 3 among 4 use Mel spectro-grams. Background estimation/reduction is of importance, as the 3 systems that do not explicitly handle it have the lowest performance. The least performing system is Kong as its results are system-atically below the baseline. One possible explanation of this weak performance is the poor management of the training phase of the DNN classifier [17]. It is known that such architecture requires a large amount of data in order to be robustly trained, and without any data augmentation strategy such as the one used by Choi [10], the amount of data provided with the training dataset is not sufficient. The performance of Kong will therefore not be discussed further.
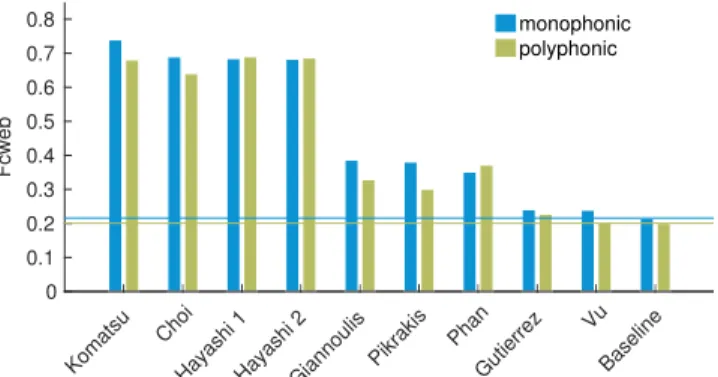
5.2. Monophonic vs. Polyphonic Scenes
Results by scene type (monophonic vs. polyphonic scenes) are
plot-ted on Fig. 2. The ANOVA analysis performed on Fcweb shows
a positive effect of the type of system (F [9, 468] = 358, pgg < 0.01), but no significant effect of polyphony (F [1, 52] = 3.5, p = 0.07). An interaction between scene type and system is never-theless noted.
Thus, perhaps surprisingly, the scene type does not affect sys-tem performance, as the syssys-tems are on average able to handle both scene types equivalently. Post hoc analysis on the scene type shows that among the 10 systems, 4 have their performance reduced while considering polyphonic scenes: Choi, Giannoulis, Komatsu and Pikrakis. For those systems, performance is reduced for polyphonic scenes, which probably explains the significant effect of interaction between scene type and system showed by the ANOVA analysis.
Post hoc analysis on the type of system considering
mono-phonic or polymono-phonic scenes allows us to cluster submitted systems
Komatsu Choi
Hayashi 1Hayashi 2Giannoulis Pikrakis Phan Gutierrez Vu Baseline Fcweb 0 0.1 0.2 0.3 0.4 0.5 0.6 0.7 0.8 monophonic polyphonic
Figure 2: Impact of polyphony on the performance of the systems
submitted to DCASE 2016 - Task 2, in terms of Fcweb. Baseline
performance is shown with a straight line.
into the same 3 groups as those identified with the global perfor-mance, with the Kong system being removed. The only difference is the loss of the significant difference between systems Gutierrez and Pikrakis on polyphonic scenes.
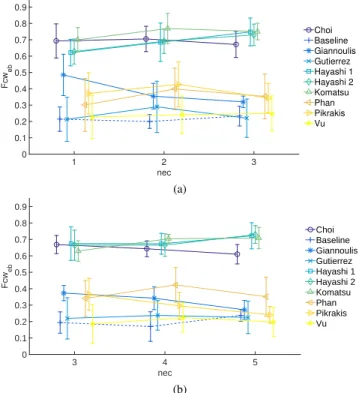
5.3. Background Level
Results on varying levels of background noise are plotted on Fig. 3a for monophonic scenes. The ANOVA analysis shows a significant effect of the type of system (F [9, 72] = 80, pgg< 0.01), the EBR (F [2, 16] = 164, pgg< 0.01), and their interaction (F [18, 144] = 6.5, pgg < 0.01). This interaction shows that the higher the EBR, the better the system performs, and this stands for all the systems except one: Komatsu.
For the Post hoc analysis, we study if the submitted systems reach performance that is significantly superior to the one achieved
by the baseline. To summarize the results for the monophonic
scenes, the Komatsu system achieves the best performance, partic-ularly for high levels of background (EBR = −6dB). This is the only system that has its performance decreasing as a function of the EBR, probably due to the proposed noise estimation dictio-nary learned during the test phase. The systems of Choi, Hayashi
1and Hayashi 2 systematically perform better than the others and
equal the Komatsu system for EBR of 0 and +6dB. For those 3 systems, raising the background level (6dB → −6dB) leads to a drop of performance of about 10%. The remaining systems out-perform the baseline only for some levels of EBR. Those systems appear not to handle robustly the background, as their performance is notably lower as a function of its level, from −10 to −20% for an EBR of 6dB to −6dB. Only Gutierrez maintains its superiority with respect to the baseline in all cases.
Considering polyphonic scenes, results are plotted on Fig. 3b. The ANOVA analysis shows a significant effect of the type of sys-tem (F [9, 72] = 113, pgg < 0.01), of the EBR (F [2, 16] = 127, pgg < 0.01), and of their interaction (F [18, 144] = 15, pgg < 0.01). As with the monophonic scenes, the higher the EBR, the better the system performs, and this stands for all systems except one: Komatsu. Results for polyphonic scenes are thus similar to the ones achieved on monophonic scenes at the exception of 1) Vu, Pikrakisand Gutierrez that have performance equivalent to that of the baseline for all EBR levels and 2) Phan, which reaches perfor-mance that is above the baseline for EBRs of 0 and +6dB.
EBR -6 0 6 Fcw eb 0 0.1 0.2 0.3 0.4 0.5 0.6 0.7 0.8 0.9 Choi Baseline Giannoulis Gutierrez Hayashi 1 Hayashi 2 Komatsu Phan Pikrakis Vu (a) EBR -6 0 6 Fcw eb 0 0.1 0.2 0.3 0.4 0.5 0.6 0.7 0.8 0.9 Choi Baseline Giannoulis Gutierrez Hayashi 1 Hayashi 2 Komatsu Phan Pikrakis Vu (b)
Figure 3: Impact of the background level (EBR) on the perfor-mance of the systems submitted to DCASE 2016 - Task 2, consid-ering Fcwebfor (a) monophonic and (b) polyphonic scenes.
5.4. Number of Events
Considering monophonic scenes, results are plotted in Fig. 4a. The ANOVA analysis shows a significant effect of the type of system (F [9, 216] = 264, pgg < 0.01), but not on the number of events (nec) (F [2, 24] = 0.5, p = 0.6). An interaction between the two can nevertheless be observed. Similar conclusions are obtained for polyphonic scenes (Fig. 4b). The ANOVA analysis shows a signif-icant effect of the type of system (F [9, 216] = 170, pgg < 0.01), but not of nec (F [2, 24] = 0.1, p = 0.9) and some interaction between the two. Consequently, it is difficult to conclude on the influence of nec on the differences between systems.
Some trends can be observed though. For monophonic scenes, augmentation of the number of events leads to a systematic per-formance improvement of 2 systems (Hayashi 1, Hayashi 2) and a decrease for 1 system (Giannoulis). For polyphonic scenes, an improvement is observed for 3 systems (Hayashi 1, Hayashi 2, Ko-matsu) and a decrease for 3 others (Giannoulis, Pikrakis, Choi). Contrary to the level of background which on average reduces the performance of the systems, it appears that the impact of the num-ber of events varies from system to system. Hayashi 1 and Hayashi 2react positively to the augmentation of nec whereas Giuliano has its performance systematically decreasing, probably due to different miss detection / false alarm tradeoffs.
6. DISCUSSION
Among the 3 experimental factors evaluated, only the EBR seems to have a significant influence on the performance of the algorithm. No significant impact is observed for the polyphony and the
num-nec 1 2 3 Fcw eb 0 0.1 0.2 0.3 0.4 0.5 0.6 0.7 0.8 0.9 Choi Baseline Giannoulis Gutierrez Hayashi 1 Hayashi 2 Komatsu Phan Pikrakis Vu (a) nec 3 4 5 Fcw eb 0 0.1 0.2 0.3 0.4 0.5 0.6 0.7 0.8 0.9 Choi Baseline Giannoulis Gutierrez Hayashi 1 Hayashi 2 Komatsu Phan Pikrakis Vu (b)
Figure 4: Impact of the number of events (nec) on the performance of the systems submitted to DCASE 2016 - Task 2, considering Fcwebfor (a) monophonic and (b) polyphonic scenes.
ber of events. Those results clearly demonstrate the usefulness of considering carefully the background in the design of the system.
For all the EBRs considered, 4 systems (Hayashi 1, Hayashi 2, Komatsu and Choi) significantly have better performance than the baseline. Among those, Komatsu is the only one that obtains significantly higher performance than the other systems, this for an EBR of −6dB. Thus, the Komatsu system can be considered as the system with the best generalization capabilities, thanks to an efficient modelling of the background.
In light of those results, we believe that considering simulated acoustic scenes is very useful for acquiring knowledge about the properties and the behaviors of the evaluated systems in a wider variety of conditions that can be tested using recorded and anno-tated material. We acknowledge that the sole use of simulated data cannot be considered for definitive ranking of systems. Though, considering only recorded and manually annotated data as of to-day’s scale does not allow researchers to precisely quantify which aspect of complexity of the scene is impacting the relevant issues to tackle while designing recognition systems. Recorded data are in-deed often scarce resources as the design of large datasets that have a wide variety of recording conditions is complex and costly. Also, reaching a consensus between annotators can be hard.
Taking a more methodological view, such a use of simulated data has recently received a lot of attention in machine learning re-search, inspired by experimental paradigms that are commonly used in experimental psychology and neuroscience where a special care of the stimuli is taken in order to inspect a given property of the system under scrutiny. This principle led to some interesting out-comes in a slightly different paradigm for a better understanding of the inner behavior of deep learning architectures [19, 20].
7. REFERENCES
[1] D. Stowell, D. Giannoulis, E. Benetos, M. Lagrange, and M. D. Plumbley, “Detection and classification of acous-tic scenes and events,” IEEE Transactions on Multimedia, vol. 17, no. 10, pp. 1733–1746, October 2015.
[2] http://www.cs.tut.fi/sgn/arg/dcase2016/, 2016 challenge on Detection and Classification of Acoustic Scenes and Events (DCASE 2016).
[3] G. Lafay, M. Lagrange, M. Rossignol, E. Benetos, and A. Roebel, “A morphological model for simulating acous-tic scenes and its application to sound event detection,” IEEE/ACM Transactions on Audio, Speech, and Language Processing, vol. 24, no. 10, pp. 1854–1864, October 2016. [4] A. Mesaros, T. Heittola, and T. Virtanen, “Metrics for
poly-phonic sound event detection,” Applied Sciences, vol. 6, no. 6, 2016.
[5] J. Demˇsar, “Statistical comparisons of classifiers over multiple data sets,” Journal of Machine learning research, vol. 7, no. Jan, pp. 1–30, 2006.
[6] J. W. Mauchly, “Significance test for sphericity of a normal n-variate distribution,” Ann. Math. Statist., vol. 11, no. 2, pp. 204–209, June 1940.
[7] S. W. Greenhouse and S. Geisser, “On methods in the analysis of profile data,” Psychometrika, vol. 24, no. 2, pp. 95–112, 1959.
[8] J. W. Tukey, “Comparing individual means in the analysis of variance,” Biometrics, vol. 5, no. 2, pp. 99–114, 1949. [9] T. Komatsu, T. Toizumi, R. Kondo, and Y. Senda, “Acoustic
event detection method using semi-supervised non-negative matrix factorization with a mixture of local dictionaries,” DCASE2016 Challenge, Tech. Rep., September 2016. [10] I. Choi, K. Kwon, S. H. Bae, and N. S. Kim, “DNN-based
sound event detection with exemplar-based approach for noise reduction,” DCASE2016 Challenge, Tech. Rep., September 2016.
[11] T. Hayashi, S. Watanabe, T. Toda, T. Hori, J. L. Roux, and K. Takeda, “Bidirectional LSTM-HMM hybrid system for polyphonic sound event detection,” DCASE2016 Challenge, Tech. Rep., September 2016.
[12] H. Phan, L. Hertel, M. Maass, P. Koch, and A. Mertins, “Car-forest: Joint classification-regression decision forests for over-lapping audio event detection,” DCASE2016 Challenge, Tech. Rep., September 2016.
[13] P. Giannoulis, G. Potamianos, P. Maragos, and A. Katsama-nis, “Improved dictionary selection and detection schemes in sparse-cnmf-based overlapping acoustic event detection,” DCASE2016 Challenge, Tech. Rep., September 2016. [14] A. Pikrakis and Y. Kopsinis, “Dictionary learning
as-sisted template matching for audio event detection (legato),” DCASE2016 Challenge, Tech. Rep., September 2016. [15] T. H. Vu and J.-C. Wang, “Acoustic scene and event
recog-nition using recurrent neural networks,” DCASE2016 Chal-lenge, Tech. Rep., September 2016.
[16] J. Gutierrez-Arriola, R. Fraile, A. Camacho, T. Durand, J. Jar-rin, and S. Mendoza, “Synthetic sound event detection based on MFCC,” DCASE2016 Challenge, Tech. Rep., September 2016.
[17] Q. Kong, I. Sobieraj, W. Wang, and M. Plumbley, “Deep neural network baseline for DCASE challenge 2016,” DCASE2016 Challenge, Tech. Rep., September 2016. [18] E. Benetos, G. Lafay, and M. Lagrange, “DCASE2016 task
2 baseline,” DCASE2016 Challenge, Tech. Rep., September 2016.
[19] I. J. Goodfellow, J. Shlens, and C. Szegedy, “Explaining and harnessing adversarial examples,” in International Conference on Learning Representations, May 2015.
[20] A. Nguyen, J. Yosinski, and J. Clune, “Deep neural networks are easily fooled: High confidence predictions for unrecogniz-able images,” in 2015 IEEE Conference on Computer Vision and Pattern Recognition (CVPR), June 2015, pp. 427–436.