UNIVERSITÉ DE MONTRÉAL
CYANOBACTERIA IN SURFACE AND BANK FILTERED DRINKING WATER SOURCES: APPLICATION OF PHYCOCYANIN PROBES FOR MONITORING BLOOMS
PIROOZ PAZOUKI
DÉPARTEMENT DES GÉNIES CIVIL, GÉOLOGIQUE ET DES MINES ÉCOLE POLYTECHNIQUE DE MONTRÉAL
MÉMOIRE PRÉSENTÉ EN VUE DE L’OBTENTION DU DIPLÔME DE MAÎTRISE ÈS SCIENCES APPLIQUÉES
(GÉNIE CIVIL) MAI 2016
UNIVERSITÉ DE MONTRÉAL
ÉCOLE POLYTECHNIQUE DE MONTRÉAL
Ce mémoire intitulé:
CYANOBACTERIA IN SURFACE AND BANK FILTERED DRINKING WATER SOURCES: APPLICATION OF PHYCOCYANIN PROBES FOR MONITORING BLOOMS
présenté par : PAZOUKI Pirooz
en vue de l’obtention du diplôme de : Maîtrise ès sciences appliquées a été dûment accepté par le jury d’examen constitué de :
M. BAUDRON Paul, Doctorat, président
Mme DORNER Sarah, Ph. D., membre et directrice de recherche Mme PRÉVOST Michèle, Ph. D., membre et codirectrice de recherche Mme TUFENKJI Nathalie, Ph. D., membre
DEDICATION
To Majzoob.
ACKNOWLEDGEMENTS
Firstly, I am grateful to The Almighty God for giving me strength an ability to understand learns and complete this thesis.
My deepest gratitude for all the guidance and encouragement I received over the course of my training from my principle supervisor, Dr. Sarah Dorner. This work would not have been possible without her support and patience.
Dr. Michèle Prévost, my co-supervisor, provided invaluable advice, particularly for my publication. I am very grateful for her support.
Special thanks to many individuals whose talents and skills I benefited from, including Dr. Arash Zamyadi, Shokoufeh Noor, Jacinthe Mailly’, Lab technical staffs, Yves Fontaine, Mireille Blais, Julie Philibert, and Irina Moukhina from Université du Québec à Montréal’s (UQAM) Biological Sciences department, for their technical help.
I would like to acknowledge the Town of Sainte-Marthe-sur-le-Lac for its financial support as well as Rodney Bouchard of the Union Water Supply, for providing me with valuable data and great support about Lake Erie.
I would be remiss to not mention and sincerely thank the support and love of my family - my parents, Parviz and Minoo; my dear brothers, Dr. Shahram and Dr. Babak, my sisters and my friends, Maryam and Marjan, who helped me with thin and thick. They all kept me going, and this thesis would not have been possible without them.
RÉSUMÉ
Les cyanobactéries sont une préoccupation pour les sources d'eau potable étant donné les impacts anticipés des changements climatiques et de l'eutrophisation des plans d'eau. L'objectif principal de ce projet de Maitrise était de proposer un système rapide, à faible coût pour le suivi des cyanobactéries dans les sources d'eau potable. Plus précisément, l'objectif était d'évaluer la précision des sondes à phycocyanine (PC) pour le suivi des cyanobactéries en continu. Pour valider la sonde de PC pour mesurer les concentrations des cyanobactéries et l'abondance du phytoplancton, les résultats de sonde ont été comparés à des comptes cellulaires taxonomiques provenant d'échantillons choisis de l'eau brute.
Le système de suivi a été validé à deux sites, l'un sur le lac Érié en Ontario et l'autre au sud du Québec. Les deux sites sont des sources d’eau potable touchées par des fleurs de cyanobactéries récurrentes. La validation des mesures de la sonde (en Ratio d’Unités de Fluorescence ou « Ratio Fluorescence Units » en Anglais (RFU)) a été effectuée pour comparer les concentrations et biovolumes de cyanobactéries et de phytoplancton. Les échantillons choisis provenaient de l'eau brute d’une prise d'eau sur le lac Érié et un système d’approvisionnement en eau potable traitée par un massif filtrant au sud du Québec. Les analyses de corrélation et de régression ont été réalisées en comparant les biovolumes de cyanobactéries et les résultats des mesures à l'aide de la sonde de PC. Les mesures de la sonde étaient significativement corrélées aux biovolumes cyanobactériens aux deux sites (r> 0,6, p <0,00001).
Les résultats des deux sites montrent que les concentrations de cyanobactéries étaient souvent faibles. Un seuil d'alerte a été déterminé en fonction des résultats de cette étude et comparé aux résultats d’études précédentes. La sonde de PC a également été utilisée pour estimer l'efficacité du massif filtrant par la mesure des valeurs RFU de deux lacs et l'eau de puits passée par le massif filtrant. Les sondes de PC sont des outils de suivi utiles qui peuvent être appliqués pour le contrôle de la qualité de l’eau potable lors de proliférations de cyanobactéries menant à des conditions d'eau brute variant rapidement.
ABSTRACT
Cyanobacteria are a growing concern in drinking water sources given rising temperatures from global climate change and increasing eutrophication of water bodies. The main goal of this project was to propose a rapid, low cost monitoring system by applying an in situ phycocyanin in drinking source waters. More specifically, the objective was to evaluate the accuracy of phycocyanin (PC) probes for monitoring cyanobacteria in source waters. Continuous monitoring was conducted using an online fluorescence probe to measure phycocyanin. To validate the PC probe for cyanobacteria and phytoplankton abundance results were compared to traditional taxonomic cell counts from raw water grab samples. Two field sites, one on Lake Erie in Ontario and the other in Southern Québec, Canada were used to test the proposed monitoring system. Validation of probe measurements (in Ratio Fluorescence Units (RFU)) was conducted to compare cyanobacteria density, cyanobacteria biovolume, phytoplankton density and phytoplankton biovolume using grab samples from field sites that included intake water (Lake Erie) and surface waters and well water that passed through bank filtration (Southern Québec). Correlation and regression analyses were conducted between cyanobacterial cell biovolumes and in situ cyanobacteria measurement results using the PC probe. Probe measurements were significantly correlated to cyanobacterial biovolumes at both field sites (r>0.6, p<0.00001). Results from both sites show that cyanobacteria concentrations were often low, and an alert threshold was determined based on results from this study and compared to results from previous investigations. At the field site in Québec, the PC probe was also used to estimate the efficiency of bank filtration through the measurement of RFU values from two lakes and bank filtered well water. PC probes are useful monitoring tools that can be applied to monitor the quality of drinking water sources and their rapidly varying raw water conditions during blooms.
TABLE OF CONTENTS
DEDICATION … ... III ACKNOWLEDGEMENTS ... IV RÉSUMÉ ……… ... V ABSTRACT ……….. ... VI TABLE OF CONTENTS ...VII LIST OF TABLES ... X LIST OF FIGURES ...XII LIST OF SYMBOLS AND ABBREVIATIONS... XV LIST OF APPENDICES ... XVI
CHAPTER 1 INTRODUCTION ... 1
CHAPTER 2 LITERATURE REVIEW ... 3
2.1 Cyanobacteria monitoring guidelines for drinking water production ... 4
2.1.1 Use of submersible fluorescence probes for cyanobacterial monitoring ... 6
2.2 Cyanobacteria passage through bank filtration ... 8
2.3 History of cyanobacterial blooms in Lake Erie ... 10
2.4 Diversity of cyanobacteria in Lake Erie ... 15
2.5 Application of remote sensing and fluorescence for phytoplankton monitoring in Lake Erie ………. ... 16
2.6 Summary of research needs ... 17
CHAPTER 3 OBJECTIVES AND HYPOTHESES ... 18
CHAPTER 4 MATERIALS AND METHODS ... 20
4.1 Site locations ... 20
4.3 YSI instrument, specification, calibration ... 21
CHAPTER 5 RESULTS AND DISCUSSION – LAKE ERIE ... 23
5.1 Environmental variables (temperature, pH, turbidity, chlorophyll a) ... 23
5.2 Temporal dynamics of phytoplankton ... 23
5.2.1 Phytoplankton distribution ... 23
5.2.2 Temporal distribution of cyanobacteria ... 27
5.2.3 In vivo monitoring and comparison to taxonomic counts ... 30
5.2.4 Efficiency of treatment process to remove the cyanobacteria ... 34
5.2.5 Microcystin LR ... 34
CHAPTER 6 ARTICLE 1 : BREAKTHROUGH OF CYANOBACTERIA IN BANK FILTRATION …… ... 37
6.1 Introduction ... 38
6.2 Materials and methods ... 40
6.2.1 Study Site ... 40
6.2.2 Water and sediment sampling and analysis ... 41
6.2.3 Statistical analyses and log removal calculations ... 42
6.3 Results and discussion ... 44
6.3.1 Lake water characterization and in situ monitoring ... 44
6.3.2 Phytoplankton species and toxins in lakes, wells and sediments ... 47
6.4 Log removal during bank filtration ... 53
6.5 Conclusions ... 57
SUPPLEMENTARY INFORMATION ... 62
CHAPTER 7 GENERAL DISCUSSION - PERFORMANCE OF ONLINE PHYCOCYANIN MONITORING TO ESTABLISH LOCAL ALERT LEVELS FOR CYANOBACTERIA ... 71
7.2 Applying the local Alert level threshold to Lake Erie ... 73
CHAPTER 8 CONCLUSIONS AND RECOMMENDATIONS... 74
REFERENCES …….. ... 75
LIST OF TABLES
Table 2-1: Alert level frameworks for cyanobacteria in source and recreational waters ... 5
Table 2-2: Spectral groups of microalgae (Beutler et al., 2002) ... 7
Table 2-3: Selected studies on the removal of microorganisms and toxins relevant for bank filtration. ... 9
Table 2-4: History of cyanobacterial blooms in Lake Erie ... 11
Table 2-5: A summary of the diversity of phytoplankton in Lake Erie ... 15
Table 3-1: Specific objectives and hypothesis of the research of this project ... 19
Table 4-1: proposed cyanobacteria monitoring protocol in Lake Erie ... 21
Table 5-1 Cellular volume of different cyanobacterial species observed in Lake Erie ... 30
Table 5-2: Correlations between PC RFU probe readings and taxonomic cell counts from grab samples (n=53) expressed in biovolume (mm3L-1). ... 32
Table 6-1: General water quality characteristics of well water and Lakes A and B from the mean values of grab samples collected at 0.5 m below the surface from July to October 2013 (n=15). ... 46
Table 6-2: Average log removal (± standard deviation) for cyanobacteria and other phytoplankton estimated from taxonomic counts in Lakes A and B and in well water. Concentrations of Chlorophyceae, Diatomophyceae and Dinophyceae were below detection limits in well water, thus the log removal was considered > 3 Log and are not included in the table. ... 55
Table 6-3: Mean log removal of microbial indicators by bank filtration computed from flow weighted mean values from Lakes A and B and concentrations in well water. ... 56
Table 6-4: Selected studies on the removal of microorganisms and toxins relevant for bank filtration. ... 66
Table 6-5: Mean cyanobacteria cell volumes from all sites during the period of study. ... 68
Table 6-6: Frequency of positive detection of cyanobacteria species in well water samples as a function of cell size. ... 69
Table 6-7: Maximum potential concentration of microcystin (µg/L) in well water calculated based on two scenarios of New Zealand MPMC (New Zealand Ministry for the Environment
and the Ministry of Health, 2009) and WHO MPMC (WHO, 1999) and measured M.
aeruginosa abundance (cell/mL) in well water. ... 70
Table 7-1 Estimated RFU equivalent values and maximum potential microcystin concentrations (MPMC) linked to cyanobacterial biovolume thresholds ... 72
LIST OF FIGURES
Figure 4.1: Lake Erie, the western basin is indicated by red arrows. ... 20 Figure 5.1: Temporal variation of phytoplankton total biovolume from raw water intake grabs
samples. ... 25 Figure 5.2: Temporal variation of phytoplankton abundance from raw water intake grabs samples. ... 26 Figure 5.3: The distribution of cyanobacteria biovolumes from grab samples from the raw water
intake on Lake Erie (2012 – 2014). ... 28 Figure 5.4: The distribution of cyanobacterial abundance (cell/mL) from grab samples from the
raw water intake on Lake Erie (2012 – 2014). ... 29 Figure 5.5: Evolution of phycocyanin measured by PC probe during the study period. ... 31 Figure 5.6: Correlation between online phycocyanin RFU measured by in situ submersible PC
probe and I) Microcystis aeruginosa as dominant CB specie expressed in mm3L-1, II) potentially toxic cyanobacteria biovolume, III) Total cyanobacteria biovolume. ... 33 Figure 5.7: Maximum potential microcystin concentrations given concentrations of cyanobacteria,
left; total cyanobacteria biovolume (mm3/L), right; total cyanobacteria biovolume (cell/mL)
and right: Microcystis aeruginosa abundance (cell/mL). ... 34 Figure 5.8: Linear regressions between MC-LR eq. concentration (µg/L) and left: in situ PC
fluorescence RFU at the exact time of sampling and right: in situ PC fluorescence cell mL-1. ... 35 Figure 6.1: a) Location of the study site, Lake A and Lake B situated in southern Quebec, Canada;
b) Schematic of bank filtration system. ... 39 6.2: PC fluorescence (RFU) at various depths in (a) Lake A and (b) Lake B for all samples
combined; Time series of PC fluorescence as a mean of (c) points A1 and A2 in Lake A between July and October 2013, and (d) and of B1 and B2 in Lake B. ... 45 Figure 6.3: Correlations between PC RFU estimated by probes in Lakes A and B with well water.
The RFU in Lake B is the log transformed mean value of interpolated probe readings from all measured depths (0.5m, 1m, 5m, and 10m) from stations B1 and B2. RFUs in Lake A are
the log transformed mean of interpolated probe readings from all measured depths (0.5m, 1m, 5m, 10m) from the two points closest to wells (A1 and A2). ... 48 Figure 6.4: Distribution of the biovolume of cyanobacterial genera in I) Lake A, II) Lake B, III)
well water samples from August 2013 to March 2014. The total cyanobacterial biovolume in mm3/L is shown above each bar in the graph. Other genera include: Chroococcus sp., Planktolyngbya sp., Coelosphaerium sp., Cyanodictyon sp., Cryptomonas sp. ... 50
Figure 6.5: Distribution of the biovolume of cyanobacterial genera in I) sediments, II) scum. The total cyanobacterial biovolume in mm3/L is shown above each bar in the graph. Other genera include: Chroococcus sp., Planktolyngbya sp., Coelosphaerium sp., Cyanodictyon sp., Cryptomonas sp. ... 51
Figure 6.6: Principle Component Analysis of mean biovolumes of cyanobacteria species (mm³/L) at each site. ... 52 Figure 6.7: Log removal based on phycocyanin RFU passing through bank filtration from Lakes
A and B with and without considering travel time using flow weighted mean interpolated probe readings from B1 and B2 for Lake B and A1 and A2 for Lake A. The dotted black line is the Log removal of mean RFU from probe readings at 10 m depth in Lake B (B1 and B2) without considering flow weighted means. ... 54 Figure 6.8: Environmental variable profiles as measured by in situ PC multi-probe from all
measurement points in Lake A (A1, A2, A3 and A4) and Lake B (B1 and B2). ... 62 Figure 6.9: Correlation between PC RFU estimated by probes in Lakes A and B and corresponding
cyanobacteria biovolume (mm3/L) from Lakes A and B. ... 63 Figure 6.10: Distribution of the biovolume of plankton species in I) Lake A, II) Lake B, III) well
water samples from August 2013 to March 2014. The total biovolume in mm3/L is shown above each bar in the graph. ... 64 Figure 6.11: Distribution of the biovolume of plankton species in I) sediments, II) scum. The total
biovolume in mm3/L is shown above each bar in the graph. ... 65 Figure 7.1: Application of the local RFU threshold and comparison with other alert levels. The
dashed lines represent PC RFU concentration measured by in situ PC probe during the study period. The box plots indicate the concentration of Microcystin-LR eq. µg.L-1 as measured
by ELISA kit. The second Y axis represents the maximum potential microcystin concentrationµg.L-1 calculated based on cyanobacteria biovolume thresholds. ... 73
LIST OF SYMBOLS AND ABBREVIATIONS
The list of symbols and abbreviations presents the symbols and abbreviations used in the thesis or dissertation in alphabetical order, along with their meanings. Examples:
CB: Cyanobacteria BF: Bank Filtration MC-LR: Microcystin-LR PC: Phycocyanin
LIST OF APPENDICES
APPENDIX A – MOST COMMON CYANOBACTERIA GENERA ... 84 APPENDIX B – MAXIMUM POTENTIAL OF MICROCYSTIN CONCENTRATION ... 85 APPENDIX C – ENVIRONMENTAL VARIABLES MEASURED BY PC PROBE ... 87
CHAPTER 1
INTRODUCTION
As a result of global change and the disruption of key elemental cycles (C, N, P), large blooms of cyanobacteria in freshwater systems have become more frequent (Taranu et al., 2015) Of particular concern are the toxins produced by cyanobacteria; however, their presence can also disrupt drinking water treatment and lead to non-consumption advisories (Zamyadi et al., 2014). In order to respond quickly to the presence of large numbers of cyanobacterial cells in a drinking water source, monitoring tools and strategies are needed. Since the identification and quantification of cyanobacteria are highly costly and time consuming, on-line continuous monitoring using phycocyanin probes have been conducted recently (Brient et al., 2008; Kahlert & McKie, 2014; Kong et al., 2014; McQuaid et al., 2011; Zamyadi et al., 2012 b). Online monitoring tools also enable rapid and reliable process monitoring. A phycocyanin alert level threshold has been proposed for early warning systems for the operation of drinking water treatment plants (McQuaid et al., 2011). However, these probes and thresholds have only been tested at a limited number of sites and their more widespread use requires further testing.
In recent years, cyanobacteria blooms have been occurring in the western basin of Lake Erie. The presence of cyanobacteria and their toxins in drinking water sources has raised the question of the vulnerability of treatment plants to cyanobacteria blooms in the western basin of Lake Erie. This research is part of a study funded by the Canadian Water Network (CWN) and aims to provide information that can be used for the vulnerability assessment of a drinking water treatment plant affected by cyanobacterial blooms using phycocyanin probes.
Cyanobacteria and cyanotoxins are generally a problem for surface water sources of drinking water. However, groundwater systems could potentially also be vulnerable to cyanobacteria if they are under the influence of surface waters. Bank filtration is an example of a groundwater source of drinking water that could potentially be impacted by cyanobacteria. This Master’s thesis also explores the use of probes for monitoring bank filtered drinking water sources.
Toxin-producing cyanobacteria have become dominant members of bacterial communities during both the summer and early fall period as visible blooms have appeared in surface waters. This has led the public health advisories and a guideline value for microcystin concentrations for drinking water. In Canada, Federal-Provincial-Territorial Committee on Drinking Water proposed, last updated in 2002, a maximum acceptable concentration of 0.0015 mg/L (1.5 µg/L) of total
microcystins in drinking water (Health Canada, 2016). The U.S. Environmental Protection Agency has introduced regulations for microcystins based on drinking water ingestion rates (L/kg/day) for each age group. The EPA has developed two health advisory values related to body weight and drinking water intake by age. The estimated ten-day health advisory values for children less than 6 years old is 0.3 µg/L and 1.6 µg/L for children older than or equal to 6 years (U.S. Environmental Protection Agency, 2015).
Thesis organization
In this thesis, a summary of the literature on the occurrence of cyanobacteria and the application of in vivo fluorescence probes is provided (Chapter 2). Chapter 3 presents the objectives of the research. Two chapters are issued to the methodology and results. The methodology of the research project is presented in Chapter 4. Chapter 5 presents the results from the Lake Erie monitoring project and Chapter 6 present an article submitted for publication on the breakthrough of cyanobacteria in bank filtration and the use of probes for monitoring bank filtered drinking water sources. Chapter 7 provides a general discussion of results from both field sites, notably, the performance of online monitoring using phycocyanin probes to establish local alert levels for taking action to avoid the breakthrough of cyanotoxins in treated drinking water. Finally, Chapter 8 provides the conclusions and recommendations for monitoring cyanobacteria in vulnerable drinking water sources.
CHAPTER 2
LITERATURE REVIEW
The occurrence of cyanobacteria in drinking water sources challenges water treatment utilities, as they can disrupt conventional drinking water treatment processes, cause taste and odour problems through the production of geosmin and methylisoborneol (MIB) (Graham et al., 2012) and lead to toxins breaking through into treated water (Zamyadi et al., 2012 a). Cyanobacteria blooms have a major impact on the quality of surface waters and have been shown to be becoming more frequent, largely related to changes in nitrogen and phosphorus concentrations (Taranu et al., 2015). There are many types of harmful algae or phytoplankton with major groups belonging to dinoflagellates, diatoms and cyanobacteria. Almost forty species of cyanobacteria have the ability to produce various types of toxins (Codd et al., 2005). The production of cyanotoxins in water bodies depends on environmental variables such as temperature, light intensity, nutrient enrichment, the wind and turbulence of water (Muruga et al., 2014; Paerl et al., 2011) and the formation of high density colonies in scums has been associated with the upregulation of cyanotoxin production genes (Wood et al., 2011). In eutrophic freshwater bodies, the cyanobacteria group can be the dominant phytoplankton, although eutrophic conditions are not required for their dominance (Molot, 2010). Although human deaths from direct cyanotoxin exposure have only been noted in one instance attributed to cyanotoxins in water used for dialysis in Brazil (Azevedo et al., 2002), numerous companion animal and livestock deaths have been documented (Hilborn & Beasley, 2015) Cyanotoxins are capable of affecting the nervous system, the liver and the skin of exposed individuals (Davis et al., 2009; Komárek & Komárková, 2002; Long et al., 2001; Pantelić et al., 2013). In Appendix A, a list of common toxin-producing cyanobacteria species and their health effects is provided. More than 80 types of microcystins have been characterised and among all of them, microcystin-LR has been most commonly identified in the literature (WHO, 1999). Other common types of cyanotoxins include anatoxin-a and saxitoxins, as well as cylindrospermopsin (Otten & Paerl, 2015).
Cyanotoxins can be present in both intracellular and extracellular form, with most microcystins generally observed to be intracellular (McQuaid et al., 2011), although the ratio of extracellular to intracellular increases during a bloom season (Grützmacher et al., 2002). In addition, extra-cellular toxins can be adsorbed to suspended sediments and would therefore be found in the particulate phase of natural systems (Maghsoudi et al., 2015). Even low concentrations of cyanobacterial cells
have been shown to accumulate within various drinking water treatment processes leading to high toxin concentrations (Zamyadi et al., 2013 d).
The limitation of various treatment processes to reduce the occurrence of cyanotoxins and cyanobacteria has been observed (Newcombe et al., 2010; Zamyadi et al., 2013 c). Various physiochemical and biological approaches are being used to monitor the efficiency of drinking water treatment processes for the removing cyanobacterial cells and toxins. In this field, There are five common methods for quantifying toxic cyanobacteria: measuring toxin concentrations, chlorophyll a (Chl a) concentrations, cell counts, quantitative real-time PCR (qPCR), and remote sensing (Bridgeman et al., 2013). The gold standard approach involving the measurement of cyanobacterial cells through microscopy is time consuming and expensive. Thus, other approaches such as the use of probes are growing more common (Srivastava et al., 2013).
2.1 Cyanobacteria monitoring guidelines for drinking water production
A review and summary of guidance documents that consider cyanobacteria monitoring and risk assessment are provided in Table 2.1. The guidelines provide a risk management framework for improving the safety of drinking water with regards potentially hazardous concentrations of cyanotoxins. Table 2.1 summarizes alert level frameworks based on three type of measurements of cyanobacterial concentrations including cell numbers, biovolumes or pigment concentrations (e.g. chlorophyll a attributable to cyanobacteria or a specific cyanobacterial pigment detected by fluorometry such as phycocyanin pigment) (Preez & Van Baalen, 2006). The alert levels, their thresholds and actions to be taken are also provided and consider various monitoring approaches including taxonomic counts and the use of phycocyanin probes. The main actions to reduce the risk of cyanotoxins in drinking water focus on the characterisation of the source waters before and after the abstraction, and the optimization of subsequent treatment processes (du Preez et al., 2006). The World Health Organization (WHO)’s framework is the basis of several others and provides three alert levels and strategies consisting of Vigilance Level, Alert Level 1 and Alert Level 2 (WHO, 1999). Following the WHO management framework, other organizations and authors have developed or suggested action plans to be implemented before and during a cyanobacteria bloom
in source waters. Some actions include cyanobacteria identification and enumeration, measurement of cyanotoxins, and mouse test bioassays (Ingrid Chorus, 2012).
Table 2-1: Alert level frameworks for cyanobacteria in source and recreational waters
Alert level Threshold Definition Recommended Actions Reference
Detection Level
> 500 & < 2,000 cells mL cyanobacteria
(Individual species or combined total of any cyanobacteria)
Regular monitoring, Weekly sampling and cell
counts (Newcombe et al., 2010) Alert Level 1 MEDIUM ALERT (30-50% of total CB are potentially toxic) 2,000 cells mL-1 ≤ CB < 6,500
cell mL-1 Microcystis aeruginosa
or,
0.2 mm3L-1 ≤ CB total biovolume
< 0.6 mm3L-1 (as dominated by
CB potentially toxic)
2 weekly sampling at off take and at representative locations in reservoir, toxin monitoring
Alert Level 2 HIGH ALERT (the cyanobacteria present are known toxin-producers.)
(Established bloom of cyanobacteria with the potential
for toxin concentration)
6500 cells/mL ≤CB <65000 cells/mL of Microcystis
aeruginosa or total CB biovolume
0.6 mm3L-1 < CB <6 mm3L-1 (as
dominated by CB potentially toxic), visible CB bloom with high concentration of potentially
toxic CB and exceeded toxin concentration guideline,
Ineffective treatment
health risk assessment considering toxin monitoring data, assessing
the effectiveness of available treatment, continue monitoring as per Level 1, Toxin monitoring of treated water may be
required Alert Level 3 VERY HIGH ALERT toxin concentration > 10x guideline concentration for microcystin. > 65,000 cells m L-1 Microcystis
aeruginosa or the total biovolume
of all cyanobacteria > 6 mm3/L,
May exposed in treated water without effective treatment
Immediate notification of health authorities if this has
not already occurred at Level 1 or 2, Advice to consumers if the
supply is unfiltered, toxin monitoring in source water
and drinking water supply
Alert Level 1 500 to 2000 cells mL-1 Altering off-take depth (Burch et al.,
1993)
Alert Level 2 2000 to 15000 cells mL-1 Deployment of booms
Alert Level 3 > 15000 cells mL
-1
Table 2-1: Alert level frameworks for cyanobacteria in source and recreational waters. (continued)
Alert level Threshold Definition Recommended Actions Reference
Vigilance Level
> 2000 cells/mL CB,
Chl a >1 µg L-1, or
> 0.2 mm3L-1
Increase in monitoring activities and inspection of
the source water at the intakes (WHO, 1999) Alert Level 1 2000 cells/mL< CB<100000 cells/mL, 1 µg L-1 <Chl a <50 µg L-1, or 0.2 mm3L-1< CB<10 mm3L-1 Cyanotoxin monitoring, assessment of the capacity
of treatment to remove cyanobacteria and cyanotoxins, early communications with public health authorities
Alert Level 2
CB >100000 cells/mL,
Chl a >50 µg L-1, or
CB>10 mm3L-1
CB are potentially toxic
Monitoring program, treatment optimizations, consideration of activating
alternative water supply plans, more extensive
media releases
Detection Level CB > 500 cells mL-1 -
(Burch et al., 2003)
Alert Level 1 2000 cells mL-1< CB < 5000 cells mL-1 -
Alert Level 2 5000 cells mL
-1< CB < 50000
cells mL-1 -
Alert Level 3 CB > 50000 cells mL-1 -
Vigilance Level Cyanobacteria > 2000 cells/mL Routine monitoring
(Preez & Van Baalen, 2006) Alert Level 1 2000 cells/mL< CB<100000 cells/mL Phytoplankton identification and enumeration cyanotoxin analysis, mouse bioassay
Alert Level 2 CB >100000 cells/mL 0.8 µg L-1 <microcystin <2.5 µg L-1 Treatment optimisation, continuation of the monitoring program (daily monitoring of cyanobacteria
and cyanotoxins), mouse test bioassays and Response
2.1.1 Use of submersible fluorescence probes for cyanobacterial monitoring
Most current alert levels focus on chlorophyll a concentration and cyanobacteria cell counts (Ahn et al., 2007). Due to potential insufficiency of conventional drinking water treatment for removing taste and odour compounds and cyanotoxins, probes have been proposed as useful tools for early warning systems for monitoring cyanobacteria (Izydorczyk et al., 2005). Alert systems based on cyanobacterial enumeration in raw water are costly, time consuming and thereforeTable 2-2: Spectral groups of microalgae (Beutler et al., 2002)
Spectral
group Peripheral antenna Division
Light Emitting Diodes (LED)
Green Chlorophyll a/b
carotenoids Chlorophyta 450 nm
Blue Phycobilisomes
(Phycocyanin)
Cyanobacteria
Glaucophyta 525 nm
Brown Chlorophyll a/c
Heterokontophyta, Haptophyta, Dinophyta 570 nm Red Phycobilisomes (phycoerythrin) Rhodophyta (some Cyanobacteria) 590 nm
Mixed Chlorophyll a/c
phycobiliprotein Cryptophyta 610 nm
cannot be used to monitor rapid variations in raw water quality from cyanobacterial blooms (Zamyadi et al., 2012 b). The new in situ probes can also be used for rapidly monitoring the spatial distribution and temporal fluctuations of phytoplankton and cyanobacteria in water bodies (Gregor & Maršálek, 2004). The new method uses fluorescence to absorb light at one specific wavelength and emit it at longer wavelength (Lorenzen, 1966). Photosynthetic pigments yield specific fluorescence signals within different wavelength ranges (Beutler et al., 2002; Campbell et al., 1998). Table 2-2 presents the pattern for each type of spectral group of phytoplankton. For instance,
in cyanobacteria the principal light-harvesting complexes are phycobilisomes rather than Chlorophyll a or b (Campbell et al., 1998).
The application of in vivo probes improves the rapid monitoring of the distribution of cyanobacterial cells in source water surveys. Various environmental factors are the driving forces of changes in cyanobacteria concentrations in the ecosystem and can lead to important spatio-temporal heterogeneity in source waters and phytoplankton composition (Rychtecký & Znachor, 2011). Phycocyanin probes are able to measure dynamic profiles of depth and can be used simultaneously with other probes to measure other environmental variables such as temperature, turbidity, pH, and chlorophyll a concentration at many locations within the source waters (Kahlert & McKie, 2014).
Conventional quantification of cyanobacterial species can be in the form of cyanobacteria cells (units of cell mL1 or abundance) or cyanobacteria biovolume (mm3 L-1). Various units have been used to express the density of cyanobacteria biomass in phycocyanin probes. The more commonly applied units in recent assessments are given as total concentration of chlorophyll a expressed in µg L-1 and Ratio Fluorescence Units (RFU) as separate measures of phycocyanin concentration for cyanobacteria. Units of cell mL-1 are not recommended because of the large variability of cell size that can lead to the misinterpretation of probe results (Ahn et al., 2007; McQuaid et al., 2011). The application of phycocyanin probes raise questions about the precision and accuracy of results as various water matrix interferences can occur such as turbidity and the presence of green algae (Zamyadi et al., 2012 c). In turbid waters, a lower accuracy results in false positives in waters with turbidity greater than 50 NTU (Symes & Ogtrop, 2016). Furthermore, phycocyanin pigments are strongly dependent on growth rate and the cell densities of different cyanobacteria (Korak et al., 2015).
2.2 Cyanobacteria passage through bank filtration
Most of the monitoring frameworks have been developed for surface waters. However, little information is available for monitoring cyanobacteria in bank-filtered waters. Cyanobacteria have rarely been observed in bank-filtered water. Table 2-3 presents a summary of studies that have explored bank filtration for the removal of cyanobacteria and cyanotoxins. An expanded version of Table 2-3 is presented in Chapter 6 that includes bank filtration for the removal of bacterial indicators that was submitted as supplementary materials with the manuscript.
Table 2-3: Selected studies on the removal of microorganisms and toxins relevant for bank filtration.
Scale of study Parameter studied Comments References
Field study Synechococcus sp.
Most removal of cyanobacteria occurs in the colmation layer of natural bank filtration (82% in top 3 cm of layer).
(Harvey et al., 2015)
Field study Benthic microalgal and
meiofaunal assemblages
The colmation layer in bank filtration is a highly active and dynamic biological zone. Clogging of the layer is reversible.
(Hoffmann & Gunkel, 2011) Field and column study Bloom dominated by Cylindrospermopsis raciborskii
No cyanobacterial cells or cell fragments were observed in bank filtered well water, cyanotoxins were below detection limits in well water. Cell removal was 95% in top 2 cm of infiltration. (Romero et al., 2014) Field study Prochlorococcus sp., Synechococcus sp., Cyanobacteria, and Pico/ nanoplankton
Bank filtration prior to desalination showed that wells with larger distances from the sea did not have cyanobacterial breakthrough but breakthrough occurred in a horizontal well system with potential hydraulic connections to the source. (Rachman et al., 2014) Field study Limnothrix redekei, Oscillatoria subbrevis, Pseudanabaena catenata, Aphanizomenon sp. Spirulina sp.
A bank filtration production well located 65 m from a river in Brazil did not demonstrate passage of cyanobacterial cells.
(Freitas et al., 2012)
Column studies Microcystin
Physical filtration of cells was important for microcystins removal in slow sand filtration. Little retardation of microcystins from sorption; biodegradation was the more important process as compared to sorption.
(Grützmacher et al., 2009)
Column study Microcystin-LR
A lab cultured strain of Sphingomonas sp. was capable of degrading microcystin LR in slow sand filtration
(Bourne et al., 2006)
Column study Cylindrospermopsin
Cylindrospermopsin degradation only occurred in the sediment, not in the water body. Degradation is more important than retention for the sediments tested.
(Klitzke et al., 2010)
Field study Microcystins
Cyanobacterial cells were generally absent from bank filtered water although some coccoid cells were found at one plant with filamentous cyanobacterial cell fragments. Microcystins were detected in bank filtered water.
(Lahti et al., 2001)
2.3 History of cyanobacterial blooms in Lake Erie
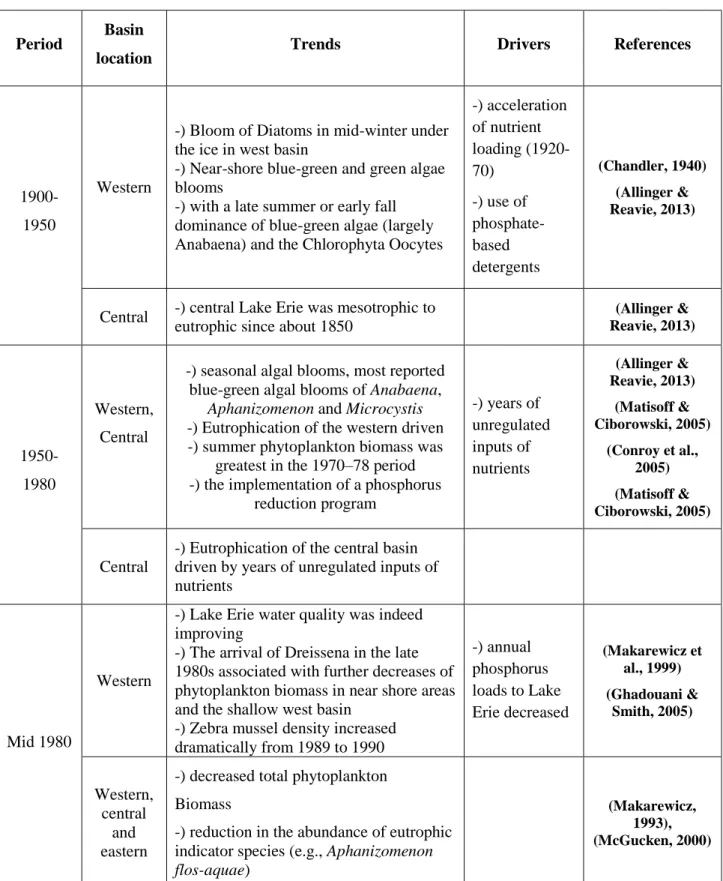
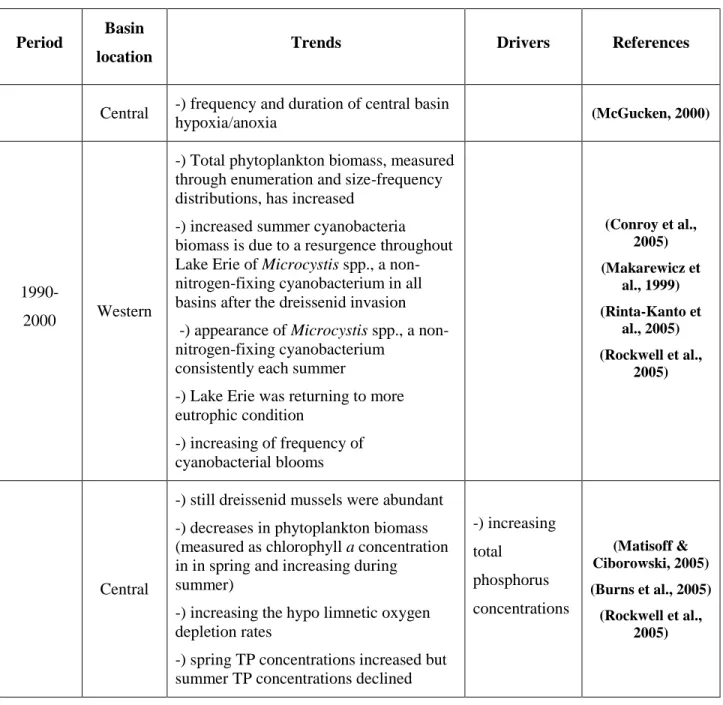
The acceleration of nutrient loading (1920-1970) and pollution from sewage converted Lake Erie into a dead zone (Makarewicz, 1993) and a strategy was adopted by water authorities to avoid further catastrophe. As a result of the implementation of a phosphorus reduction program and regulated nutrient inputs, severe cyanobacterial blooms disappeared in middle of the 1980s (Conroy et al., 2005). The improved water quality in Lake Erie did not hold out for long, as the cyanobacteria blooms reappeared in the western basin of Lake Erie with the arrival of the mussels of the genus Dreissena (zebra mussels). Increasing agricultural nonpoint sources of soluble reactive phosphorus (SRP), the intense spring rains and runoff and other environmental factors such as increasing temperature are considered the main reasons of increasing cyanobacterial bloom frequency in recent years. Table 2-4 summarizes relevant water quality studies for Lake Erie from 1900 to the present day.
Table 2-4: History of cyanobacterial blooms in Lake Erie
Period Basin
location Trends Drivers References
1900-1950
Western
-) Bloom of Diatoms in mid-winter under the ice in west basin
-) Near-shore blue-green and green algae blooms
-) with a late summer or early fall dominance of blue-green algae (largely Anabaena) and the Chlorophyta Oocytes
-) acceleration of nutrient loading (1920-70) -) use of phosphate-based detergents (Chandler, 1940) (Allinger & Reavie, 2013)
Central -) central Lake Erie was mesotrophic to eutrophic since about 1850
(Allinger & Reavie, 2013) 1950-1980 Western, Central
-) seasonal algal blooms, most reported blue-green algal blooms of Anabaena,
Aphanizomenon and Microcystis
-) Eutrophication of the western driven -) summer phytoplankton biomass was
greatest in the 1970–78 period -) the implementation of a phosphorus
reduction program -) years of unregulated inputs of nutrients (Allinger & Reavie, 2013) (Matisoff & Ciborowski, 2005) (Conroy et al., 2005) (Matisoff & Ciborowski, 2005) Central
-) Eutrophication of the central basin driven by years of unregulated inputs of nutrients
Mid 1980
Western
-) Lake Erie water quality was indeed improving
-) The arrival of Dreissena in the late 1980s associated with further decreases of phytoplankton biomass in near shore areas and the shallow west basin
-) Zebra mussel density increased dramatically from 1989 to 1990 -) annual phosphorus loads to Lake Erie decreased (Makarewicz et al., 1999) (Ghadouani & Smith, 2005) Western, central and eastern
-) decreased total phytoplankton Biomass
-) reduction in the abundance of eutrophic indicator species (e.g., Aphanizomenon
flos-aquae)
(Makarewicz, 1993), (McGucken, 2000)
Table 2-4: History of cyanobacterial blooms in Lake Erie (continued)
Period Basin
location Trends Drivers References
Central -) frequency and duration of central basin
hypoxia/anoxia (McGucken, 2000)
1990-2000 Western
-) Total phytoplankton biomass, measured through enumeration and size-frequency distributions, has increased
-) increased summer cyanobacteria biomass is due to a resurgence throughout Lake Erie of Microcystis spp., a non-nitrogen-fixing cyanobacterium in all basins after the dreissenid invasion -) appearance of Microcystis spp., a non-nitrogen-fixing cyanobacterium
consistently each summer
-) Lake Erie was returning to more eutrophic condition -) increasing of frequency of cyanobacterial blooms (Conroy et al., 2005) (Makarewicz et al., 1999) (Rinta-Kanto et al., 2005) (Rockwell et al., 2005) Central
-) still dreissenid mussels were abundant -) decreases in phytoplankton biomass (measured as chlorophyll a concentration in in spring and increasing during
summer)
-) increasing the hypo limnetic oxygen depletion rates
-) spring TP concentrations increased but summer TP concentrations declined
-) increasing total phosphorus concentrations (Matisoff & Ciborowski, 2005) (Burns et al., 2005) (Rockwell et al., 2005)
Table 2-4: History of cyanobacterial blooms in Lake Erie (continued)
Period Basin
location Trends Drivers References
2001-2011 Western
-) using the satellite observation on bloom monitoring
-) Chlorophytes, Bacillariophytes and Cyanobacteria were dominant in 2003, 2004 and 2005 respectively
-) Peak blooms occurred in August or September in all years except 2011, which peaked in early October
-) 2011 the largest harmful algal bloom in its recorded history, with a peak intensity over three times greater than any previously observed bloom -) winter blooms of diatoms occur annually prior to the onset of ice cover -) western Lake Erie may be again moving towards a more eutrophic state -) occurrence of potentially toxic cyanobacteria Microcystis spp. in form of bloom
-) microcystin toxicity exceeding 1 µg L -1 (microcystin-LR activity equivalents)
-) remaining of bloom for two month on summer 2008
-) The Maumee River is the major source of nutrients and suspended sediments to western Lake Erie
-) 80% probability of dominancy of the phytoplankton community as TP greater than 3.23 μM
-) Microcystis is a significant component of the cyanobacterial community in Lake Erie during summer seasons species, specifically Dreissena type -) in 2011 bloom, surface toxin
concentrations could have reached over 4,500 μg/L and water-column integrated concentrations ranging from 0.1 μg/L to 8.7 μg/L in early August -) increases in agricultural nonpoint sources of bioavailable phosphorus, the presence of invasive mussel -) Mixing of blooms in water columns by high wind stress (Rinta-Kanto et al., 2005) (Wynne et al., 2010) (Chaffin et al., 2011) (Bridgeman et al., 2012) (Downing et al., 2005) (Rinta-Kanto et al., 2009) (Michalak et al., 2013) (Stumpf et al., 2012) (Millie et al., 2009) (Twiss et al., 2010)
Table 2-4: History of cyanobacterial blooms in Lake Erie (continued)
Period Basin
location Trends Drivers References
Central -) hypolimnial oxygen depletion continued to occur -) increase of internal phosphorus loading to Lake Erie’s central basin (Matisoff & Ciborowski, 2005) (Cao et al., 2008) Eastern
-) the biomass of phytoplankton, measured as chlorophyll a appeared to be at historically low levels
(Matisoff & Ciborowski, 2005)
2012-
2014 Western
-) Large blooms of toxic or potentially toxic cyanobacterial HABs and the nuisance green alga
-) Overall bloom will be smaller than in 2013 with varying impacts across lake’s western basin
-) cyanobacteria bloom in 2014 plagued northwest Ohio's water(Toledo)
(Kane et al., 2014) (Michalak et al.,
2013) (NOAA, 2014)
Central
dissolved oxygen depletion and hypoxia/anoxia in the central basin continue to be problematic
(Kane et al., 2014) (Obenour et al.,
2014)
2.4 Diversity of cyanobacteria in Lake Erie
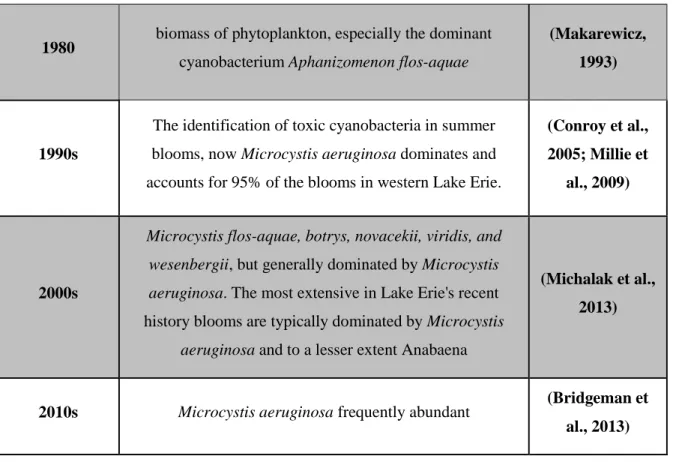
At the beginning of the early twentieth century, the proliferation of undesirable phytoplankton overwhelmed Lake Erie. Even though diatoms were the most abundant at first, the lake continued to experience harmful algal blooms and severe oxygen-depleted “dead zones” for years. Blooms comprised of Microcystis and Anabaena in the western basin appeared with peak cyanobacteria blooms occurring in September and October. Other types of potentially toxic cyanobacteria such as Anabaena spp., Aphanizomenon spp., Lyngbya spp., and planktonic Oscillatoria spp. were also observed. Severe blooms disappeared following phosphorus abatement strategies for Lake Erie. However, since then, diffuse sources of pollution have continued to increase bioavailable nutrients. Recently, Microcystis aeruginosa has become a dominant species in blooms. Table 2-5 presents a brief history of the diversity of phytoplankton in Lake Erie.
Table 2-5: A summary of the diversity of phytoplankton in Lake Erie
Period of study
Dominancy status of the cyanobacterial Community and cyanotoxins in Lake Erie
References
1900s
overall largely comprised of diatoms and cyanobacteria contained genera Microcystis and Anabaena in western
basin
(Davis, 1958)
1950s
A peak in cyanobacterial biomass during the months of September and October, referred to as the “autumnal
maximum.” (Anabaena spp., Aphanizomenon spp.,
Lyngbya spp., and planktonic Oscillatoria spp. — now
reclassified as Planktothrix spp.) The most abundant microcystin during autumn was Aphanizomenon and later
with another filamentous Oscillatoria (Planktothrix) spp.
2.5 Application
of
remote
sensing
and
fluorescence
for
phytoplankton monitoring in Lake Erie
Anthropogenic eutrophication in the Western Basin of Lake Erie challenges the water treatment authorities to implement the remote-sensing tools to improve predictions for better management (Ortiz et al., 2013). In 2005, in situ fluorescence tools were applied on a lake-wide scale to determine the patterns of phytoplankton abundance and cyanobacteria dynamics. Chlorophyll a fluorescence was used to measure spatial and temporal variations of phytoplankton composition and cyanobacterial biomass as a function of depth. Results were then compared with microscopic analyses (Ghadouani & Smith, 2005). Remote sensing has been used with ground-truth data to explain the appearance of blooms in relation to a variety of environmental factors, including lake circulation and residence times (Michalak et al., 2013). Most importantly, NOAA provides bloom
Table 2-5: A summary of the diversity of phytoplankton in Lake Erie (continued)
1980 biomass of phytoplankton, especially the dominant cyanobacterium Aphanizomenon flos-aquae
(Makarewicz, 1993)
1990s
The identification of toxic cyanobacteria in summer blooms, now Microcystis aeruginosa dominates and accounts for 95% of the blooms in western Lake Erie.
(Conroy et al., 2005; Millie et
al., 2009)
2000s
Microcystis flos-aquae, botrys, novacekii, viridis, and wesenbergii, but generally dominated by Microcystis aeruginosa. The most extensive in Lake Erie's recent
history blooms are typically dominated by Microcystis
aeruginosa and to a lesser extent Anabaena
(Michalak et al., 2013)
2010s Microcystis aeruginosa frequently abundant (Bridgeman et
forecasts to be used by water managers and drinking water treatment plants on Lake Erie (Wynne et al., 2013), although these were not able to prevent the do-not-drink advisory in Toledo, Ohio in 2014 resulting from a possible breakthrough of cyanotoxins into drinking water.
2.6 Summary of research needs
A few studies have focused on establishing a source water alert level framework based on online phycocyanin and chlorophyll a probes and cyanobacterial cell densities. However, there is a need to validate these suggested frameworks in other geographical regions with other cyanobacterial communities. The distribution of cyanobacterial cell densities related to alert levels should be determined for local areas to determine the accuracy of local alert levels. Probes have not been tested on Lake Erie drinking water sources that have experienced severe cyanobacterial blooms in recent years.
Given that probes work best when there are few interferences from turbidity and green algae, it is also important to determine whether probes will be useful tools for bank-filtered source water monitoring, even if concentrations of cyanobacteria would be expected to be low and closer to detection limits in bank-filtered water as compared to surface water blooms.
In this Master’s thesis, previously published alert levels will be validated for two additional water sources: 1) Lake Erie and 2) a bank-filtered drinking water supply.
CHAPTER 3
OBJECTIVES AND HYPOTHESES
This research project aimed to increase our understanding of the linkages between conventional monitoring methods from previous studies and a new rapid monitoring method for a drinking water intake in the Western Basin of Lake Erie and a bank-filtered water supply. Plant managers are planning to implement online monitoring to minimize the risk of cyanobacteria breakthrough. This study involved assessing the performance of a submersible phycocyanin probe as a tool for surveillance and management.
The main objectives of the present study are as below:
1) Validate in situ phycocyanin probes reading for cyanobacteria in two previously untested drinking water sources.
2) Determine whether previous thresholds for an Alert Level framework are applicable at the two new field sites
Additional specific objectives related to the bank-filtration were the following: 1) to estimate the efficiency of bank filtration for removing phytoplankton and bacterial indicators, 2) to determine whether there was preferential removal of certain species of phytoplankton including cyanobacteria, and 3) provide recommendations on the use of phycocyanin probes for monitoring the fate of cyanobacteria in bank filtration (Table 3-1).
Table 3-1: Specific objectives and hypothesis of the research of this project
Objectives Hypotheses Experimental approach
Evaluate the accuracy of a phycocyanin probe for monitoring cyanobacteria
in two drinking water supplies
Correlations exist between taxonomic cell counts and
probe fluorescence are independent of source water
- ) Comparing the probe readings data on phycocyanin pigments in surface waters by comparing it to taxonomic
cell counts results conducted in laboratory
- ) microscopic cell counts including cyanobacteria density, cyanobacteria biovolume, phytoplankton density and
phytoplankton biovolume and microcystin concentration Using statistical software to calculate
the regression and p-value for all measured data in probe reading and lab
test results
Estimate the environmental conditions are suitable for blue-green algae and
can increase to excessive levels and form visible 'blooms' which can
adversely affect water quality. Environmental variables such as
turbidity, Temperature, pH, and chlorophyll fluorescence. Establish local alert level
thresholds using phycocyanin probe
measurements
Thresholds determined by McQuaid et al. (2011) are applicable to other source
waters
Based on the regression found between two methods, creating the new alert
level system as RFU equivalent to biovolume mm3/l.
Assess the efficiency of a bank filtration system for cyanobacteria and
microbial indicators
Travel time is the most important factor for bank
filtration efficiency
Tracing the accumulation of cyanobacteria in depth of lakes and
sediment samples by applying the phycocyanin probe in different water
levels in Lakes.
Comparing species composition in both lakes and well water.
CHAPTER 4
MATERIALS AND METHODS
4.1 Site locations
The first study site was a drinking water treatment plant located in the Western Basin of Lake Erie in Ontario, Canada. Opened in 1960, the plant takes water from Lake Erie via two intake pipes located 500 meters offshore and supplies potable water to approximately 56 000 residents in Southwestern Ontario (Figure 4-1).
All details with regards to materials and methods for the second study site are provided in Chapter 6.
4.2 Sampling methods
Table 4-1 provides the cyanobacteria monitoring protocol at the drinking water treatment plant. Based on this protocol, the conventional monitoring by grab sampling proceeded with online fluorescence monitoring by using an in situ phycocyanin probe (YSI 6600 V2-4 water-quality multi-probe (YSI, Yellow Springs, Ohio, USA)). The water grab samples were collected from the pumping station raw water from the water pipe prior to any treatment. Collected samples were conserved in an appropriate condition (Lahti et al., 2001). For taxonomic analyzes of
phytoplankton, as the densities of cyanobacterium exceeded 2 RFU as measured by the probe to phycocyanin (PC), water samples were taken for microscopic analysis while preserved using Lugol's iodine and were sent to University of Quebec in Montreal’s (UQAM) in Biological Sciences Department for species identification, biomass and biovolume calculations. The microcystin quantification was conducted with freezing the grab raw water samples at -25°C and samples were sent to the local accredited laboratory. All water samples were taken in parallel with PC probe readings.
Table 4-1: proposed cyanobacteria monitoring protocol in Lake Erie
Monitoring
Threshold (Following YSI
cyanobacteria probe readings)
Cell counts and speciation Cyanotoxin analysis
continuous Probe automatic reading: every 30 minutes - - Regular sampling probe reading ˂ 2 RFU
Sampling once a week from the raw water
Sampling once a week from the raw water.
Intensive sampling
2 RFU ˂ probe reading ˂ 5 RFU
Sampling 2 times per week from raw water, sludge of the
clarifier, surface of the clarification basin, filtered
water, and treated water
Sampling 2 times per week from raw water, sludge of the
clarifier, surface of the clarification basin, filtered
water, and treated water
Bloom event sampling
5 RFU ˂ probe reading
Daily sampling from raw water, sludge of the clarifier, surface of the clarification basin, filtered
water, and treated water
Daily sampling from raw water, sludge of the clarifier,
surface of the clarification basin, filtered water, and
treated water
4.3 YSI instrument, specification, calibration
The following physical parameters were measured using an in situ YSI multi-parameter probes model YSI 6600 V2-4 water-quality multi-probe (YSI, Yellow Springs, Ohio, USA) with the self-cleaning “wiped”: PC (cell/ml), PC RFU (Relative Fluorescence Unit)Chl-a (μg/l), chlorophyll a (RFU), temperature (°C), specific electrical conductivity (mS), turbidity (NTU), DO (mg/l), and pH (C. C. Davis, 1954). To quantify the fluorescence, the system detector is a photodiode of high sensitivity that is screened by an optical filter that restricts the detected light. The YSI probe excites
an orange light emitting diode (LED) at 590 nm for the excitation process. To quantify the fluorescence of the phycocyanin pigment in blue-green algae, a high sensitive system detector in probe screens the emitted light at 660 nm. For reading the chlorophyll a pigment, the same procedure is conducted with a different wavelength of 470 nm of excited light and the emission of pigment light at 680 nm. The probe has lower and upper detection limits of reading PC pigments under 0.1 RFU and over 100 RFU, respectively (McQuaid et al., 2011). The detected wavelength from the output of the sensor is expressed in either generic fluorescence units (RFU) or cell/mL of PC-containing blue-green algae. The turbidity, pH and conductivity were calibrated with the calibration liquids from the manufacturer and for the chlorophyll a, PC sensor and dissolved oxygen a de-ionized water was used as a one-point calibration.
CHAPTER 5
RESULTS AND DISCUSSION – LAKE ERIE
5.1 Environmental
variables
(temperature,
pH,
turbidity,
chlorophyll a)
During the study period from September 2012 to November 2014, the mean water temperature as measured by the probe was 20.9 °C (Appendix C). The pH varied from a mean low of 7.9 to a high of 9.0 In general, the pH was above 8.6. Previous studies of turbidity in Lake Erie have shown that wave action induced by winds and river discharges in the western end of the lake are predominant factors affecting turbidity (Van Oosten, 1948). Turbidity also plays a role in affecting conditions for the growth of phytoplankton. Higher turbidity can be advantageous to cyanobacteria species such as Microcystis as to prevent the damage of exposure to intense sunlight (Chaffin et al., 2011). During the study period, turbidity went as high as 81.4 NTU on November 14 2013. The high turbidity in November occurred during the period with the highest chlorophyll a concentrations (3 µg/L and 0.8 RFU) suggesting that phytoplankton cells were an important component of the turbidity. During the summer, the turbidity was generally low (mean 8.2 NTU) (Appendix C).
5.2 Temporal dynamics of phytoplankton
5.2.1 Phytoplankton distribution
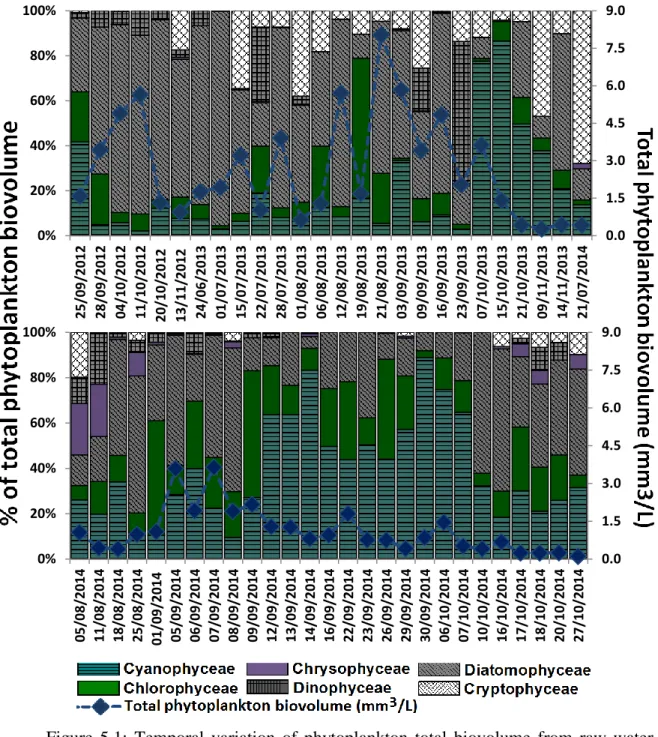
The results of phytoplankton monitoring conducted from August 2012 to October 2014 are discussed in this section with the general distribution of phytoplankton groups shown in Figures 5-1 and 5-2. As previously mentioned before, two major counting units are used to express the density of cyanobacteria: (1) biovolume (mm3L-1) and (2) abundance (cell mL-1), with Figures 1 and 5-2 demonstrating how different units can affect the interpretation of results. The wide range of phytoplankton biovolumes expressed in mm3 L-1 consists of 52.6 % diatoms as the dominant group and 22.3 % of cyanobacteria. On three days (25 September 2012, 7 and 15 October 2013), the RFU exceeded 1.0 and the presence of cyanobacteria was noted as dominant phytoplankton group with 41.7% (0.66 mm3L-1), 77.6% (2.8 mm3L-1) and 86.6 % (1.2 mm3L-1) of total phytoplankton biovolume, respectively.
Six types of phytoplankton were detected in raw water intake samples. Cyanophyceae were most abundant in terms of mean cell counts (45589 cell/mL) followed by green algae (2425 cell/mL), Diatomophyceae (1011 cell/mL), Chrysophyceae (436 cell/mL), Cryptophyceae (300 cell/mL), and Dinophyceae (20 cell/mL). Diatomophyceae were less numerous, making up approximately 2.0 % of all cell counts while cyanobacteria made up 92 % of all cell counts (Figure 5-2). The relative proportion of phytoplankton changed when considering units of biovolume, as diatoms comprised 52.4 % (mean 0.99 mm3L-1) of all phytoplankton while the cyanobacteria made up 22.2 % (0.4 mm3 L-1) of the total biovolume from intake samples (Figure 5-1).
Figure 5.1: Temporal variation of phytoplankton total biovolume from raw water intake grabs samples.
0.0 1.5 3.0 4.5 6.0 7.5 9.0 0% 20% 40% 60% 80% 100% 25/ 09 /2 012 28 /0 9/2012 04/ 10 /2 012 11/ 10 /2 012 20/10 /2 01 2 13/ 11 /2 012 24 /0 6/2013 01 /0 7/2013 15 /0 7/2013 22 /0 7/2013 28 /0 7/2013 01 /0 8/2013 06 /0 8/2013 12 /0 8/2013 19 /0 8/2013 21 /0 8/2013 03 /0 9/2013 09 /0 9/2013 16 /0 9/2013 23 /0 9/2013 07 /1 0/2013 15 /1 0/2013 21 /1 0/2013 09 /1 1/2013 14 /1 1/2013 21 /0 7/2014 0.0 1.5 3.0 4.5 6.0 7.5 9.0 0% 20% 40% 60% 80% 100% 05 /0 8/2014 11 /0 8/2014 18 /0 8/2014 25 /0 8/2014 01/ 09 /2 014 05 /0 9/2014 06 /0 9/20 14 07 /0 9/2014 08 /0 9/2014 09 /0 9/2014 12 /0 9/2014 13 /0 9/2014 14 /0 9/2014 16 /0 9/2014 22 /0 9/2014 23 /0 9/2014 26 /0 9/2014 29 /0 9/20 14 30 /0 9/2014 06 /1 0/2014 07 /1 0/2014 10 /1 0/2014 16 /1 0/2014 17 /1 0/2014 18 /1 0/2014 20 /1 0/2014 27 /1 0/2014
0 20000 40000 60000 80000 100000 120000 140000 0% 20% 40% 60% 80% 100% 25/ 09 /2 012 28 /0 9/2012 04/ 10 /2 012 11/ 10 /2 012 20/ 10 /2 012 13/ 11 /2 012 24 /0 6/2013 01 /0 7/2013 15 /0 7/2013 22 /0 7/2013 28 /0 7/2013 01 /0 8/2013 06 /0 8/2013 12 /0 8/2013 19 /0 8/2013 21 /0 8/2013 03 /0 9/2013 09 /0 9/2013 16 /0 9/2013 23 /0 9/2013 07 /1 0/2013 15 /1 0/2013 21 /1 0/2013 09 /1 1/2013 14 /1 1/2013 21 /0 7/2014 0 20000 40000 60000 80000 100000 120000 140000 0% 20% 40% 60% 80% 100% 05 /0 8/2014 11 /0 8/2014 18 /0 8/2014 25 /0 8/2014 01/ 09 /2 014 05 /0 9/2014 06 /0 9/2014 07 /0 9/2014 08 /0 9/2014 09 /0 9/2014 12 /0 9/2014 13 /0 9/2014 14 /0 9/2014 16 /0 9/2014 22 /0 9/2014 23 /0 9/2014 26 /0 9/2014 29 /0 9/2014 30 /0 9/20 14 06 /1 0/2014 07 /1 0/2014 10 /1 0/2014 16 /1 0/2014 17 /1 0/20 14 18 /1 0/2014 20 /1 0/2014 27 /1 0/2014
Figure 5.2: Temporal variation of phytoplankton abundance from raw water intake grabs samples.
5.2.2 Temporal distribution of cyanobacteria
Figures 5-3 and 5-4 show the temporal variation of cyanobacterial species in the raw water of the drinking water treatment plant in Western Lake Erie. Eighteen species of cyanobacteria were identified by taxonomic cell counts during the study period. Microcystis aeruginosa was the dominant species (mean 0.26 mm3L-1) in terms of biovolume, consisting of 58.7 % of the total biovolume of cyanobacteria species. Pseudanabaena mucicola was the next most important cyanobacterial species with regards to biovolume (5.8 %) (Figure 5-3). Cyanobacteria abundance presented different patterns according to the quantification unit in cells/mL - Aphanothece clathrata brevis was the dominant species 48.1 % in cell/mL (22051 cell/mL) (Figure 5-4). Potentially toxic cyanobacterial species were observed in almost 69 % of all raw water samples and frequently consisted of Microcystis aeruginosa in terms of biovolume (and 11 % in term of abundance).
The most abundant potentially toxic species observed in our study was Microcystis aeruginosa making up 58.7% of the total cyanobacteria biovolume (Figure 5-3). Table 5-1 summarizes the means of cyanobacteria cell volume from the taxonomic analyses of all grab samples from Lake Erie raw water. The mean of cell size volume shows the importance of biovolume rather than the number of cells in term of abundance (Kahlert & McKie, 2014; McQuaid et al., 2011). The cell volume of cyanobacteria species varied from 0.3 µm3 (Merismopedia minima) to 170.6 µm3 (Anabaena spiroides).
Figure 5.3: The distribution of cyanobacteria biovolumes from grab samples from the raw water intake on Lake Erie (2012 – 2014).
0.0 0.5 1.0 1.5 2.0 2.5 3.0 0% 20% 40% 60% 80% 100% 25/09 /2 01 2 28 /0 9/2012 04/ 10 /2 012 11/ 10 /2 012 20/ 10 /2 012 13/ 11 /2 012 24 /0 6/2013 01 /0 7/2013 15 /0 7/2013 22 /0 7/2013 28 /0 7/2013 01 /0 8/2013 06 /0 8/2013 12 /0 8/2013 19 /0 8/2013 21 /0 8/2013 03 /0 9/2013 09 /0 9/2013 16 /0 9/2013 23 /0 9/2013 07 /1 0/2013 15 /1 0/2013 21 /1 0/2013 09 /1 1/2013 14 /1 1/20 13 21 /0 7/2014 0.0 0.5 1.0 1.5 2.0 2.5 3.0 0% 20% 40% 60% 80% 100% 05 /0 8/2014 11 /0 8/2014 18 /0 8/2014 25 /0 8/2014 01/ 09 /2 014 05 /0 9/2014 06 /0 9/2014 07 /0 9/2014 08 /0 9/2014 09 /0 9/2014 12 /0 9/2014 13 /0 9/2014 14 /0 9/2014 16 /0 9/2014 22 /0 9/2014 23 /0 9/2014 26 /0 9/2014 29 /0 9/2014 30 /0 9/2014 06 /1 0/2014 07 /1 0/2014 10 /1 0/2014 16 /1 0/2014 17 /1 0/2014 18 /1 0/2014 20 /1 0/2014 27 /1 0/2014