VIII International Conference on Computational Plasticity COMPLAS VIII E. Oñate and D. R. J. Owen (Eds) © CIMNE, Barcelona, 2005
SS
AXES ROTATION DURING SIMPLE SHEAR TEST: MEASUREMENT
AND PREDICTIONS
T.Lelotte*, A.F.Gerday*, P.FloresP
*
P
, L.DuchêneP
∇
P
, S.Bouvier†, P.Van HoutteP à
P
and A.M.Habraken*
*
Department of Mechanics of materials and Structures University of Liege, Chemin des Chevreuils 1, 4000 Liège, Belgium e-mail: thomas.lelotte, afgerday, Paulo.Flores, [email protected],
web page: http://www.ulg.ac.be/matstruc
P
∇
P
COBO Dept., Royal Military Academy, av. de la Renaissance 30, 1000 Brussels, Belgium
P
†
P
LPMTM-CNRS, University of Paris13, 99, av.J.B.Clément 93430 Villetaneuse, France email: [email protected]
P
à
P
Department of Metallurgy and Materials Engineering
Katholieke Universiteit Leuven, de Croylaan 2, B-3001 Leuven, Belgium email: [email protected] - web page: http://www.mtm.kuleuven.be
Key words: Simple shear test, axes rotation, finite element models
Summary. For a simple shear test, the finite element (FE) local frame, that stays orthogonal,
does not follow the anisotropic material frame. To study this effect, FE simulations have been compared with experimental results (optical and texture measurements) and it was shown that it is necessary to take into account the effect of texture updating for local axes rotation.
1 INTRODUCTION
An orthotropic material frame is easily identified in cold rolled metal sheets by the rolling direction (RD), the transverse direction (TD) and the normal direction (ND) of the sheet. In finite element (FE) simulations describing large plastic strains, three frames coexist: the global one where the mesh is defined, the local one that remains orthogonal and the anisotropic material frame that follow the material deformation. For a simple shear test, the local frame does not follow the anisotropic material frame since this last one is subjected to distortion while the local frame remains orthogonal. To study the effect of this model error, FE simulations results of simple shear tests are compared with experimental observations (optical and texture measurements). Predicted or measured local axes and texture rotations are compared as well as their effect on the anisotropic yield locus.
2 EXPERIMENTAL RESULTS
The simple shear test, depicted in Fig.1 with its global frame, was performed on a steel specimen FeP06t of 0.7 mm thick. The bi-axial test machine developed in ULgP
1
P
was coupled with optical measurements of Aramis® system which provided the strain field UεU.
T.Lelotte, A.F.Gerday, P.Flores, L.Duchêne, S.Bouvier, P.Van Houtte and A.M.Habraken
2
A strain γ =d b/ =0.7 theoretically corresponds to ϕ =artg( )γ = °35 . Experimentally, the optical system has measured in a small element at the center of the sample, a rotation
37.22
ϕ= ° for this required displacement confirming some small inaccuracy in experiment (machine stiffness, slip in the grips).
Figure 1: Simple shear test, strain γ = d / b and definition of global (X), local (x) and material (x’) axes
The geometric conditions to reach a homogeneous strain field are respectedP
2
P
, as confirmed both by optical (Fig. 2) and computed final strain field.
Figure 2: Strain field measured by Aramis for a shear strain γ = 0.7 mm
The texture has been measured before and after the simple shear test as well as the force deformation curve during the test.
3 SIMULATIONS
FE simulations with either 1 FE or 707 FE mesh were performed. The motion of axes studied in the central element of the mesh or in the unique FE was compared with experimental results (table 1).
The different frames are presented in Fig.1. Global axes XY are the reference ones for the texture measurements. The local axes xy should move with the material but as they remain orthogonal, they differ from the material axes x’y’ evolution. The FE code Lagamine developed at the M&S department uses an integration scheme based on the constant symmetric velocity gradient that proposes an original computation of rotation axesP
3
P
. Three laws have been applied: Hill, MintyP
4
P
and EvolP
4
P
. These three laws assume a rotation of the orthotropic material anisotropy defined by the local frame.
The material parameters describing the Hill 1948 yield criterion are deduced from anisotropic coefficients (Lankford coefficients) measured at RD and TD of the metal sheet together with the shear yield stress at RD. These data were obtained from TBH yield locus estimated from texture. This choice allows to fit both tensile and shear levels of stresses with the Hill yield locus but prevent to recover Lankford coefficient at 45° from RD. A Swift type isotropic hardening law describes the evolution of the yield locus size. The material
T.Lelotte, A.F.Gerday, P.Flores, L.Duchêne, S.Bouvier, P.Van Houtte and A.M.Habraken
3
parameters were optimized by minimizing the error between the experimental force – displacement curve, from the studied simple shear test, and its FE simulation taking into account all the components of the stress tensor.
MintyP
4
P
law locally interpolates the yield locus between five points computed by Taylor model from initial texture. According to the direction of the current stress state, the orientation of the five reference stress directions is adjusted.
Finally, EvolP
4
P
is a version of Minty law based on an updated texture computed each time 3% of plastic strain has occurred.
4 RESULTS AND DISCUSSION
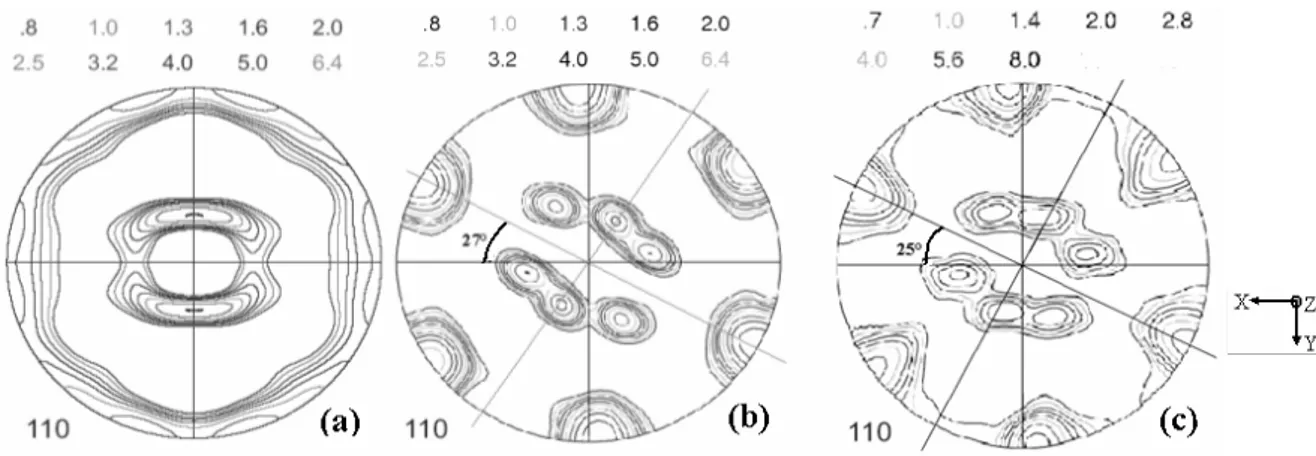
Texture rotation (Fig. 3) is measured on (110)-pole figures, in global axes, for the final state, from the measured texture and from the texture computed by FE method (707 FE + Evol). These two methods give almost identical results.
Figure 3: (110)-pole figures in the (a) initial configuration (measured), in the final configuration: measured (b) and computed (c) by Evol, and rotation angle α
The results of all the rotations of the different axes are given in table 1.
1 FE 707 FE Experimental
Hill Minty Evol Hill Minty Evol
Local axes rotation (ϕB1B) 20.0533 20.0533 20.0533 20.3414 20.353 20.224 - Rotation from displacement
field (ϕ)
34.992 34.992 34.992 35.1925 35.243 35.045 Aramis: 37.22
Mean rotation of texture (α) - - - 25 27
Table 1 : Angles (in degree) of the rotation of material axis y’ (ϕ), local axis y (ϕB1B) and rotation of the
(110)-pole figures (α )
In fact, the rotations ϕB1B of 1 FE simulations recover the rigid body rotation associated
with the applied shear. Note that the local axis (y) is situated from Y almost at the half of the material axis y’. It averages the required rotation to follow the material and to remain orthogonal. The texture rotation α is also reduced compared to the material axes.
T.Lelotte, A.F.Gerday, P.Flores, L.Duchêne, S.Bouvier, P.Van Houtte and A.M.Habraken
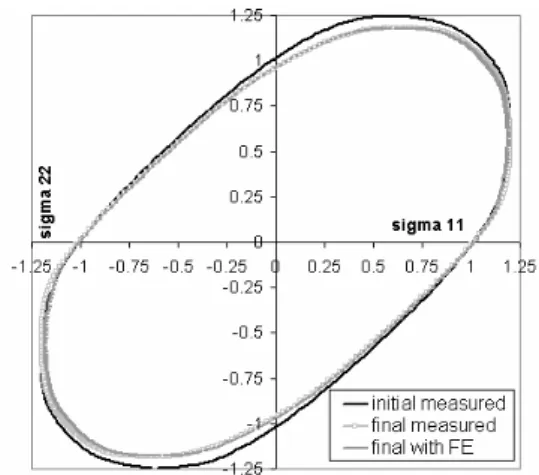
locus obtained by FE with Evol is close to the measured one. The Lankford coefficients (table 2) agree with this result. As in Peeters5, the interest of texture updating in case of large shear deformation is demonstrated. FE simulations relying on the initial yield loci roughly rotated by rigid body spin predict Lankford coefficients far from the ones related to texture measurements. While Evol results taking into account local axes rotation and the yield locus derived from the updated texture is close to these values.
r0 r45 r90
Initial texture Measured 2.22 2.03 2.47
Hill 2.22 2.36 2.47
Minty 2.22 2.03 2.47
Final texture Measured 3.06 2.19 1.67
Hill 2.25 2.43 2.45
Minty 2.22 2.25 2.26
Evol 3.01 2.21 1.65
Table 2: Lankford coefficient in the initial configuration and after the simple shear test
Figure 4: adimensional yield loci: initial and final (measured and obtained by FE) 4 CONCLUSION
This study helps to describe the inaccuracy of FE simulations simply based on the rotation of initial material anisotropy. For large shear state, it confirms the need to take into account the effect of texture updating and local axes rotation.
AKNOWLEDGEMENT: The authors would like to acknowledge the Belgian Science Policy for
financial support through Contract P5/08. A. M. Habraken is mandated by the National Fund for Scientific Research (Belgium).
REFERENCES
[1] P.Flores, E.Rondia, A.M.Habraken, “Development of an experimental equipment for the identification of constitutive laws”, International Journal of Forming Processes, to be published.
[2] S.Bouvier, H.Haddadi, P.Levée, C.Teodosiu, “Simple Shear Tests: Experimental Techniques and Characterization of the Plastic Anisotropy of Rolled Sheets at Large Strains”, J. Mater. Process. Technol., to be published.
[3] S.Munhoven, A.M.Habraken, A.Van Bael, J.Winters, “Anisotropic finite element analysis based on texture”. In: Lee, L.K., Kinzel, G.L., Wagoner, R.H., (Eds.). NUMISHEET'96. The Ohio State University, Columbus edition, pp. 112-119 (1996).
[4] A.M.Habraken, L.Duchêne, “Anisotropic elasto-plastic finite element analysis using a stress strain interpolation method based on a polycrystalline model”, Int. J. of Plast.,Vol 20, 8-9, pp. 1525-1560 (2004).
[5] B.Peeters, E.Hoferlin, P.Van Houtte, E.Aernoudt, “Assessment of crystal plasticity based calculation of the lattice spin of polycrystalline metals for FE implementation”, Int. J. Of Plast., 17, pp. 819-836 (2001).