The auditory P300-based single-switch BCI:
Paradigm transition from healthy subjects to minimally conscious patients
C. Pokornya, D.S. Klobassaa, G. Pichlerb, H. Erlbeckc, R.G.L. Realc, A. K¨ublerc, D. Lesenfantsd, D. Habbald, Q. Noirhommed,
M. Risettie, D. Mattiae, G.R. M¨uller-Putza,∗
aGraz University of Technology, Institute for Knowledge Discovery, 8010 Graz, Austria bAlbert Schweitzer Klinik, 8020 Graz, Austria
cUniversity of W¨urzburg, 97070 W¨urzburg, Germany dUniversity of Li`ege, Coma Science Group, 4000 Li`ege, Belgium
eFondazione Santa Lucia, IRCCS, 00179 Rome, Italy
Abstract
Objective: Within this work an auditory P300 brain-computer interface (BCI) based on tone stream segregation, which allows for binary decisions, was developed and evaluated.
Materials and methods: Two tone streams consisting of short beep tones with infrequently appearing deviant tones at random positions were used as stimuli. This paradigm was evaluated in 10 healthy subjects and applied to 12 patients in a minimally conscious state (MCS) at clinics in Graz, W¨urzburg, Rome, and Li`ege. A stepwise linear discriminant analysis (SWLDA) classifier with 10× 10 cross-validation was used to detect the presence of any P300 and to investigate attentional modulation of the P300 amplitude.
Results: The results for healthy subjects were promising and most classification results were better than random. However, for MCS patients only a small number of classification results were above chance level and none of the results were sufficient for communication purposes. Nevertheless, signs of consciousness were detected in most patients, not on a single-trial basis, but after averaging of corresponding data segments and computing significant differences. These significant results, however, strongly varied across sessions and conditions.
Conclusion: This work shows the transition of a paradigm from healthy subjects to MCS patients. Promising results with healthy subjects are, however, no guarantee of good results with patients. Therefore, more investigations are required before any definite conclusions about the usability of this paradigm for MCS patients can be drawn. Nevertheless, this paradigm might offer an opportunity to support bedside clinical assessment of MCS patients and eventually, to provide them with a means of communication. Keywords: Auditory P300, Tone stream segregation, Brain-computer interface (BCI), Minimally conscious state (MCS)
1. Introduction
Traditional means of assistive technologies (AT), such as joy-stick or button-based systems rely on residual muscular out-put from the user. In contrast, a brain-computer interface (BCI) is a technology that utilizes neurophysiological signals directly from the brain to control external devices, bypassing the natural muscular output [1]. Currently, BCI systems based on electroencephalography (EEG) can provide severely motor-disabled people with a new output channel to voluntarily trol applications for communication and environmental con-trol [2, 3, 4, 5, 6, 7, 8].
In addition, different neuroimaging and electrophysiological techniques have revealed signs of intact cortical processing and awareness in unresponsive patients diagnosed with vegetative state (VS) and minimally conscious state (MCS) [9, 10]. MCS is a disorder of consciousness (DOC) that is clinically
identi-∗Corresponding author
Email address: [email protected] (G.R. M¨uller-Putz)
fied on the basis of behavioral assessment that shows the pres-ence of non-reflexive responses to visual and auditory stimula-tion [11, 12]. Severe motor impairment might, however, prevent the disclosure of awareness even during a careful repeated ex-amination, leading to a rate of misdiagnosis of approximately 40 % [10]. To overcome this problem, EEG-based BCI sys-tems might offer a unique opportunity in supporting the bedside clinical assessment of unresponsive patients and eventually, in providing them with a means of communication. When consid-ering BCI-based communication for unresponsive patients, the main goals of development should be to implement simple and robust devices. Both requirements can be fulfilled by using a single-switch BCI (ssBCI) which reliably detects one specific brain pattern of the patient [13, 14]. Consequently, any kind of assistive technology (AT) can be controlled by simple binary yes/no commands provided by the ssBCI [15].
When designing an ssBCI for unresponsive patients, the spe-cific needs and capabilities of the target patient group need to be taken into account. One promising way to realize a BCI in un-responsive patients is to use an auditory paradigm [16, 17, 18].
While vision might be considerably impaired, the auditory sys-tem is usually preserved in unresponsive patients [19, 20, 21] or might even be the only remaining channel usable for BCI-based communication [22]. One brain signal often used to real-ize a BCI is the P300 component of the event-related potential (ERP). The P300 component is a positive deflection in the EEG that can be elicited by a so-called oddball paradigm and occurs about 300 ms after a rare stimulus event in a stream of standard stimuli [23, 24, 25, 26]. Previous studies have shown the ap-plicability of auditory P300-based paradigms, allowing a user to make a binary decision by focusing attention on one of two concurrent tone streams [27, 28, 29]. Hill et al. [27, 28] pre-sented the tone streams separately to the left and the right ear. In contrast, Kanoh et al. [29] showed that focusing attention on one of the tone streams is even possible when both streams are presented to the right ear only. These studies showed promising results, but only in healthy subjects.
Based on these considerations, the aim of our current work was to develop an auditory P300 paradigm similar to [29] which just allows for binary decisions and which does not rely on bin-aural hearing. Such a paradigm is considered to be simpler than other P300 paradigms (e.g., auditory matrix speller [4]) since only two classes (i.e., two tone streams) exist. It is, there-fore, assumed to be suitable for unresponsive patients. This paradigm was evaluated in healthy subjects and then applied to MCS patients. Our work, therefore, shows the transition of a paradigm from healthy subjects to MCS patients. Our main question was, whether a paradigm that is promising in healthy subjects can also successfully be applied to MCS pa-tients. Some preliminary results of this work have already been presented in [30].
2. Materials and methods 2.1. Auditory stimulation
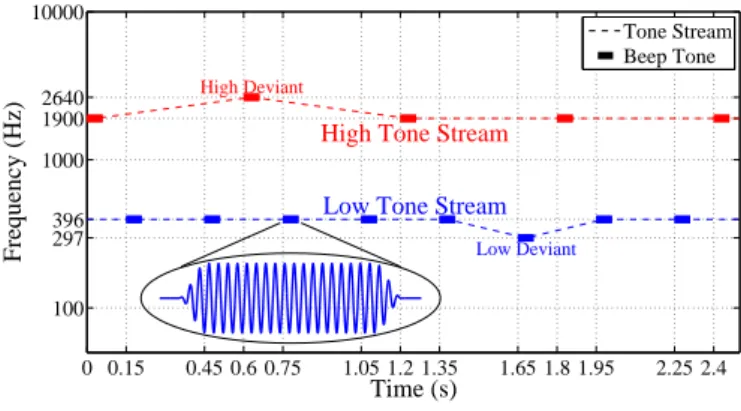
In order to create an oddball paradigm similar to [29], two tone streams with infrequently appearing deviant tones at ran-dom positions were used as stimuli. Both tone streams were composed of short beep tones with a length of 60 ms and a rise and fall time of 7.5 ms each. The beep tones were arranged according to the tone stream pattern LHL LHL ... (’L’ = low tone, ’H’= high tone, ’ ’ = silent gap). In this way, the low tone stream (LTS) was twice as fast as the high tone stream (HTS). This was an attempt to make the streams more distinguishable. Based on our own experience when listening to the tone streams we considered the tone streams to be better distinguishable if the tones would not only differ in frequency (low/high) but also in the presentation rate (fast/slow). In the LTS, the inter-stimulus interval (ISI) was 300 ms and the standard low tones had a frequency of 396 Hz, whereas the low deviants had a fre-quency of 297 Hz. In the HTS, the ISI was 600 ms and the stan-dard high tones had a frequency of 1900 Hz, whereas the high deviants had a frequency of 2640 Hz. Both tone streams were intermixed with an offset of 150 ms. In Figure 1, a schematic representation of the tone streams can be seen.
Since the frequency separation between both tone streams was large enough and the presentation rate was sufficiently
0 0.15 0.45 0.6 0.75 1.05 1.2 1.35 1.65 1.8 1.95 2.25 2.4 100 297 396 1000 1900 2640 10000 High Deviant Low Deviant High Tone Stream
Low Tone Stream
Time (s)
Frequency (Hz)
Tone Stream Beep Tone
Figure 1: Schematic representation of the two intermixed tone streams used as stimuli. Both the high and the low tone stream (dashed lines) consisted of short beep tones (short bars) with randomly placed deviants. In the high tone stream, every other tone is omitted corresponding to silent gaps in the tone stream pattern. The waveform of one standard low tone is also shown in magnified view.
high, the beep tones could be perceived as two segregated tone streams [31]. Therefore, it was possible to intentionally shift attention from one stream to the other and thus to modulate the P300 response elicited by the deviant tones in the attended tone stream [27, 28, 29, 32]. The modulated P300 amplitude could then be used to infer which tone stream the participants paid attention to. Both tone streams were presented binaurally us-ing in-ear headphones, makus-ing the paradigm usable for patients with only monaural hearing capabilities.
The percentage of deviant tones was 20 % in the HTS (slow) and 10 % in the LTS (fast) respectively, resulting in the same ab-solute number of deviants in both streams. The deviants were randomly distributed with some restrictions. In the LTS, be-tween 5 and 13 standard low tones (uniform distribution; 9 tones on average) always appeared between two deviants. In the HTS, between 2 and 6 standard high tones (uniform dis-tribution; 4 tones on average) always appeared between two deviants. Additionally, across streams, high and low deviants could not appear consecutively.
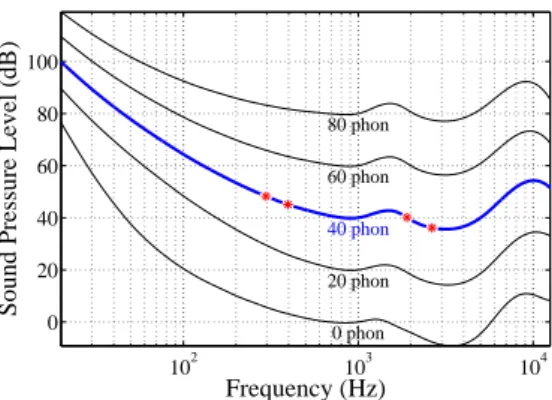
A regular computer with Matlab/Simulink together with a custom-made C++ function to ensure high-speed and low-delay audio output was used to play the beep tones. The beep tones were generated with a sampling rate of 44100 Hz. To ensure that all four types of beep tones (low/high standard tones, low/high deviant tones) were perceived equally loud, the loudness of the tones was adjusted according to the nor-mal equal-loudness-level contours defined in the ISO standard ISO 226:2003 [33] (see Figure 2). In this way, bias effects to-ward one of the streams were reduced.
2.2. Participants
This multi-centered study was conducted in two parts, one part with healthy subjects and another with MCS patients which was conducted approximately one year later. In the first part, 10 healthy subjects (3 female, 7 male) aged between 24 and 33 years (mean age 27.6± 3.0 (SD) years) participated in this study. They were informed in detail about the aims of the study, gave informed consent and were paid for participation. One
102 103 104 0 20 40 60 80 100 0 phon 20 phon 40 phon 60 phon 80 phon Frequency (Hz)
Sound Pressure Level (dB)
Figure 2: Normal equal-loudness-level contours defined in ISO 226:2003 [33]. The loudness of the beep tones at the four frequencies 297 Hz, 396 Hz, 1900 Hz, and 2640 Hz (asterisks) was corrected along the 40-phon curve (bold line) in order to be perceived equally loud.
participant reported a slight tinnitus in both ears, but had no problems hearing the beep tones or perceiving the two tone streams separately. All other participants did not report any hearing problems. All EEG measurements with healthy sub-jects were conducted at Graz University of Technology.
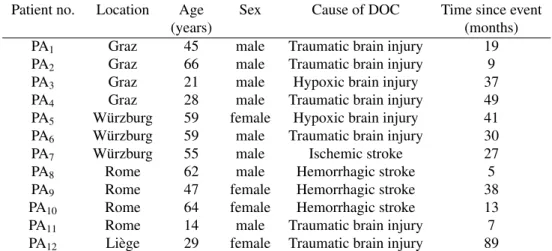
The second part of this study was conducted with 12 MCS patients (4 female, 8 male) aged between 14 and 66 years (mean age 45.8± 18.2 (SD) years) at four different locations. EEG measurements were conducted in Graz (Albert Schweitzer Clinic), W¨urzburg (Intensive Care Hospital Schwaig), Rome (Fondazione Santa Lucia) and Li`ege (CHU University Hospi-tal). All patients were selected by the medical stuff in the re-spective clinics. Patients diagnosed with MCS between 14 and 80 years who were not in intensive care and in an overall sta-ble medical condition were included. Exclusion criteria were gravidity, infections, and participation in other studies. Table 1 provides background and disease related data of all patients. In-formed consent was obtained from the patients’ legal represen-tatives. The patients participated in a different number of ses-sions. The idea was that each patient, if possible, would partici-pate in two session on different days to compensate for possible fluctuations in responsiveness. For patients who participated in more than one session, the follow-up sessions were carried out between 1 to 12 weeks later. The patients were behaviorally assessed using the Coma Recovery Scale-Revised (CRS-r) [11] within 24 hours before or after each EEG measurement in order to keep track of their fluctuations in responsiveness.
This study was approved by the local Ethics Committees at all participating institutions and was conducted in accordance with the Declaration of Helsinki.
2.3. EEG recording
The EEG was recorded with a sampling rate of 512 Hz using active electrodes. A band-pass filter between 0.5 Hz and 100 Hz and a notch filter at 50 Hz were activated. The ground electrode was connected to the right mastoid, the reference electrode was attached to the left earlobe.
In healthy participants, the EEG was recorded at 15 positions (F3, Fz, F4, T7, C5, Cz, C6, T8, TP7, CP5, CP6, TP8, P3, Pz,
Figure 3: Electrode setup according to the international 10-20 system. In healthy participants, the EEG was recorded at the 15 shaded electrode positions. In MCS patients, the EEG was recorded at 9 postions marked with dashed cir-cles. The left earlobe was used as reference (Ref), the right mastoid as ground (Gnd).
and P4; see Figure 3) according to the international 10-20 sys-tem. Positions covering the auditory cortices were included. All EEG measurements were conducted in a shielded room where the subjects were sitting in a comfortable armchair, with a com-puter screen placed in front of them.
With the patients, a reduced channel set was used to facil-itate measurements in a clinical environment. The EEG was recorded at 9 positions only (F3, Fz, F4, C3, Cz, C4, P3, Pz and P4; see Figure 3). Given the rather high effort of mounting elec-trodes, due to some patients unintentionally moving their head or lying in bed with the electrode cap constantly touching the pillow, a reduced channel set was considered to be acceptable. All measurements were conducted in a silent room in a clinical environment. The patients were either lying in bed with the up-per part of their body slightly elevated or sitting in a wheelchair, with a screen placed in front of them.
2.4. Experimental paradigms 2.4.1. Healthy subjects
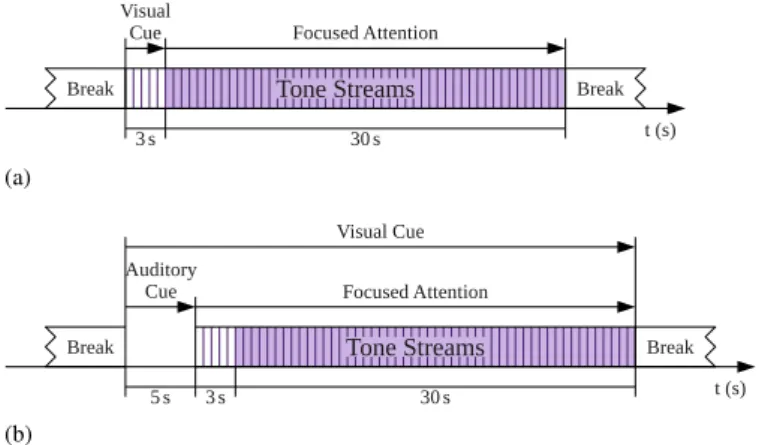
The paradigm for healthy participants consisted of cue-based trials with a length of 33 s (see Figure 4(a)). During the first 3 s of a trial, a visual cue randomly indicated which stream to focus attention on. This is referred to as the target stream. The other stream is referred to as the non-target stream. The cue was shown on the screen which was placed in front of the subjects. During this instruction period, the tone streams were presented (5 high beep tones, 10 low beep tones), but without any deviant tones. This is expected to make it easier to focus attention on the target stream. After 3 s, the cue disappeared
Patient no. Location Age Sex Cause of DOC Time since event
(years) (months)
PA1 Graz 45 male Traumatic brain injury 19
PA2 Graz 66 male Traumatic brain injury 9
PA3 Graz 21 male Hypoxic brain injury 37
PA4 Graz 28 male Traumatic brain injury 49
PA5 W¨urzburg 59 female Hypoxic brain injury 41
PA6 W¨urzburg 59 male Traumatic brain injury 30
PA7 W¨urzburg 55 male Ischemic stroke 27
PA8 Rome 62 male Hemorrhagic stroke 5
PA9 Rome 47 female Hemorrhagic stroke 38
PA10 Rome 64 female Hemorrhagic stroke 13
PA11 Rome 14 male Traumatic brain injury 7
PA12 Li`ege 29 female Traumatic brain injury 89
Table 1: Characteristics of all MCS patients who participated in this study.
and a fixation cross was displayed in the middle of the screen. During the next 30 s, 50 high beep tones and 100 low beep tones were presented, containing 10 deviant tones randomly distributed in each stream. The subjects were instructed to keep their attention focused on the target stream and ignore the non-target stream. Moreover, they were instructed to silently count and intentionally recognize any occurrence of a deviant tone in the stream they were focusing on. After 33 s, a random break between 8 s and 12 s was inserted before the next trial started. The whole experiment consisted of 8 runs with 10 trials each and lasted around one hour (without breaks). The lengths of the breaks between runs were determined by the participant. In total, 80 trials were recorded, 40 trials for each stream as tar-get. Within 40 trials, 4000 standard and 400 deviant tones in the LTS and 1800 standard and 400 deviant tones in the HTS were presented.
2.4.2. MCS patients
With MCS patients, each session started with a simple ver-sion of the paradigm where either the LTS or the HTS only was presented. Then, the complex paradigm with both tone streams was presented to the patients. The simple paradigm was added to find out whether the presence of a P300 in the simple paradigm is related to the presence of a P300 in the complex paradigm. Furthermore, the patients should have more time to get accustomed to the experimental conditions. Due to the lim-ited concentration time of the patients, only one of the streams was selected (randomized across patients) to be presented in the simple paradigm. If an equal number of trials had been recorded for each of the streams, the measurement time for the simple paradigm would have doubled. Since the main goal of our work was to develop a communication paradigm for binary decisions, it was considered to be more important to record as many trials as possible using the complex paradigm. Only in the follow-up sessions of two (random) patients, was an attempt made to use each of the streams in the simple paradigm. In the simple paradigm, the patients were instructed to listen to the presented tone stream and to silently count the occurrences of deviant tones. This instruction was provided to facilitate
focus-ing attention in the followfocus-ing complex paradigm. In total, 4 runs with 5 trials each were recorded with random breaks between all trials (between 8 s and 12 s). Between the runs, breaks were longer according to the patients’ needs. Information about the patients’ needs was obtained by visual assessment of their con-dition (e.g., possibly asleep, not focused, moving a lot). In the complex paradigm, random cues seemed to be too demanding for the patients. Therefore, blocks of 5 consecutive trials with the same target stream were recorded. The first target stream was always the same as used in the simple paradigm. At least two blocks, one with the LTS and one with the HTS as target, were recorded. When the patients’ condition allowed it, a sec-ond turn with one block for each target was recorded. In the complex paradigm, individual breaks were taken after each sin-gle trial according to the patients’ needs.
For MCS patients, the course of the paradigm was also slightly modified (see Figure 4(b)). One trial had a length of 38 s, and during the additional 5 s at the beginning, an auditory cue (presented via headphones like the tone streams) indicated which stream to focus attention on. Additionally, patients were also instructed by the experimenter prior to each trial. This was possible because the cues were known in advance because of the block-based design instead of random cues. The same in-formation was also shown as a visual cue which was presented during the whole trial instead of the fixation cross. The visual cue was presented on the screen which was placed in front of the patients’ head. After 5 s, the tone streams were presented for 33 s like in the paradigm for healthy participants. Again, during the first 3 s, the streams did not contain any deviants. In addition, to make it easier for the patients to identify the target stream and focus attention on it, asynchronous stream onsets were used. This means that during this first 3 s, only the target stream was presented.
2.5. Data analysis
Data recordings from healthy subjects and patients were analysed exactly in the same way except for one difference. The EEG recordings from some patients contained a large amount of artifacts due to uncontrolled movements of their head, eyes, and
(a)
(b)
Figure 4: Experimental paradigms. (a) Paradigm used with healthy participants. At the beginning of each trial, a visual cue instructing the subject to focus at-tention on one of the streams was shown on a screen. At the same time, the tone streams (vertical hatching) were presented, but without any deviant tones. After 3 s, deviant tones were randomly inserted (shaded area). (b) Paradigm used with MCS patients. Before the tone streams began, an auditory cue was presented. The visual cue was shown on the screen during the whole trial.
extremities. Therefore, EOG (electrooculogram), EMG (elec-tromyogram), and technical artifacts (presumably due to cable movements and the head lying on some electrodes) were man-ually selected and data segments containing such artifacts were excluded from any further analyses. In the recordings from healthy subjects, artifact removal was considered to be not nec-essary.
All data were filtered with a 3rd-order Butterworth low-pass filter at 10 Hz and downsampled to a sampling rate of 64 Hz. Then, data segements from 0 to 1200 ms relative to the beep tone onsets were extracted. Only the EEG channels Fz, Cz and Pz were selected. These were included in both channel sets. For classification, a stepwise linear discriminant analysis (SWLDA) classifier was used with the enter criterion penter = 0.1, the
removal criterion premove = 0.15 and the number of iterations
niterations = 10, together with 10 × 10 cross-validation. The
SWLDA classifier only used time points between 200 ms and 800 ms after beep tone onset as features. No baseline correc-tion was performed since no suitable baseline interval could be defined because of the presence of overlapping auditory evoked potentials due to the high presentation rate of the beep tones. Each of the classification results was compared with the real level of chance [34] to identify random results.
For healthy subjects, in addition to the single-trial classifi-cation, a second classification approach was pursued. The idea was to use averaging to improve the signal-to-noise ratio (SNR) and thus to increase the classification accuracies. Therefore, 10 successive segments belonging to the same type of beep tone were averaged and used for classification, thereby reducing the effective number of segments by a factor of 10. This was possi-ble since the total number of beep tones within the 80 recorded trials was sufficiently high. For patients, classification of aver-aged data segments could not be applied because of the small number of recorded trials.
The P300 classification was carried out under the follow-ing conditions: (i) The deviant tones were classified against
the standard tones in the only tone stream used in the simple paradigm. This was only done for patients to investigate if a P300 was present. To account for the very different numbers of deviant and standard segments, random subsampling with 100 iteration was applied. (ii) The deviant tones were classified against the standard tones separately for each target stream used in the complex paradigm. This was done for healthy subjects as well as for patients to investigate if a P300 was present in either of the streams. Again, random subsampling was applied. (iii) The target deviant tones were classified against the non-target deviant tones separately for each stream used in the complex paradigm. Again, this was done for healthy subjects as well as for patients to investigate the attentional modulation of the P300 amplitude. Using this information it should be possible to infer which stream was attended. Usually, under this condition, the number of target and non-target segments should be equal (10 deviants in each stream per trial). If, however, due to artifacts, the number of segments differed by more than 25 %, random subsampling was also applied.
Statistical analysis comprised a Shapiro-Wilk test for testing normal distribution of the data and a multivariate analysis of variance (MANOVA) for evaluating differences in classification accuracy of P300 and attention results between tone streams (LTS versus HTS) and between analyzing methods (with aver-aging versus without averaver-aging). All relevant data were nor-mally distributed and Bonferroni correction was used to adjust p-values for multiple comparisons. Pearson’s product moment correlation was used for evaluating possible relations between CRS-r scores and classification accuracies.
For visual inspection of the data, all data segments of each participant were averaged according to stimulus type and con-dition. These averaged segments were then tested for signifi-cant differences. To this end, confidence intervals with signifi-cance levelα = 5 % were estimated using bootstrapping based on n= 1000 bootstrap samples. Similar to [35, 36], only non-overlapping intervals with lengths L≥ 60 ms were regarded as significant differences whereas intervals with lengths L ≥ 30 ms were regarded as weakly significant differences.
3. Results
3.1. Healthy subjects
Table 2 summarizes the SWLDA classification results of all 10 healthy subjects. The values in this table represent the mean classification accuracies over all cross-validation folds. The re-sults are shown for two different conditions. The columns la-beled with ’P300’ contain the results when classifying the de-viant tones against the standard tones. The columns labeled with ’Attention’ contain the results when classifying target de-viant tones against non-target dede-viant tones. All results are pre-sented separately for the LTS and the HTS as target stream. Moreover, the results with and without averaging of 10 succes-sive segments can be seen. The single results of all subjects as well as the mean and standard deviation across all subjects are shown. All results better than random [34] are designated with asterisks.
Figure 5: Attentional modulation effect of the P300 amplitude for the healthy
subject HS02at the channels Fz, Cz, and Pz. The averaged data segments of the
non-target low deviant tones (blue curve; marker type:•) versus the target low
deviant tones (green curve; marker type:+) can be seen. Significant differences
were computed using bootstrapping (α = 5 %; red shaded areas). The standard error (SE) is plotted along with the curves (lightly shaded areas).
Most of the results are clearly better than random. More-over, for all subjects and conditions, the classification accura-cies could always be improved by averaging. However, after averaging, not all results were better than random because of the increased level of chance due to 10 times fewer effective data segments. The mean classification accuracies ranged be-tween 59.0 % and 64.5 % without averaging and bebe-tween 69 % and 83.5 % with averaging. In 8 of the 10 subjects, focused at-tention on at least one of the tone streams could be detected on a single-trial basis (i.e., without averaging of segments).
To evaluate any possible bias toward one of the two tone streams, classification accuracies were compared using MANOVA and revealed a significant difference in the P300 re-sults. Subjects reached higher accuracies in the LTS than in the HTS (p= 0.011). No differences between LTS and HTS were found in the attention results. To evaluate the hypothesis that data averaging improves classification accuracies, a compari-son between data with averaging and without averaging was conducted and revealed significant differences both in the P300 results (p< 0.001) and in the attention results (p = 0.001).
By way of example, Figure 5 shows the attentional modula-tion effect of the P300 amplitude for one healthy subject HS02.
The averaged data segments belonging to the target low de-viant tones (i.e., when focusing attention on the LTS) versus the non-target low deviant tones (i.e., when focusing attention on the HTS) can be seen. Significant differences (estimated using bootstrapping withα = 5 %) could be found at all three channels Fz, Cz, and Pz. A significant enhancement of the P300 ampli-tude due to attention can be seen around 350 ms after stimulus onset. The standard error (SE) is plotted along with the curves. 3.2. MCS patients
Table 3 summarizes the SWLDA classification results of all 12 MCS patients. Again, the values in this table represent the mean classification accuracies over all cross-validation folds
and are shown separately for the LTS and HTS as target. The results are also divided into the conditions labeled with ’P300’ and ’Attention’ in the complex paradigm as well as the condi-tion ’P300’ in the simple paradigm where only one tone stream at a time was presented. Information about sessions and CRS-r scores is also provided. Five patients participated in one ses-sion only, six patients in two sesses-sions and one patient in three sessions. The number of sessions was not equal for all patients since the patients’ conditions did not always allow successful EEG measurements. Due to the high logistic effort to carry out measurements in different clinics some sessions, unfortunately, could not always be repeated. The single results of all patients as well as the mean and standard deviation across all patients and sessions are shown. All results better than random [34] are designated with asterisks.
Table 3 shows that only a small number of results, mainly in the simple paradigm, were above chance. The mean classi-fication accuracies were below chance level for all conditions. In 4 of the 12 patients, the presence of a P300 in the simple paradigm could be detected on a single-trial basis. Only in PA09, a P300 in the complex paradigm could be classified above
chance level. Not enough trials were recorded to use averaging to improve the SNR. Attentional modulation could not be de-tected in any of the patients on a single-trial basis.
To assess any possible relations between CRS-r scores and classification accuracies, Pearson’s product moment correlation was computed but revealed no significant results. However, significant positive correlations were found between classifica-tion accuracies in the simple and complex paradigm in the HTS (r= 0.56, p = 0.032), indicating that the presence of a P300 in the simple paradigm is related to the presence of a P300 in the complex paradigm. Classification accuracies in one tone stream were also found to be correlated with the accuracies in the other tone stream in the complex paradigm (r= 0.56, p = 0.012). Due to the study protocol, only a few patients performed the simple paradigm with each of the tone streams. Nevertheless, a clear trend towards a significant correlation between both streams was present (r= 0.99, p = 0.053). In addition, a highly pos-itive correlation between accuracies in the P300 results and the attention results was found in the HTS (r= 0.58, p = 0.010), but not in the LTS.
Although single-trial classification accuracies for patients were mainly below chance level, significant effects could be found after averaging of all data segments belonging to one stimulus type and condition. In Table 4, significant differences (estimated using bootstrapping with α = 5 %) that could be found at any of the channels Fz, Cz, or Pz between 200 ms and 900 ms after stimulus onset are presented. Only signifi-cant differences with lengths L ≥ 60 ms and weakly significant differences with L ≥ 30 ms are listed. ’P’ denotes a significant positive difference whereas ’N’ denotes a significant negative difference. The approximate latency (in ms) is defined as the period between stimulus onset and the mean time of the signifi-cant interval. Signifisignifi-cant differences are reported separately for all patients and conditions.
Most patients showed significant differences between stan-dard and deviant tones in the simple or complex paradigm in
Classification accuracies (%)
P300 Attention
w/o averaging w/ averaging w/o averaging w/ averaging
Subject no. LTS HTS LTS HTS LTS HTS LTS HTS HS01 57.3∗∗ 61.2∗∗ 74.0∗∗ 72.4∗∗ 55.2∗ 57.8∗∗ 59.0 68.5∗ HS02 70.7∗∗ 61.8∗∗ 84.7∗∗ 81.3∗∗ 62.6∗∗ 62.8∗∗ 78.0∗∗ 81.4∗∗ HS03 77.2∗∗ 72.0∗∗ 97.7∗∗ 94.9∗∗ 69.5∗∗ 70.4∗∗ 90.6∗∗ 90.2∗∗ HS04 62.2∗∗ 57.2∗∗ 81.0∗∗ 71.3∗∗ 56.9∗∗ 53.5 64.2 62.5 HS05 63.9∗∗ 60.7∗∗ 82.5∗∗ 74.4∗∗ 63.5∗∗ 61.0∗∗ 76.9∗∗ 75.6∗∗ HS06 71.5∗∗ 64.4∗∗ 93.8∗∗ 82.4∗∗ 65.5∗∗ 65.5∗∗ 83.0∗∗ 83.0∗∗ HS07 61.9∗∗ 54.4 87.4∗∗ 66.4∗ 53.3 55.6∗ 58.2 59.6 HS08 67.2∗∗ 59.7∗∗ 92.0∗∗ 74.2∗∗ 58.9∗∗ 60.2∗∗ 65.1∗ 80.8∗∗ HS09 56.8∗∗ 55.4∗ 68.6∗ 62.8 52.8 52.1 61.1 59.5 HS10 56.0∗ 52.6 73.4∗∗ 56.5 51.4 50.6 54.0 57.6 Mean 64.5∗∗ 59.9∗∗ 83.5∗∗ 73.7∗∗ 59.0∗∗ 59.0∗∗ 69.0∗ 71.9∗∗ SD 7.1 5.6 9.5 10.8 6.1 6.3 12.2 11.8
∗Better than random (α = 5 %). ∗∗Better than random (α = 1 %).
Table 2: SWLDA classification accuracies (with 10× 10 cross-validation) for all healthy subjects together with the mean and standard deviation (SD). P300: To
detect the P300, the deviant tones were classified against the standard tones. Attention: To investigate the attentional modulation, the target deviants were classified against the non-target deviants. The results are shown with (w/) and without (w/o) averaging (10 segments), separately for the LTS and HTS as target. All results better than random [34] are designated with asterisks.
Classification accuracies (%)
Simple paradigm Complex paradigm
P300 P300 Attention
Patient no. Session CRS-r LTS HTS LTS HTS LTS HTS
PA01 1 18 49.4 − 47.3 49.1 44.5 53.4 2 18 − 57.2 54.9 47.1 58.2 52.6 PA02 1 14 − 52.1 48.7 51.1 51.5 44.4 2 15 49.7 − 49.2 49.6 43.5 52.5 PA03 1 13 − 52.4 49.7 50.2 42.8 52.7 2 12 51.4 − 54.2 49.5 49.4 47.4 PA04 1 8 55.7 − 50.6 52.2 52.5 55.4 2 8 − 50.0 50.1 51.2 52.7 48.6 PA05 1 9 − 60.1∗ 52.9 56.7 49.4 58.6 2 6 57.9 60.6∗ 49.4 50.2 48.3 49.7 PA06 1 7 − 49.7 51.4 47.4 53.7 45.1 2 6 50.2 48.8 − − − − 3 7 49.5 46.4 50.5 50.0 54.3 56.3 PA07 1 21 − 49.6 53.4 47.2 58.1 45.9 PA08 1 20 − 48.0 49.4 50.2 45.8 48.4 PA09 1 18 − 59.6∗ 64.8∗ 63.0 47.0 60.1 PA10 1 18 − 58.3∗ 57.7 51.5 65.5 51.1 2 19 − 53.4 50.6 54.8 50.5 48.1 PA11 1 20 − 59.1∗ 51.6 56.5 47.5 51.2 PA12 1 4 − 50.1 49.2 50.1 49.3 49.8 Mean 52.0 53.5 51.9 51.5 50.8 51.1 SD 3.4 4.9 4.0 3.9 5.6 4.4
∗Better than random (α = 5 %).
Table 3: SWLDA classification accuracies (with 10× 10 cross-validation) for all MCS patients together with the mean and standard deviation (SD). Information
about sessions and CRS-r scores is also listed. P300: To detect the P300, the deviant tones were classified against the standard tones. Attention: To investigate the attentional modulation, the target deviants were classified against the non-target deviants. The results of the simple and complex paradigm are shown separately for
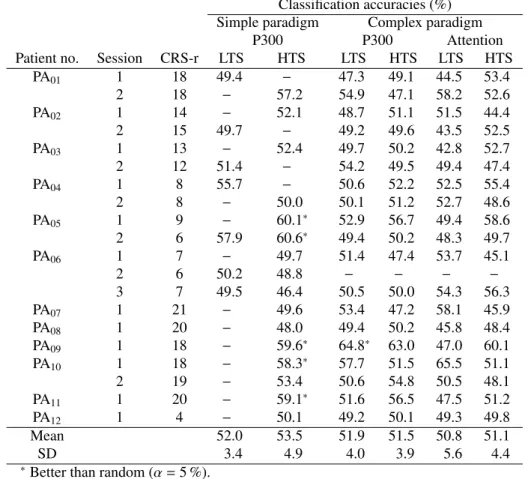
Figure 6: Presence of a P300 in the complex paradigm for patient PA10at the
channels Fz, Cz and Pz. The averaged data segments of the low standard tones
(blue curve; marker type:•) versus the low deviant tones (green curve; marker
type:+) can be seen with the LTS as target stream. Significant differences were
computed using bootstrapping (α = 5 %; red shaded areas). The standard error (SE) is plotted along with the curves (lightly shaded areas).
one of the sessions. Only a few patients also showed significant differences due to attention in one of the target tone streams. The significant results strongly varied across sessions and con-ditions.
By way of example, Figure 6 shows the presence of a P300 in the complex paradigm for patient PA10. The averaged data
seg-ments of the low standard tones versus the low deviant tones can be seen when the LTS was the target stream. A (weakly) significant P300 can be seen around 430 ms after stimulus on-set. The standard error (SE) is plotted along with the curves.
4. Discussion
Within this work, an auditory P300 paradigm which al-lows for binary decisions was developed. As a first step, this paradigm was evaluated in 10 healthy subjects and finally, ap-plied to 12 MCS patients at clinics in Graz, W¨urzburg, Rome, and Li`ege. The initial evaluation in healthy subjects showed promising results. Most of the classification results were clearly better than random. In 8 of the 10 subjects, focused atten-tion on at least one of the tone streams could be detected on a single-trial basis. Statistical analyses revealed that both tone streams can be assumed to be equally salient, since, on aver-age, no significant differences between the tone streams were found in the attention results. By averaging 10 data segments, the SNR could be increased and the classification accuracies could, thus, be improved, reaching mean accuracies between 69 % and 83.5 %. Therefore, in principle, the applicability of this paradigm in healthy subjects could be shown.
Our classification results were similar to the cross-validated classification accuracies reported in [29] but not as high as re-ported in other related studies which relied on dichotic listening tasks [27, 28]. However, these studies are not directly compa-rable since different classification methods were used and some
parameters of the tone streams (including ISI, beep tone fre-quencies, percentage of deviants, etc.) were different. There-fore, the impact of these parameters on the classification ac-curacy remains to be investigated in future studies. Moreover, some healthy subjects also reported difficulties focusing atten-tion on the tone streams. It is possible the perceptual load in-volved in processing the auditory stimuli was not sufficiently high to remain focused on the target and to ignore the distract-ing non-target tone stream [37]. Furthermore, most subjects also reported that this paradigm was somehow monotonous and boring which might also have prevented them from remain-ing focused. Therefore, in future paradigms, more interestremain-ing sounds or even syllables or words could be used as stimuli.
Another possibility to facilitate focusing attention would be to present each tone stream exclusively to one ear, as in [27, 28]. In this case, monaural hearing capabilities would no longer be sufficient to operate this paradigm. This, however, was a pre-condition when designing our paradigm. Since MCS or VS pa-tients have different kinds of brain lesions, as few assumptions as possible about the patients’ capabilities were made. Accord-ing to a positron emission tomography (PET) study [38] com-paring auditory processing in severely brain injured patients, activations in bilateral auditory cortices and associative areas similar to healthy controls were observed in MCS patients. Moreover, functional connectivity between auditory cortex and a larger network of temporal and prefrontal cortices was found in MCS patients. Such a high-order processing or functional integration could not be observed in persistent vegetative state (PVS) patients. In our study, at least some patients showed, on average, significant differences due to attention which also sug-gests that they must have preserved some degree of high-order processing and functional connectivity. Therefore, a binaural approach could be an alternative to improve the paradigm for some of the MCS patients. However, especially in VS patients, binaural hearing capabilities can no longer be assumed due to the lack of functional connectivity in the brain [19, 38].
As a second step, the paradigm was modified according to the patients needs and capabilities and applied to MCS patients. Auditory cues were added rendering this paradigm applicable purely auditorily without relying on intact vision. Moreover, a block-based trial sequence instead of random cues was used. Asynchronous stream onsets were implemented to make it eas-ier for the patients to identify the target stream. As a result, slightly different versions of the paradigm were applied to both groups of participants. However, the key parameters such as the composition of the tone streams remained the same, al-lowing us to compare results from both groups. Since some healthy subjects reported difficulties focusing attention they could also have benefited from the modified version of the paradigm. However, unlike patients, healthy subjects were ex-pected to understand the instructions and to be able to switch the target stream on a trial-by-trial basis. Therefore, asynchronous stream onsets and a block-based design were considered to be necessary only for patients.
Despite these modifications, only a few classification results of MCS patients were above chance level. Unfortunately, none of the results were sufficient for communication purposes.
Usu-Significant differences
Simple paradigm Complex paradigm
P300 P300 Attention
Patient no. Session LTS HTS LTS HTS LTS HTS
PA01 1 n.s. − n.s. n.s. n.s. n.s. 2 − P230, P520 P390 n.s. P300 n.s. PA02 1 − P770 n.s. n.s. P680 n.s. 2 n.s. − n.s. n.s. n.s. n.s. PA03 1 − P800 n.s. n.s. n.s. n.s. 2 P740 − N210, P810 n.s. n.s. n.s. PA04 1 P440, P690 − n.s. n.s. n.s. N730 2 − n.s. N760 N800 n.s. n.s. PA05 1 n.s. N250, P370 N360 n.s. n.s. n.s. 2 P460 n.s. n.s. n.s. n.s. n.s. PA06 1 − n.s. n.s. n.s. n.s. n.s. 2 n.s. n.s. − − − − 3 n.s. n.s. N800 n.s. n.s. n.s. PA07 1 − n.s. n.s. n.s. n.s. n.s. PA08 1 − n.s. n.s. n.s. n.s. n.s. PA09 1 − N240, P390, P880 N260, N530, P870 N550, P760 n.s. n.s. PA10 1 − P490, N650 P420 n.s. n.s. n.s. 2 − P530 P430 n.s. n.s. n.s. PA11 1 − N360, N590, N850 N300 P810 n.s. n.s. PA12 1 − n.s. n.s. n.s. n.s. n.s.
Table 4: Significant differences estimated using bootstrapping with α = 5 % for all patients and conditions. Only significant differences with lengths L ≥ 60 ms
(bold values) and weakly significant differences with L ≥ 30 ms that could be found at any of the channels Fz, Cz, or Pz between 200 ms and 900 ms after stimulus
onset are reported. ’P’ denotes a significant positive difference whereas ’N’ denotes a significant negative difference. The approximate latencies between stimulus
onset and the mean time of the significant interval are given in ms. ’n.s.’ means that no significant differences could be found. Omitted values (−) indicate that no
ally, classification accuracies above 70 % are considered as the performance level necessary for communication [39]. This could not be reached by any of the patients. Most healthy sub-jects did not reach this performance level on a single-trial basis either, but most of them, unlike patients, still performed clearly better than random. Possible reasons for low classification ac-curacies in patients could be that they were not able to under-stand or correctly follow the instructions, or the paradigm was simply too demanding for them.
Nevertheless, cue-directed attentional behavior could not be detected on a single-trial basis but after averaging all data seg-ments. In most patients, significant differences between stan-dard and deviant tones in the simple or complex paradigm could be found. Similarly to results described in [35, 36], only signif-icant differences exceeding a certain length were actually re-ported. In future analyses, more sophisticated statistical meth-ods (such as for example an approach described in [40]) might be required to identify significant differences more reliably. It is not yet clear if these significant differences were really P300 potentials since, sometimes, the polarity was inversed and their occurrence was very much delayed. However, Perrin et al. [20] and Schnakers et al. [41] also reported P300 potentials with latencies between 600 ms and 800 ms in MCS patients. They concluded that MCS patients might have a slower processing speed than healthy subjects, an assumption that is also in line with Kotchoubey et al. [9]. There might have been some over-lapping effects due to the short ISI the beep tones were pre-sented with. This might also explain why the P300 occured at later time points, an effect that could also be observed in some healthy subjects. Furthermore, the inversed polarity could indi-cate a (possibly delayed) mismatch negativity (MMN) instead of a P300 potential. Significant MMN effects could be found in most healthy subjects around 200 ms after stimulus onset fol-lowed by the P300 potential, and were also reported by Kanoh et al. [29].
Only 3 patients showed significant differences due to atten-tion in one of the target tone streams. However, these findings indicate that these patients must have understood and adhered to the instructions. Therefore, this paradigm might offer an op-portunity to support bedside clinical assessment of unrespon-sive patients and eventually, to provide them with a means of communication and control. Since time is not a crucial factor for unresponsive patients, communication could be established by simply averaging many trials and detecting significant dif-ferences due to attention. It may be acceptable to patients if the time needed to select a symbol or make a decision (e.g., yes or no) is in the order of minutes. In principle, detecting focused attention on one of the streams is sufficient to realize an ssBCI and thus, to control any kind of AT software or device that can be controlled by simple binary yes/no commands [15]. There-fore, since single-trial classification was not successful in pa-tients but significant effects were found on average only, future modifications of the paradigm should aim at signal processing and classification methods involving averaging of many data segments. Also, our statictical results confirmed that averaging of data segments significantly improved classification accuracy and point out the importance of constructing paradigms in such
a way that enough trials and data segments are available for av-eraging. In our current study, in contrast to healthy subjects, not enough trials could be recorded due to the short attention span of the patients and therefore, no averaging could be applied be-fore classification.
In future studies, the impact of short ISIs on the brain re-sponse should be investigated in detail to address the problem of overlapping auditory evoked potentials. Moreover, paradigms in which stimuli may be easier to distinguish or elicit a stronger ERP response (as for example faces in the visual domain [42]) have to be developed. Another improvement could be to in-clude EOG electrodes in the channel setup to facilitate ar-tifact reduction. Furthermore, the inclusion of all recorded channels instead of only three pre-selected channels, together with automated channel selection algorithms, might also yield better classification results. The use of non-linear classifiers such as support vector machines (SVMs) that are superior to SWLDA [43] might also be beneficial. However, due to the low number of trials, there is a high risk of overfitting the data when using a non-linear classifier. In another comparison of classifiers for P300 [44], it was, therefore, suggested that lin-ear classifiers are sufficient for P300 data and that the added complexity of non-linear methods is not necessary. Within this comparison, SWLDA was found to perform best in practice.
5. Conclusion
Within this work, an auditory P300 paradigm based on tone stream segregation was evaluated in healthy subjects and then, applied to 12 MCS patients in clinical environments in four dif-ferent countries. Modifications of the paradigm were neces-sary to take into account the specific needs and capabilities of these patients. This work, therefore, shows the transition of a paradigm from healthy subjects to MCS patients. Clearly, such a paradigm transition from healthy subjects in the lab to pa-tients in clinical environment involves some compromises. The resulting paradigms are, therefore, not fully comparable. More-over, promising results with healthy subjects are no guarantee of good results with patients. More investigations are still re-quired before any definite conclusions about the usability of this paradigm for MCS patients can be drawn. Nevertheless, this paradigm might offer an opportunity to support bedside clinical assessment of unresponsive patients and eventually, to provide them with a means of communication.
6. Acknowledgments
The authors would like to thank Christian Breitwieser for im-plementing and testing the high speed C++ audio library that was used for auditory stimuli presentation. Also, special thanks to Ian Daly for proofreading.
This work is supported by the European ICT Programme Project FP7-247919. The text reflects solely the views of its authors. The European Commission is not liable for any use that may be made of the information contained therein.
References
[1] J. R. Wolpaw, N. Birbaumer, D. J. McFarland, G. Pfurtscheller, T. M. Vaughan, Brain-computer interfaces for communication and control, Clinical Neurophysiology 113 (2002) 767–791.
[2] N. Birbaumer, N. Ghanayim, T. Hinterberger, I. Iversen, B. Kotchoubey, A. K¨ubler, J. Perelmouter, E. Taub, H. Flor, A spelling device for the paralysed, Nature 398 (1999) 297–298.
[3] C. Neuper, G. R. M¨uller, A. K¨ubler, N. Birbaumer, G. Pfurtscheller, Clin-ical application of an EEG-based brain-computer interface: a case study in a patient with severe motor impairment, Clinical Neurophysiology 114 (2003) 399–409.
[4] A. K¨ubler, A. Furdea, S. Halder, E. M. Hammer, F. Nijboer, B. Kotchoubey, A brain-computer interface controlled auditory event-related potential (P300) spelling system for locked-in patients, Annals of the New York Acadamy of Sciences 1157 (2009) 90–100.
[5] B. Rebsamen, C. Guan, H. Zhang, C. Wang, C. Teo, M. H. Ang, E. Bur-det, A brain controlled wheelchair to navigate in familiar environments, IEEE Transactions on Neural Systems and Rehabilitation Engineering 18 (2010) 590–598.
[6] F. Gal´an, M. Nuttin, E. Lew, P. W. Ferrez, G. Vanacker, J. Philips, J. del R. Mill´an, A brain-actuated wheelchair: asynchronous and non-invasive brain-computer interfaces for continuous control of robots, Clinical Neu-rophysiology 119 (2008) 2159–2169.
[7] G. R. M¨uller-Putz, R. Scherer, G. Pfurtscheller, R. Rupp, EEG-based neu-roprosthesis control: a step towards clinical practice, Neuroscience Let-ters 382 (2005) 169–174.
[8] I. Daly, M. Billinger, J. Laparra-Hern´andex, F. Aloise, M. L. Garc`ıa, G. R. M¨uller-Putz, R. Scherer, Brain-computer interfaces as a potential as-sistive tool for cerebral palsy patients, Clinical Neurophysiology (2013) (in review).
[9] B. Kotchoubey, S. Lang, G. Mezger, D. Schmalohr, M. Schneck, A. Semmler, V. Bostanov, N. Birbaumer, Information processing in se-vere disorders of consciousness: vegetative state and minimally conscious state, Clinical Neurophysiology 116 (2005) 2441–2453.
[10] M. Monti, A. Vanhaudenhuyse, M. Coleman, M. Boly, J. Pickard, L. Tshibanda, A. Owen, S. Laureys, Willful modulation of brain activ-ity in disorders of consciousness, The New England Journal of Medicine 362 (2010) 579–589.
[11] J. T. Giacino, K. Kalmar, J. Whyte, The JFK coma recovery scale-revised: measurement characteristics and diagnostic utility, Archives of Physical Medicine and Rehabilitation 85 (2004) 2020–2029.
[12] J. T. Giacino, C. Schnakers, D. Rodriguez-Moreno, K. Kalmar, N. Schiff,
J. Hirsch, Behavioral assessment in patients with disorders of
conscious-ness: gold standard or fool’s gold?, in: N. D. Schiff, S. Laureys, A. M.
Owen (Eds.), Coma Science: Clinical and Ethical Implications, Vol. 177 of Progress in Brain Research, Elsevier, 2009, pp. 33–48.
[13] C. Pokorny, C. Breitwieser, C. Neuper, G. R. M¨uller-Putz, Towards a single-switch BCI based on steady-state somatosensory evoked poten-tials, in: Proceedings of the 5th International BCI Confonference (Verlag der Technischen Universit¨at Graz), 2011, pp. 200–203.
[14] G. R. M¨uller-Putz, C. Pokorny, D. S. Klobassa, P. Horki, A single switch BCI based on passive and imagined movements: towards restoring com-munication in minimally conscious patients, International Journal of Neu-ral Systems 23 (2013) 1250037.
[15] C. Zickler, A. Riccio, F. Leotta, S. Hillian-Tress, S. Halder, E. Holz, P. Staiger-S¨alzer, E. Hoogerwerf, L. Desideri, D. Mattia, A. K¨ubler, A brain-computer interface as input channel for a standard assistive tech-nology software, Clinical EEG and Neuroscience 42 (2011) 236–244. [16] C. Chatelle, S. Chennu, Q. Noirhomme, D. Cruse, A. Owen, S. Laureys,
Brain-computer interfacing in disorders of consciousness, Brain Injury 26 (2012) 1510–1522.
[17] D. Lul´e, Q. Noirhomme, S. Kleih, C. Chatelle, S. Halder, A. Demertzi, M. Bruno, O. Gosseries, A. Vanhaudenhuyse, C. Schnakers, M. Thon-nard, A. Soddu, A. K¨ubler, S. Laureys, Probing command following in patients with disorders of consciousness using a brain-computer interface, Clinical Neurophysiology 124 (2013) 101–106.
[18] E. Sellers, New horizons in brain-computer interface research, Clinical Neurophysiology 124 (2013) 2–4.
[19] S. Laureys, M.-E. Faymonville, C. Degueldre, G. Del Fiore, P. Damas, B. Lambermont, N. Janssens, J. Aerts, G. Franck, A. Luxen, G. Moonen,
M. Lamy, P. Maquet, Auditory processing in the vegetative state, Brain 123 (2000) 1589–1601.
[20] F. Perrin, C. Schnakers, M. Schabus, et al., Brain response to one’s own name in vegetative state, minimally conscious state, and locked-in syn-drome, Archives of Neurology 63 (2006) 562–569.
[21] H. B. Di, S. M. Yu, X. C. Weng, S. Laureys, D. Yu, J. Q. Li, P. M. Qin, Y. H. Zhu, S. Z. Zhang, Y. Z. Chen, Cerebral response to patient’s own name in the vegetative and minimally conscious states, Neurology 68 (2007) 895–899.
[22] A. R. Murguialday, J. Hill, M. Bensch, S. Martens, S. Halder, F. Nijboer, B. Schoelkopf, N. Birbaumer, A. Gharabaghi, Transition from the locked in to the completely locked-in state: a physiological analysis, Clinical Neurophysiology 122 (2011) 925–933.
[23] L. A. Farwell, E. Donchin, Talking off the top of your head: toward a
men-tal prosthesis utilizing event-related brain potentials, Electroencephalog-raphy and Clinical Neurophysiology 70 (1988) 510–523.
[24] A. Furdea, S. Halder, D. J. Krusienski, D. Bross, F. Nijboer, N. Bir-baumer, A. K¨ubler, An auditory oddball (P300) spelling system for brain-computer interfaces, Psychophysiology 46 (2009) 1–9.
[25] D. S. Klobassa, T. M. Vaughan, P. Brunner, N. E. Schwartz, J. R. Wolpaw, C. Neuper, E. W. Sellers, Toward a high-throughput auditory P300-based brain-computer interface, Clinical Neurophysiology 120 (2009) 1252– 1261.
[26] S. Halder, M. Rea, R. Andreoni, F. Nijboer, E. M. Hammer, S. C. Kleih, N. Birbaumer, A. K¨ubler, An auditory oddball brain-computer interface for binary choices, Clinical Neurophysiology 121 (2010) 516–523. [27] N. J. Hill, T. N. Lal, K. Bierig, N. Birbaumer, B. Sch¨olkopf, An auditory
paradigm for brain-computer interfaces, Advances in Neural Information Processing Systems 17 (2005) 569–576.
[28] N. J. Hill, B. Sch¨olkopf, An online brain-computer interface based on shifting attention to concurrent streams of auditory stimuli, Journal of Neural Engineering 9 (2012) 026011.
[29] S. Kanoh, K. Miyamoto, T. Yoshinobu, A brain-computer interface (BCI) system based on auditory stream segregation, Journal of Biomechanical Science and Engineering 5 (2010) 32–40.
[30] G. R. M¨uller-Putz, D. S. Klobassa, C. Pokorny, G. Pichler, H. Erlbeck, R. G. L. Real, A. K¨ubler, M. Risetti, D. Mattia, The auditory P300-based ssBCI: A door to minimally conscious patients?, in: Proceedings of the 34th Annual International Conference of the IEEE EMBS (Aug. 28–Sept. 1, San Diego), 2012, pp. 4672–4675.
[31] A. Bidet-Caulet, O. Bertrand, Neurophysiological mechanisms involved in auditory perceptual organization, Frontiers in Neuroscience 3 (2009) 182–191.
[32] S. A. Hillyard, R. F. Hink, V. L. Schwent, T. W. Picton, Electrical signs of selective attention in the human brain, Science 182 (1973) 177–180. [33] Acoustics – Normal equal-loudness-level contours (ISO 226:2003),
Inter-national Organization for Standardization, Geneva, Switzerland, 2003. URL http://www.iso.org/
[34] G. R. M¨uller-Putz, R. Scherer, C. Brunner, R. Leeb, G. Pfurtscheller, Bet-ter than random? A closer look on BCI results, InBet-ternational Journal of Bioelectromagnetism 10 (2008) 52–55.
[35] C. Fischer, F. Dailler, D. Morlet, Novelty P3 elicited by the subject’s own name in comatose patients, Clinical Neurophysiology 119 (2008) 2224– 2230.
[36] C. Fischer, J. Luaute, D. Morlet, Event-related potentials (MMN and nov-elty P3) in permanent vegetative or minimally conscious states, Clinical Neurophysiology 121 (2010) 1032–1042.
[37] N. Lavie, Distracted and confused?: Selective attention under load, Trends in Cognitive Sciences 9 (2005) 75–82.
[38] M. Boly, M. Faymonville, P. Peigneux, B. Lambermont, P. Damas, G. Del Fiore, C. Degueldre, G. Franck, A. Luxen, M. Lamy, G. Moonen, P. Ma-quet, S. Laureys, Auditory processing in severely brain injured patients:
Differences between the minimally conscious state and the persistent
veg-etative state, Archives of Neurology 61 (2004) 233–238.
[39] A. K¨ubler, N. Neumann, B. Wilhelm, T. Hinterberger, N. Birbaumer, Pre-dictability of brain-computer communication, Journal of Psychophysiol-ogy 18 (2004) 121–129.
[40] E. Maris, R. Oostenveld, Nonparametric statistical testing of EEG- and MEG-data, Journal of Neuroscience Methods 164 (2007) 177–190. [41] C. Schnakers, F. Perrin, M. Schabus, S. Majerus, D. Ledoux, P. Damas,
Voluntary brain processing in disorders of consciousness, Neurology 71 (2008) 1614–1620.
[42] T. Kaufmann, S. Schulz, C. Gr¨unzinger, A. K¨ubler, Flashing characters with famous faces improves ERP-based brain computer interface perfor-mance, Journal of Neural Engeneering 5 (2011) 056016.
[43] N. V. Manyakov, N. Chumerin, A. Combaz, M. M. Van Hulle, Com-parison of classification methods for P300 brain-computer interface on disabled subjects, Computational Intelligence and Neuroscience (2011) 519868.
[44] D. J. Krusienski, E. W. Sellers, F. Cabestaing, S. Bayoudh, D. J. Mc-Farland, T. M. Vaughan, J. R. Wolpaw, A comparison of classification techniques for the P300 speller, Journal of Neural Engineering 3 (2006) 299–305.


![[PDF] Documentation pour apprendre l'analyse technique forex | Cours Finance](data:image/gif;base64,R0lGODlhAQABAIAAAP///wAAACH5BAEAAAAALAAAAAABAAEAAAICRAEAOw==)