HAL Id: hal-00298281
https://hal.archives-ouvertes.fr/hal-00298281
Submitted on 8 Mar 2006
HAL is a multi-disciplinary open access
archive for the deposit and dissemination of
sci-entific research documents, whether they are
pub-lished or not. The documents may come from
teaching and research institutions in France or
abroad, or from public or private research centers.
L’archive ouverte pluridisciplinaire HAL, est
destinée au dépôt et à la diffusion de documents
scientifiques de niveau recherche, publiés ou non,
émanant des établissements d’enseignement et de
recherche français ou étrangers, des laboratoires
publics ou privés.
Detecting changes in Labrador Sea Water through a
water mass analysis of BATS data
A. Henry-Edwards, M. Tomczak
To cite this version:
A. Henry-Edwards, M. Tomczak. Detecting changes in Labrador Sea Water through a water mass
analysis of BATS data. Ocean Science, European Geosciences Union, 2006, 2 (1), pp.19-25.
�hal-00298281�
Ocean Sci., 2, 19–25, 2006 www.ocean-sci.net/2/19/2006/
© Author(s) 2006. This work is licensed under a Creative Commons License.
Ocean Science
Detecting changes in Labrador Sea Water through a water mass
analysis of BATS data
A. Henry-Edwards and M. Tomczak
School of Chemistry Physics and Earth Sciences, Flinders University of South Australia, GPO Box 2100, Adelaide SA 5001, Australia
Received: 24 June 2005 – Published in Ocean Sci. Discuss.: 30 August 2005
Revised: 28 November 2005 – Accepted: 28 February 2006 – Published: 8 March 2006
Abstract. A new water mass analysis technique is used to analyse the BATS oceanographic data set in the Sargasso Sea of 1988–1998 for changes in Labrador Sea Water (LSW) properties. The technique is based on a sequential quadratic programming method and requires careful definition of con-straints to produce reliable results. Variations in LSW tem-perature and salinity observed in the Labrador Sea are used to define the constraints. It is shown that to minimize the resid-uals while matching the observed temperature and salinity changes in the source region the nitrate concentration in the Labrador Sea has to be allowed to vary as well. It is con-cluded that during the period of investigation nitrate under-went significant variations in the Labrador Sea.
1 Introduction
The Bermuda Atlantic Time-series Study (BATS), a project of the Bermuda Biological Station for Research (BBSR) and the Centre for Integrated Ocean Observations (CINTOO), has been producing high quality hydrographic data on a monthly basis since 1954 and now represents one of the best long-term oceanographic time series available. The study was primarily set up to investigate the biogeochemistry of the Sargasso Sea and its relation to climate variations (Stein-berg et al., 2001). Consequently, much of the research done into the BATS data set concentrated on the upper few hun-dred metres (e.g. Anderson and Pondaven, 2003; Babiker et al., 2004; DuRand et al., 2001; Hood et al., 2001).
Work at the BATS site has contributed greatly to our un-derstanding of nutrient processes in the upper levels of the ocean (Steinberg et al., 2001). In particular, our understand-ing of nutrient behaviour under different atmospheric con-ditions has been greatly improved. Hood et al. (2001)
sug-Correspondence to: M. Tomczak
gested that interannual fluctuations in N2 fixation might be
linked to climate fluctuations over the North Atlantic, in par-ticular to the North Atlantic Oscillation. Babiker et al. (2004) suggested a link with the direction of the prevailing winds over the Sargasso Sea.
There has been some work performed on the BATS data set looking at the deeper water properties and the hydrographic history. Joyce and Robbins (1996) suggested that a cooling in the deep layers of the BATS data might be linked to earlier cooling in the Labrador Sea. Curry and McCartney (1996) also suggested this scenario and gave a transit time of ap-proximately six years.
In this paper we concentrate on the depth range 900– 1300 m and investigate the question whether it is possible to link variations in hydrographic properties observed at the BATS location to variations of hydrographic properties in water mass formation regions at significant distance from the observation site in a quantitative manner. We use a new wa-ter mass analysis technique, called Time Resolving Optimum Multi-Parameter (TROMP) analysis, for that purpose. The method requires observations of temperature, salinity, oxy-gen and nutrients. Sample collection for nutrient analysis was only taken up at the BATS site in 1988, so our analysis covers the ten year period 1988–1998.
2 Data and method
TROMP analysis was developed as an extension of classical OMP analysis (Tomczak, 1981) when a previous application of OMP analysis to the BATS dataset (Leffanue and Tom-czak, 2005) indicated the disappearance of LSW at the BATS location during 1995–1997. The apparent disappearance was accompanied by a significant increase of the residual error. This led Leffanue and Tomczak to suggest that the disap-pearance of LSW was an artefact of the method, produced
20 A. Henry-Edwards and M. Tomczak: Changes in Labrador Sea Water from BATS data
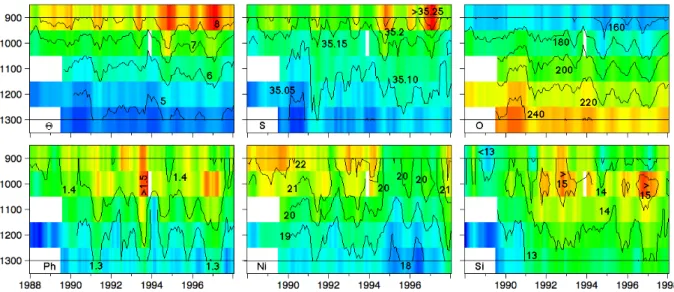
Figure 1: Potential temperature Θ (°C), salinity S, oxygen O (µmol/l) and nutrients Ph, Ni and
Si (µmol/l) at the BATS station for the depth range 900 – 1300 m after data preparation as
described in the text. The resolution in the vertical (100 m intervals) is indicated by the
coloured boxes. Resolution in time (weekly) can be judged from the interpolated contours.
The constrained minimization method that underlies TROMP analysis has an unlimited
number of solutions, and additional sources of information are required to provide guidance
towards the most acceptable scenario. We used the temperature and salinity documented in
Dickson et al. (1996) for the period 1982/3 – 1991/2 (Figure 2) as a guide for the time
evolution of LSW temperature and salinity. Additional guidance came from the results of
Leffanue and Tomczak (2005), who gave LSW contributions of approximately 40% in the
depth ranges 1100 to 1300 metres at times when LSW was not absent from their analysis
altogether. Assuming that LSW was still present but with different source water properties, it
seems reasonable to expect that the volumetric contribution of LSW to water samples
collected at the BATS site should remain close to 40% throughout the entire time period. Any
TROMP analysis result that did not satisfy this requirement was thus deemed unrealistic.
Four source water types were included in the analysis of the depth range 900 – 1300 m.
These were upper and lower Western North Atlantic Central Water (WNACW),
Iceland-Scotland Overflow Water (ISOW) and Labrador Sea Water (LSW). The source definitions,
taken from Leffanue and Tomczak (2005), are given in Table 1. OMP analysis of the BATS
data set showed that in the depth range of interest, relative contributions for upper WNACW
are low and generally less than 10%. Application of TROMP analysis to simulated data
showed that source water type variations are only recognized reliably if the water mass in
question contributes significantly to the water sample. Therefore, though upper WNACW is
still present and its contribution cannot be ignored, its water properties were not considered
as possible variables but were kept constant throughout the analysis.
Fig. 1. Potential temperature 2 (◦C), salinity S, oxygen O (µmol/l) and nutrients Ph, Ni and Si (µmol/l) at the BATS station for the depth range 900–1300 m after data preparation as described in the text. The resolution in the vertical (100 m intervals) is indicated by the coloured boxes. Resolution in time (weekly) can be judged from the interpolated contours.
by changes of LSW source water properties that cannot be accounted for in the OMP analysis.
A detailed description of TROMP analysis is given in Henry-Edwards and Tomczak (2006). To apply TROMP analysis to the BATS data, the data set had to be fitted to a uniform grid in space and time. Outliers in the BATS time series were removed, and the measurements were averaged into five vertical bins of 100 m thickness, starting from 850– 950 m for the uppermost layer to 1250–1350 m for the low-est layer. The time step was defined by the sampling interval (1 month). A five-month running mean was applied to the time series in order to filter short-term variations from the BATS data.
Tests of the TROMP analysis during its development and theoretical considerations with regard to the sequen-tial programming technique used suggested that the method achieves the most reliable results if any changes of source water mass properties are small and evolve slowly in time. To meet that requirement the data sampling rate was increased from monthly to weekly by linear interpolation.
Figure 1 shows the resulting BATS data as used in the TROMP analysis. It is worth noting the level of variation in the nutrient data; nitrate concentrations in particular de-crease at all depths during the period 1994–1997 when LSW disappeared in the analysis of Leffanue and Tomczak (2005). At the same time, the salinity concentration is increasing, and similar though smaller variations in the other water proper-ties are taking place.
The investigation followed the conclusions of Henry-Edwards and Tomczak (2006), who suggested the following sequence of steps:
Step 1: a series of TROMP analyses in which one source water property is allowed to vary across all source water types simultaneously, while all other source water properties are kept constant.
Step 2: inspection of the resulting error fields and analysis output, to identify source water properties which may have varied during the analysis period.
Step 3: a targeted TROMP analysis in which varia-tions are restricted to the source water properties and SWTs identified as likely to have varied.
The constrained minimization method that underlies TROMP analysis has an unlimited number of solutions, and additional sources of information are required to provide guidance towards the most acceptable scenario. We used the temperature and salinity documented in Dickson et al. (1996) for the period 1982/83–1991/92 (Fig. 2) as a guide for the time evolution of LSW temperature and salinity. Additional guidance came from the results of Leffanue and Tomczak (2005), who gave LSW contributions of approximately 40% in the depth ranges 1100 to 1300 m at times when LSW was not absent from their analysis altogether. Assuming that LSW was still present but with different source water properties, it seems reasonable to expect that the volumetric contribution of LSW to water samples collected at the BATS site should remain close to 40% throughout the entire time period. Any TROMP analysis result that did not satisfy this requirement was thus deemed unrealistic.
Four source water types were included in the analysis of the depth range 900–1300 m. These were upper and lower Western North Atlantic Central Water (WNACW),
A. Henry-Edwards and M. Tomczak: Changes in Labrador Sea Water from BATS data 21
Table 1. Source water definitions used in the BATS data analysis. Temperatures are in◦C, oxygen and nutrient data in µmol/L.
Water Type potential temperature salinity oxygen phosphate nitrate silicate
WNACW (upper) 18.9 36.6 190.0 0.25 6.0 2.0
WNACW (lower) 9.40 35.1 135.0 1.70 24.0 15.0
LSW 3.165 34.832 305.0 1.09 16.4 9.1
ISOW 3.060 34.970 280.0 1.12 17.0 14.6
Table 2. Parameter weights given by Leffanue and Tomczak (2005). All parameters are non-dimensionalised by dividing through the difference between the largest and smallest corresponding parameter values from Table 1, and all weights are non-dimensional.
potential salinity oxygen phosphat nitrate silicate mass
temperature conservation
271 126 30 4 32 10 271
Scotland Overflow Water (ISOW) and Labrador Sea Wa-ter (LSW). The source definitions, taken from Leffanue and Tomczak (2005), are given in Table 1. OMP analysis of the BATS data set showed that in the depth range of interest, rel-ative contributions for upper WNACW are low and generally less than 10%. Application of TROMP analysis to simulated data showed that source water type variations are only rec-ognized reliably if the water mass in question contributes significantly to the water sample. Therefore, though upper WNACW is still present and its contribution cannot be ig-nored, its water properties were not considered as possible variables but were kept constant throughout the analysis.
3 Results
A large number of TROMP analysis runs were performed for step 1 of the analysis. In each run a single source property was defined as a variable for the analysis and allowed to vary in all source water masses. The error fields generated in this way were not as clear as those generated for the simulated data sets in Henry-Edwards and Tomczak (2006).
Figures 3 and 4 show examples of runs from step 1 of the analysis and demonstrate what can be learnt from an ensem-ble of runs (step 2). To begin with, the apparent relative con-tribution of LSW decreases rapidly during the first two years and remains low during the remainder of the investigation pe-riod. It falls below 30% during most of the time at the 900 m level and on several occasions at the 1000 m level. Through our experience with the TROMP analysis, we have found that if a water mass contributes less than a third of the measured sample, the results are usually unreliable. We therefore ex-cluded data from the 900 m and 1000 m levels from further consideration in the analysis.
Figure 2: Time development of LSW potential temperature and salinity for 1960 – 1995. From Dickson et al. (1996).
Table 1: Source water definitions used in the BATS data analysis. Temperatures are in °C, oxygen and nutrient data in µmol/L.
Water Type potential temperature
salinity oxygen phosphate nitrate silicate
WNACW (upper) WNACW (lower) 18.9 9.40 36.6 35.1 190.0 135.0 0.25 1.70 6.0 24.0 2.0 15.0 LSW 3.165 34.832 305.0 1.09 16.4 9.1 ISOW 3.060 34.970 280.0 1.12 17.0 14.6
Results
A large number of TROMP analysis runs were performed for step 1 of the analysis. In each run a single source property was defined as a variable for the analysis and allowed to vary in all source water masses. The error fields generated in this way were not as clear as those generated for the simulated data sets in Henry-Edwards and Tomczak (submitted).
Figures 3 and 4 show examples of runs from step 1 of the analysis and demonstrate what can be learnt from an ensemble of runs (step 2). To begin with, the apparent relative contribution of LSW decreases rapidly during the first two years and remains low during the remainder of the investigation period. It falls below 30% during most of the time at the 900 m level and on several occasions at the 1000 m level. Through our experience with the TROMP analysis, we have found that if a water mass contributes less than a third of the measured sample, the results are usually unreliable. We therefore excluded data from the 900m and 1000 m levels
Fig. 2. Time development of LSW potential temperature and salin-ity for 1960–1995. From Dickson et al. (1996).
The results for the 1100 m, 1200 m and 1300 m levels gen-erally follow the same trend in time but differ quantitatively. The variations of LSW potential temperature and salinity are much larger than observed and are certainly unrealistic. Comparison of Fig. 3 with Fig. 4 also shows that the quan-titative result is quite dependent on the weights used. Lef-fanue and Tomczak (2004) derived their weights (Table 2) in the standard manner for OMP analysis to reflect the mea-surement accuracy and spread between water masses of each parameter. In a TROMP analysis weights play quite a differ-ent role; they influence the search direction of the line search procedure in the quadratic optimisation (Henry-Edwards and Tomczak, 2006), and there is no objective rule that deter-mines their choice. We performed the analysis with numer-ous weightings, ranging from those of Leffane and Tomczak (2005) to uniform weights. Our final choice of weights (those
22 A. Henry-Edwards and M. Tomczak: Changes in Labrador Sea Water from BATS data
Figure 3: Time development of the relative LSW contribution to the water samples and of the
LSW source water properties potential temperature Θ (°C), salinity S, oxygen O (µmol/L),
phosphate Ph (µmol/L) and nitrate Ni (µmol/L) if one source water property is varied in all
source water types. Weights from Leffanue and Tomczak (2004).
Figure 4: As Figure 3, but with uniform weights.
The results for the 1100 m, 1200 m and 1300 m levels generally follow the same trend in
time but differ quantitatively. The variations of LSW potential temperature and salinity are
much larger than observed and are certainly unrealistic. Comparison of Figure 3 with Figure
4 also shows that the quantitative result is quite dependent on the weights used. Leffanue and
Tomczak (2004) derived their weights (Table 2) in the standard manner for OMP analysis to
Fig. 3. Time development of the relative LSW contribution to the water samples and of the LSW source water properties potential temperature
2(◦C), salinity S, oxygen O (µmol/L), phosphate Ph (µmol/L) and nitrate Ni (µmol/L) if one source water property is varied in all source water types. Weights from Leffanue and Tomczak (2004).
Figure 3: Time development of the relative LSW contribution to the water samples and of the
LSW source water properties potential temperature Θ (°C), salinity S, oxygen O (µmol/L),
phosphate Ph (µmol/L) and nitrate Ni (µmol/L) if one source water property is varied in all
source water types. Weights from Leffanue and Tomczak (2004).
Figure 4: As Figure 3, but with uniform weights.
The results for the 1100 m, 1200 m and 1300 m levels generally follow the same trend in
time but differ quantitatively. The variations of LSW potential temperature and salinity are
much larger than observed and are certainly unrealistic. Comparison of Figure 3 with Figure
4 also shows that the quantitative result is quite dependent on the weights used. Leffanue and
Tomczak (2004) derived their weights (Table 2) in the standard manner for OMP analysis to
Fig. 4. As Fig. 3, but with uniform weights.
of Leffanue and Tomczak, 2005) was determined by the qual-ity of the result as outlined below.
The insight gained from the runs shown in Figs. 3 and 4 as well as many other runs determined the conditions for step 3 of the analysis. LSW temperature and salinity were selected as variables, based on our knowledge from Dickson et al. (1996). It was also noted that the nitrate concentration showed a consistent decrease over time in all runs
regard-less of the chosen weights (compare Figs. 3 and 4), while the other nutrients and oxygen behaved erratically and did not show clear trends. Nitrate was therefore included as a variable in the analysis, while oxygen, phosphate and silicate concentrations were kept as constants.
An interesting consequence of this is the implicit as-sumption that the Redfield ratio varied significantly in the Labrador Sea during the investigation period. To gain
A. Henry-Edwards and M. Tomczak: Changes in Labrador Sea Water from BATS data 23 reflect the measurement accuracy and spread between water masses of each parameter. In a
TROMP analysis weights play quite a different role; they influence the search direction of the line search procedure in the quadratic optimisation (Henry-Edwards and Tomczak, submitted), and there is no objective rule that determines their choice. We performed the analysis with numerous weightings, ranging from those of Leffane and Tomczak (2005) to uniform weights. Our final choice of weights (those of Leffanue and Tomczak, 2005) was determined by the quality of the result as outlined below.
Table 2: Parameter weights given by Leffanue and Tomczak (2005). All parameters are non-dimensionalised by dividing through the difference between the largest and smallest
corresponding parameter values from Table 1, and all weights are non-dimensional.
potential temperature
salinity oxygen phosphate nitrate silicate mass conservation
271 126 30 4 32 10 271
The insight gained from the runs shown in Figures 3 and 4 as well as many other runs determined the conditions for step 3 of the analysis. LSW temperature and salinity were selected as variables, based on our knowledge from Dickson et al (1996). It was also noted that the nitrate concentration showed a consistent decrease over time in all runs regardless of the chosen weights (compare Figures 3 and 4), while the other nutrients and oxygen behaved erratically and did not show clear trends. Nitrate was therefore included as a variable in the analysis, while oxygen, phosphate and silicate concentrations were kept as constants.
An interesting consequence of this is the implicit assumption that the Redfield ratio varied significantly in the Labrador Sea during the investigation period. To gain support for this assumption we performed a simple reduced major axis (Pearson, 1901) regression of the BATS data over the depth range 700 m – 1600 m to determine the ratios of nitrate to phosphate and nitrate to silicate at the BATS station as functions of time. The results shown in Figure 5 indicate significant variations in the nutrient ratios. Though it is possible to think of many reasons for the observed variations, the possibility that changes in the nitrate concentration of LSW may be responsible cannot be ruled out.
Figure 5: Time variation of Redfield ratios (heavy lines) in the BATS data depth range 700 – 1600 m and associated correlation coefficients (thin lines).
Fig. 5. Time variation of Redfield ratios (heavy lines) in the BATS data depth range 700–1600 m and associated correlation coefficients (thin lines).
Figure 6 shows the final result of step 3 of the analysis (LSW potential temperature, salinity
and nitrate concentrations defined as variables). It is seen that the relative water mass
contributions remain relatively stable, starting at a slightly higher level before settling on the
range 30 – 50%. The largest LSW contribution is found at the 1300 m level, which should
therefore be considered to give the most reliable result. Significant differences between
solutions from different depth levels are observed as soon as the contribution of LSW falls
below about 30%. We conclude that TROMP analysis requires a minimum contribution of
about 30% of a water mass if it is to give a physically realistic result. The only data set that
satisfies this requirement for the entire observation period is the data set from the 1300 m
depth level.
Figure 6: Time development of the relative LSW contribution to the water samples and of the
LSW source water properties potential temperature Q (°C), salinity S and nitrate Ni (µmol/L)
if only LSW potential temperature, salinity and nitrate concentration are allowed to vary.
Weights are taken from Leffanue and Tomczak (2004).
In contrast to the results of the runs of step 1, variations of LSW potential temperature and
salinity in time are now comparable with the observations, and different depth levels often
give identical results. Direct comparison requires an estimate of the transit time from the
Labrador Sea to the BATS location. The calculated decrease of the potential temperature is
about 0.6 – 1.0°C, which compares well with the observed decrease of 0.9°C between 1970
and 1995 (Figure 2). Transit times of the order of 6 – 10 years place the observed LSW
potential temperature in the range 2.8 – 3.2°C, slightly higher than derived by TROMP
analysis. The LSW salinity in the range for the period is 34.83 – 34.88, somewhat lower than
Fig. 6. Time development of the relative LSW contribution to the water samples and of the LSW source water properties potential temperature
2(◦C), salinity S and nitrate Ni (µmol/L) if only LSW potential temperature, salinity and nitrate concentration are allowed to vary. Weights are taken from Leffanue and Tomczak (2004).
support for this assumption we performed a simple reduced major axis (Pearson, 1901) regression of the BATS data over the depth range 700 m–1600 m to determine the ratios of ni-trate to phosphate and nini-trate to silicate at the BATS station as functions of time. The results shown in Fig. 5 indicate sig-nificant variations in the nutrient ratios. Though it is possible to think of many reasons for the observed variations, the pos-sibility that changes in the nitrate concentration of LSW may be responsible cannot be ruled out.
Figure 6 shows the final result of step 3 of the analysis (LSW potential temperature, salinity and nitrate concentra-tions defined as variables). It is seen that the relative wa-ter mass contributions remain relatively stable, starting at a
slightly higher level before settling on the range 30–50%. The largest LSW contribution is found at the 1300 m level, which should therefore be considered to give the most re-liable result. Significant differences between solutions from different depth levels are observed as soon as the contribution of LSW falls below about 30%. We conclude that TROMP analysis requires a minimum contribution of about 30% of a water mass if it is to give a physically realistic result. The only data set that satisfies this requirement for the entire ob-servation period is the data set from the 1300 m depth level.
In contrast to the results of the runs of step 1, variations of LSW potential temperature and salinity in time are now comparable with the observations, and different depth levels
24 A. Henry-Edwards and M. Tomczak: Changes in Labrador Sea Water from BATS data often give identical results. Direct comparison requires an
es-timate of the transit time from the Labrador Sea to the BATS location. The calculated decrease of the potential tempera-ture is about 0.6–1.0◦C, which compares well with the ob-served decrease of 0.9◦C between 1970 and 1995 (Fig. 2). Transit times of the order of 6–10 years place the observed LSW potential temperature in the range 2.8–3.2◦C, slightly higher than derived by TROMP analysis. The LSW salinity in the range for the period is 34.83–34.88, somewhat lower than derived by TROMP analysis.
4 Discussion
The results presented in Fig. 6 show that it is possible to achieve reasonable agreement between observed and calcu-lated time changes of LSW potential temperature and salinity by restricting the selection of variables to three LSW proper-ties, namely potential temperature, salinity and nitrate. This does of course not imply that the source properties of all other water masses remained unchanged during the period. But the analysis suggests that of all possible variations in source water mass properties, the ones that had the greatest impact at the BATS location were the three properties identi-fied through TROMP analysis. Many combinations of source water property changes can be imagined to explain the re-maining difference between observed and calculated poten-tial temperatures and salinities. Without additional informa-tion they would remain pure speculainforma-tion.
Identifying the most appropriate solution to a nonlinear underdetermined system of equations is a complex task, and more work will be required to develop TROMP analysis into a standard technique of water mass analysis. The present pa-per has to be seen as a pilot project in that process. Future efforts will probably have to concentrate on methods to find the best weighting procedure, since the weights determine the search direction in parameter space for the minimization scheme and therefore have a large influence on the solution, as demonstrated through Figs. 3 and 4. The finally accepted solution (Fig. 6) displays similar or even larger ranges of time variability but opposite trends, with potential temper-ature and salinity both decreasing over time instead of in-creasing, which brings it much closer to the observed time development of LSW properties.
Reproducing observations through a highly under-determined minimization technique does not add anything to the existing oceanographic knowledge unless it produces new insight in the process. The main result from this study is that knowledge of the time history of potential temper-ature and salinity in the Labrador Sea, combined with the knowledge of the time history of the complete suite of physi-cal and nutrient data at the BATS location, provides strong evidence that the nitrate content of the Labrador Sea var-ied during the period, while oxygen and phosphate did not vary significantly. In our analysis the nitrate values for LSW
show a clear trend, falling steadily from 16.1 µmol/L at the beginning of the analysis to 11 µmol/L towards the end but recovering to 18.7 µmol/L in the final six months. This cor-responds approximately to the time when potential tempera-ture and salinity began to diverge as deep convection in the Labrador Sea started to excavate the underlying North At-lantic Deep Water (Dickson et al., 1996).
The reasons for the change in LSW nitrate concentration are difficult to determine. Interannual variations in the con-vection depth can lead to changes in all water mass properties (the observed variations in temperature and salinity are gen-erally attributed to that process). If NADW has a different Redfield ratio from the ratio found in the mixed layer, en-trainment of NADW can result in a change of the LSW Red-field ratio; but it is unlikely that this leads only to a change in nitrate concentration and does not affect the other nutrients or oxygen. A more promising candidate for a satisfactory ex-planation would be a change in air-sea interaction processes, similar to those invoked by Hood et al. (2001) and Babiker et al. (2004). Our analysis can only serve as an incentive to look at long-term atmospheric conditions over the Labrador Sea and their impact on nutrient levels.
It is possible that the difference between observed and modelled potential temperature and salinity (Fig. 2 vs. Fig. 6) contains new insight as well. The observations that served to define the constraints for the model were taken by weather ship Bravo. The ship was located at approximately 56◦300N 51◦000W, half way between the easternmost point of main-land Canada and the southern tip of Greenmain-land. This places it in the centre of the Labrador Basin but on the southern border of the Labrador Sea proper, where the water mass formation occurs. It is possible that the LSW contribution at the BATS station was formed in the inner Labrador Sea. The observa-tions taken at Bravo see LSW at the time of leaving the re-gion, when it already had sufficient opportunity to be diluted and warm up from mixing. The result from TROMP analy-sis invites speculation that LSW at the source may have been colder and more saline than at weathership Bravo. While this cannot be verified in the current context it is comforting to note that the difference between observed and modelled po-tential temperature and salinity has the correct sign for such an interpretation.
Though originally developed for use in the analysis of oceanographic time series, TROMP analysis has several other potential applications. Tomczak and Liefrink (2005) recently completed an OMP analysis of WOCE section SR03 between Tasmania and Antarctica, which produced five oceanographic sections across the Circumpolar Current between 1991 and 1996. They found a significant increase of the volume of Lower Circumpolar Deep Water at the expense of Upper Circumpolar Deep Water over the five year period and raised the question whether this could at least partly be an artefact produced by variations in the source water prop-erties of the water masses found in the section. A repeat analysis using the TROMP technique indicates that for the
A. Henry-Edwards and M. Tomczak: Changes in Labrador Sea Water from BATS data 25 data collected in 1994–1996 the residual error cannot be
re-duced any further by changing the source water type defini-tions, confirming the correct choice of source water types in the OMP analysis. Significant reductions of the residual error are possible for the years 1991 and 1993. TROMP analysis is currently being used to determine the most appropriate water type definitions for these years and to construct a time history of Antarctic water mass properties (Tomczak and Liefrink, 20061).
Another possible application of TROMP analysis is the de-termination of variations in the Redfield ratios. Historically it was assumed that these ratios are constant. During the last two decades it became evident that the ratios are functions of space (Takahashi et al., 1985; Anderson and Sarmiento, 1994; Shaffer, 1996; Hupe and Karstensen, 2000). There is now evidence to suggest that they can vary not only from region to region but also in time (Pahlow and Riebesell, 2000). TROMP analysis could prove a useful tool for the identification of variations in Redfield ratios in space or time. Edited by: J. M. Huthnance
References
Anderson, L. A. and Sarmiento, J. L.: Redfield ratios of rem-ineralization determined by nutrient data analysis, Global Bio-geochem. Cycles, 8, 65–80, 1994.
Anderson, T. and Pondaven, P.: Non-Redfield carbon and nitrogen cycling in the Sargasso Sea: pelagic imbalances and export flux, Deep-Sea Res., I, 50, 573–591, 2003.
Babiker, I., Mohamed, A., Komaki, K., Ohta, K., and Kato, K.: Temporal Variations in the Dissolved Nutrient Stocks in the Sur-face Water of the Western North Atlantic Ocean, J. Oceanogr., 60, 553–562, 2004.
Curry, R. and McCartney, M.: Labrador Sea Water Carries Northern Climate Signal South, Oceanus, 39, 2, 24–29, 1996.
Dickson, R., Lazier, J., Meincke, J., Rhines, P., and Swift, J.: Long-Term Coordinated Changes in the Convective Activity of the North Atlantic, Prog. Oceanogr., 38, 241–295, 1996.
1Tomczak, M. and Liefrink, S.: On Interannual Variations of
Water Mass Properties in the Southern Ocean. J. Atmos. Ocean Sci., submitted, 2006.
DuRand, M., Olson, R., and Chisholm, S.: Phytoplankton popula-tion dynamics at the Bermuda Atlantic Time-series stapopula-tion in the Sargasso Sea, Deep-Sea Res., II, 48, 1983–2003, 2001. Henry-Edwards, A. and Tomczak, M.: Remote Detection of
wa-ter property changes from a time series of oceanographic data, Ocean Sci., 2, 11–18, 2006.
Hupe, A. and Karstensen, J.: Redfield stoichiometry in Arabian subsurface waters, Global Biogeochem. Cycles, 14, 357–372, 2000.
Joyce, T. and Robbins, P.: The Long Term Hydrographic Record at Bermuda, J. Climate, 9, 3, 3121–3131, 1996.
Hood, R., Bates, N., Capone, D., and Olson, D.: Modeling the ef-fect of nitrogen fixation on carbon and nitrogen fluxes at BATS, Deep-Sea Res., II, 48, 1609–1648, 2001.
Leffanue, H. and Tomczak, M.: Using OMP Analysis to Observe Temporal Variability in Water Mass Distribution, J. Mar. Syst., 48, 3–14, 2004.
Pahlow, M. and Riebesell, U.: Temporal trends in deep ocean Red-field ratios, Science, 287, 831–833, 2000.
Pearson, K.: On lines and planes of closest fit to systems of points in space, Philosophical Magazine, 6, 559–572, 1901.
Shaffer, G.: Biogeochemical cycling in the global ocean 2, new production, Redfield ratios, and remineralization in the organic pump, J. Geophys. Res., 101, 3723–3745, 1996.
Steinberg, D., Carlson, C., Bates, N., Johnson, R., Michaels, A., and Knap, A.: Overview of the US JGOFS Bermuda Atlantic Time-series Study (BATS): a decade-scale look at ocean biology and biogeochemistry, Deep-Sea Res., 2, 48, 1405–1447, 2001. Takahashi, T., Broecker, W. S., and Langer, S.: Redfield ratio based
on chemical data from isopycnal surfaces, J. Geophys. Res., 90, 6907–6924, 1985.
Tomczak, M.: A multi-parameter extension of temperature/salinity diagram techniques for the analysis of non-isopycnal mixing, Prog. Oceanogr., 10, 147–171, 1981.
Tomczak, M. and Liefrink, S.: Interannual variations of water mass volumes in the Southern Ocean, J. Atmos. Ocean Sci., 10, 31–42, 2005.