XVIIth World Congress of the International Commission of Agricultural and Biosystems Engineering (CIGR) Hosted by the Canadian Society for Bioengineering (CSBE/SCGAB)
Québec City, Canada June 13-17, 2010
TEST AND EVALUATION OF TWO PROCESS CONTROL STRATEGIES FOR ADAPTING DIRECT INJECTION PESTICIDE APPLICATION TO SMALL
SCALE FARMS
EL AISSAOUI A.1, LEBEAU F.2, ELBAHIR L.3, DESTAIN M-F.4, HOUMY K.5
1 INRA, Dry Land Research Center, Po box 589 Settat 26000, Morocco < [email protected]>. 2,4 ULg - Gembloux Agro-Bio Tech, Mechanics and Construction Department, 5030 Gembloux, Belguim. 3 ENSA, Po box 575,Gueliz, Marrakech, Morocco
5 IAV Hassan II, Po box 6202, Rabat-Instituts, Rabat, Morocco
CSBE10XXX – Presented at 8th World Congress on Computers in Agriculture ABSTRACT Small scale farmers, in developing and in some developed countries, are faced to actual difficulties of applying pesticides accurately and safely on vegetables crops. They mainly use hand operated sprayers. As an issue, a small direct injection system based on a five meter's parallel boom layout was designed to improve chemical application. The boom layout was optimised to obtain the same minimal lag time response for the ten nozzles. The dynamic of the system was modelled using SimulinkTM as first order model with delay. Two control strategies were implemented using PID feedback control loops to monitor tracer injection (fluorescing) proportionally to simulated forward speed (from 0.6 to 1.2 m/s) and to control the constant operating pressure (constant carrier flow strategy) or the variable operating pressure proportionally to the injected chemical amount (variable total flow strategy). Different forward speed changes were induced using steps up and down, ramps, sine waves and sweeps solicitations to evaluate the control feedback. The system stability was tested for its ability to maintain the expected concentration and application rate. The results show that the lag time remains less than 3 s (dead time < 2s , time constant < 1s) and the system keeps stable for the maximal speed variation and acceleration tested (∆V=200%, a= 0.48 m/s2) which induce less than 10% variation of application rate.
Keywords: Feedback control, direct injection, variable rate application, small farms. INTRODUCTION
In developing countries, pesticide applications are far from the level reflected by the actual state of the art (Friedrich, 1998). Research and extension services are still constrained by difficulty of introducing and promoting sophisticated spraying technologies such as variable rate application. This can be due to pre-conceived attitudes about feasibility of using electronic and process control in agriculture. However, introduction of technologies has shown successful acceptability in different human life sectors.
Introduction of standardized good quality equipment and operator training seems to be necessary to effectively improve pesticide applications (Pingaly, 1994). Technology allowing a reasonably safe and efficient application of pesticides exists as well as concepts to introduce its use in practice. However, those concepts have to be adapted to specific situation in every region. Their introduction depends on the technical capacity, organization, cultural background and good will of the involved people (Friedrich, 1998). Agricultural technologies can be viewed as means by which farmers seek to achieve their production objectives. They have many objectives, including risk management, quality of life, and environmental stewardship. Farmer's profitability calls for using variable rate application (VRA) input control up to the point where the cost of additional charge can be justified by expected yield gains and/or reducing inputs (Swinton and Lowenberg-DeBoer, 1998).
VRA has not received much attention in third world countries as a result of cost and level of the technologies involved. Though, the integration of modern technology tools optimises the chemical application rate as it takes the spatial variability into account during the spraying process (Abdul-Fattah, 2001). Efficient use of herbicides with minimum environmental effect is of concern and public sector has to play a role in promoting new technologies and this in collaboration with private sector and all partners. Design of direct injection application technology can be of important impact on the safety of operator and environment in small scale farms. In fact, the use of electronics in modern spraying equipment allows exact dosing and avoids spraying misapplication to potentially reduce environmental contamination. However, developers should take into account the affordability and adaptability criteria to be accepted by the small farmers. Otherwise, there are many reasons why it is essential that technological developments continue to improve the accuracy of chemicals application: the development of more selective compounds that are applied at low rates; increased costs of chemicals; applicator and land exposure concerns; food safety issues; and environmental concerns regarding water quality and spray drift (Bode and Bretthauer, 2008).
LITERATURE REVIEW
Direct injection system (DIS) applies chemical proportionally to forward-speed. The injection pump dispenses pesticide at known rate into the carrier flow within the hydraulic layout. The main tank of the sprayer contains only clean water. The major advantages of injection sprayers can be shown in reducing environmental pollution due to the elimination of tank washing and operator contamination which potentially occurs with conventional sprayers. DIS enables farmers to rationalize their pesticide application by using electronic controller for accurately metering injection pump and/or carrier pump to deliver a specific amount according to real time changes in operating requirements (Landers, 1999).
Ideally, for metering, injecting and mixing concentrates into the diluent flow, there are two different control principles used to achieve a constant pesticide application rate independently of travel speed variation: a) Variable total flow rate control based on travel speed and maintenance of a constant chemical concentration and b) Variable chemical
concentration control in the diluent flow based on travel speed and maintenance of a constant total flow rate (Koo and Sumner, 1998).
Though, the injection system has many potential advantages, there is a problem of transport lag due to the time required for a change in concentration to become fully established at spray nozzles. The time delay results in a transient error in application rate (Budwig et al., 1988; Tompkins et al., 1990). It mainly depends on hydraulic boom layout design and process control considerations.
The combination of the two concepts, total-flow-control and chemical injection control, can be optimized to minimize the potential transient error and maintain consistently a constant chemical concentration diffusion in the field. When the system is equipped with variable flow nozzles, it could provide consistent spray characteristics over a wide flow range (Koo and Kuhlman, 1993).
This research was carried for testing and evaluating constant and variable total-flow-control strategies for the use of direct-injection spraying technology in small scale farming conditions.
MATERIEL AND MATHODS Direct injection test bench:
The process control testing was mounted in a laboratory platform in order to be adapted in second stage to rolling small sprayer operated by a walking worker. The ground speed is simulated similarly to the field working conditions. The direct injection system is equipped with main diaphragm pump (Flojet, 24V DC,10 l/mn~2,8 bars ), and metering peristaltic pump (Marlow WatsonTM 400D/E, 15V DC, 48 ml/mn (x 2)) to inject chemical closely to the upstream side of the main pump. The boom layout consists on ten tip nozzles (Tejeet XR 11002) mounted in parallel scheme by quick connect flexible (FestoTM, d= 4mm) to the collector (figure 1). The parallel design was optimized to satisfy the minimal lag transport (El Aissaoui & al, 2009) and to carry out the same dynamic response occurring transversally in the tip nozzles.
The Technical Application Rate (TAR) depends actually on the carrier flow rate Q, chemical concentration at the nozzles C, boom width Wb and ground speed V by the
following equation (Miller and Smith, 1992):
) / ( ) ( ) / ( ) / ( ) / ( 2 s m V m W l ml C s l Q m ml TAR b × × = (1)
The chemical concentration is the ratio between injection pump flow rate qi (ml/s) and
carrier flow rate Q (l/s). The occurring application error (e) depends on the real time application rate and the desired technical application rate as follows:
TAR TAR t TAR t e( )= ( )− (2)
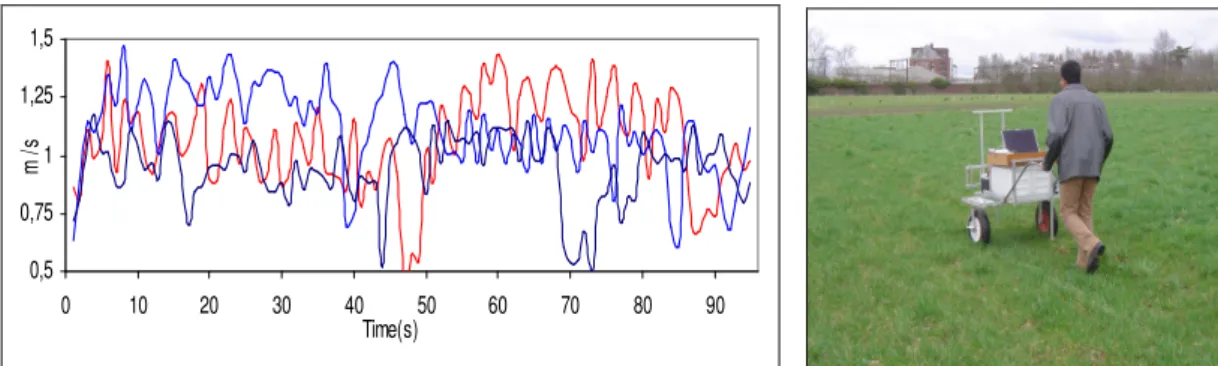
The ground speed profile used for evaluating the metering process control was generated in the field as the worker can actually operate a rolling sprayer platform of 50Kg. Figure 2 shows time series measured in crop field condition by speed sensor (TURCK Bi 5-G18K-AP6X). The average operating speed turn around 1 m/s (CV=0.2 m/s) with minima and maxima values respectively of 0.5 and 1.5 m/s. The maximal occurring acceleration (or deceleration) was 0.5 m/s2. The speed band [0.5-1.5m/s] was taken as setting points to vary the injection metering flow from qmin = 15 ml/mn to qmax = 45
ml/mn for applying a typical amount of 1 l/ha (0.1 ml/m2). The carrier flow was performed to turn around 6 l/mn according to the operating pressure (2±1 Bar), nozzle's reference (Teejet XR 11002) and flow control requirement.
0,5 0,75 1 1,25 1,5 0 10 20 30 40 50 60 70 80 90 Time(s) m /s
Controller and data acquisition design:
A feedback PID controller was implemented in LabVIEW 8.2 for processing the chemical injection metering and the carrier flow subsystems via PWM actuators (2020S of CJ Controls LTD). The peristaltic pump input voltage was commanded to manage the injected flow rate loop output on the basis of the speed sensor frequency (TURCK G05-AP6X ) converted to voltage (TURCK MS 25-10). The pump shaft speed was used to determine its output into the carrier since the chemical flow rate is proportional to the shaft speed (Steward & al, 2000). The control of the diaphragm pump loop output was actuated on the basis of the operating pressure sensed at tip nozzle level by the transducer (SensorthechnicsTM CTE 8005GY7, Pmax=5bars, non-linearity=0.1, hysteresis=0.015).
Lag transport was approached by a fluorometric sensor designed and calibrated to sense fluorescein transmittance at 520 um at the tip nozzle level (El Aissaoui & al., 2007). Data were acquired via DAQ NI-USB6251 at sampling frequency of 10Hz.
Process control subsystems modeling
To design a control system, it is necessary to model the process for obtaining its associated parameters (Guzman & al, 2004). The response of peristaltic pump to flow injection was approached as a first order system Ginj(s) = K/(τs+1) on the basis of its
open loop reaction curve, where k is the static gain (the quotient in amplitudes between converted frequency to voltage output and command voltage input) and τ is time constant (τ~0.2s). In order to satisfy experimental metering response for the maximal ground speed step change [0.5m/s to 1.5m/s], the controller was set to reversibly operate the command voltage (Uc) of the pump within the magnitude of [1.5V to 4.7V]. The
frequency-to-voltage feedback (Uf) was within [2.2V to 9.6V] corresponding respectively
to shaft speed (w) and flow rate (q) magnitudes of [60 rpm to 280 rpm] and [10.73 ml/mn to 48.77 ml/mn]. Linear regression was used to estimate slopes of Uc-q, w-Uf and q-w
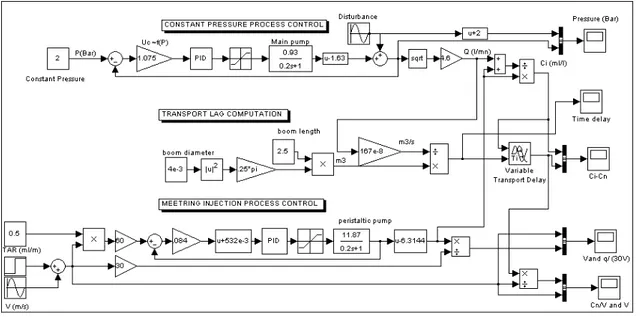
curves. Furthermore, the system was modeled in SimulinkTM (Math Works, Inc.) to simulate step responses and optimal PID parameters values (P=1, I=20, D=0.2) (Fig 3). The carrier flow rate process was similarly approached as a first order system with dead time Gp(s) = Ke-sto/(τs+1). The delay was due mainly to transport lag in boom tubing. The
controller commands the diaphragm pump on the basis of the pressure feedback sensed at tip nozzle level. The command voltage [Ucmax=5V] was tested experimentally to operate the pump at different pressures (Pmax=3Bar; Q= 7.9l/mn for ten nozzles Teejet XR11002). Voltage-pressure relationship (Uc-P) was empirically approached by linear regression (Uc = 1.075P+1.63; R2=0.99). The carrier flow rate depends on nozzle's flow rate model (q=0.46P0.49; R2=0.99). According to the control strategy, the controller aims to set a constant pressure for a constant carrier flow control or to vary pressure [1-3bars] proportionally to ground speed [0.6-1.2m/s] with constant gain (P=3.33V-1; R2=1) to carry out the total flow control (Fig 3).
Figure 3 Constant carrier flow control modeling by SimulinkTM
RESULTS AND DISCUSSION Constant carrier flow control
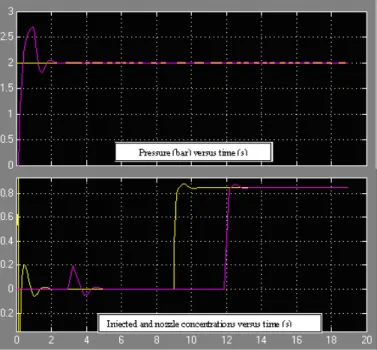
The modeling of control system in SimulinkTM at constant operating pressure of 2 bars was showed a delayed response in nozzle's concentration of less than 3s for 0.6-1.2 m/s step change (Fig 4). The steps generated experimentally showed the same transport lag and control system behaviour. The response of the system to ramp solicitation (0.3m/s/10s) was constant in term of injection concentration (q/V ratio). However, the trend of concentration at nozzle (Cn/V ratio) shows how the derivative of the speed can be of importance to dynamically improve the correction of output concentration (Fig 5a). The compensation of transport delay via the carrier flow overshooting can be of great importance to improve the control dynamic. The sine wave and sweep solicitations showed the ability of system to control concentration as the time allowed to speed change keeps bigger than the transport delay (Fig 5b). The constant carrier flow control cannot be more effective when the frequency of operating speed change is as higher as to affect the control stability and robustness. The carrier flow feed forward can be of great concern to continuously maintain the TAR variability within ±5%.
Total carrier flow control
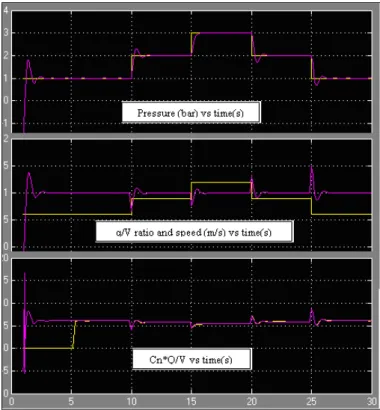
The modeling of control system by varying operating pressure from 1 to 3 bars showed the advantage of decreasing lag transport from 4 to 2.3s as speed increase from 0.6 to 1.2 m/s. The experimental trends (Fig 7) showed that the control response to ramp and step solicitations was improved in comparison to the constant carrier flow control. The lag transport compensation due to pressure increasing can be of great concern with the use of nozzles operating at the large pressure range. However, the performance and stability of varying pressure process keeps conditioned by the softness of operating speed change.
The reliability and endurance of carrier flow pump are too of great importance to maintain the control performance and system durability.
Figure 4 Constant carrier flow control response to speed step change (SimulinkTM model)
Figure 5 Constant carrier flow control feedback to speed change: step, ramp, sine wave and sweep solicitations (experimental data)
Figure 6 Total carrier flow control response to speed step change (SimulinkTM model)
Figure 7 Total carrier flow control response to speed change (experimental data) CONCLUSION
The preliminary testing and evaluation of the two process control strategy showed the technical feasibility of the direct injection technology to be mounted on adapted rolling sprayer for small scale farms. The constant carrier flow control can be relatively the
simplest and affordable solution to be used in developing country regarding to its easy implementation, and possibility of its adaptation to existing sprayer.
Acknowledgements
Authors thank Belgian Technical Cooperation (BTC) for the research fund, and acknowledge technician, Rudy Schwartz, for his contribution to carrying out experimental design
REFERENCES
Abd-elfatah, Y. 2001. Performance assessment of wooden peristaltic chemical spray pump. ASABE, annual international meeting 2001, Sacramento, California, USA. Bode, L. E. and Bretthauer S. M. 2008. Agricultural chemical application technology: a remarkable past and an amazing future. Trans. ASABE 51(2): 391-395.
Budwig, R. S., J. M. McDonald, and T. J. Karsky. 1988. Evaluation of chemical injection systems for mobile agricultural spray equipment. ASAE Paper No. 88-1542. St.joseph, Mich.: ASAE.
El Aissaoui A., F. Lebeau, M-F Destain. 2007. Development of an optical sensor to measure direct injection spraying system performance. VDI-MEG Agricultural Engineering Conference, Hannover, November 09-10, 2007.
El Aissaoui A., F. Lebeau, M-F Destain. 2009. Applying control volume finite element for modeling direct injection boom spraying. World Congress of Computer in Agriculture, Reno-NV, USA, June 21-24, 2010.
Friedrich, T. 1998. Agricultural pesticide application: concepts for improvements, FAO Agricultural Engineering Branch, Rome, Italy
Koo, Y. M., and D. K. Kuhlman. 1993. A variable flow nozzle with consistent spray performance. Transactions of the ASAE 36(3):685-690.
Koo, Y. M. and H. R. Sumner. 1998. Total flow control for a direct injection sprayer. Applied Engineering in Agriculture 14(4): 363-367.
Landers, A. 1999. Modern technology to improving spraying efficiency, Cornell University, Department of Agricultural and Biological Engineering
Pingali, P. 1994. Developing agricultural markets in liberalizing economies: Pesticides; 14th World Bank Agricultural Symposium, Washington D.C.USA, January 4-5, 1994. Swinton, S.M., Lowenberg-DeBoer, J. 1998. Evaluating the profitability of site specific farming, Journal of Production Agriculture 11: 439-446.
Tompkins, F. D., K. D. Howard, C. R. Mote, and R. S. Freeland.1990. Boom flow characteristics with direct chemical injection. Transactions of the ASAE 33(3): 737-743.