HAL Id: hal-02399962
https://hal.archives-ouvertes.fr/hal-02399962
Submitted on 10 Dec 2019HAL is a multi-disciplinary open access archive for the deposit and dissemination of sci-entific research documents, whether they are pub-lished or not. The documents may come from teaching and research institutions in France or abroad, or from public or private research centers.
L’archive ouverte pluridisciplinaire HAL, est destinée au dépôt et à la diffusion de documents scientifiques de niveau recherche, publiés ou non, émanant des établissements d’enseignement et de recherche français ou étrangers, des laboratoires publics ou privés.
Small microplastics as a main contributor to plastic
mass balance in the North Atlantic subtropical gyre
Marie Poulain, Matthieu Mercier, Laurent Brach, Marion Martignac, Corinne
Routaboul, Emile Perez, Marie Christine Desjean, Alexandra ter Halle
To cite this version:
Marie Poulain, Matthieu Mercier, Laurent Brach, Marion Martignac, Corinne Routaboul, et al.. Small microplastics as a main contributor to plastic mass balance in the North Atlantic subtropical gyre. Environmental Science and Technology, American Chemical Society, 2019, 53 (3), pp.1157-1164. �10.1021/acs.est.8b05458�. �hal-02399962�
OATAO is an open access repository that collects the work of Toulouse
researchers and makes it freely available over the web where possible
Any correspondence concerning this service should be sent
to the repository administrator:
[email protected]
This is an author’s version published in:
http://oatao.univ-toulouse.fr/23307
To cite this version:
Poulain, Marie and Mercier, Matthieu and Brach, Laurent and
Martignac, Marion and Routaboul, Corinne and Perez, Emile
and Desjean, Marie Christine and Ter Halle, Alexandra Small
microplastics as a main contributor to plastic mass balance in
the North Atlantic subtropical gyre. (2019) Environmental
Science & Technology, 53 (3). 1157-1164. ISSN 0013-936X
Official URL:
https://doi.org/10.1021/acs.est.8b05458
Small Microplastics As a Main Contributor to Plastic Mass Balance in
the North Atlantic Subtropical Gyre
Marie Poulain
,t
,:t:
Matthieu
J.
Mercier/ Laurent Brach
,*
Marion Martignac
,*
Corinne Routaboul
/
Emile Perez
,*
Marie Christine Desjean,
11
and Alexandra ter Halle
*':t:e
tlnstitut de Mécanique des Fluides de Toulouse (IMFT), Université de Toulouse, CNRS, Toulouse, France
*Laboratoire des IMRCP, Université de Toulouse, CNRS UMR 5623, Université Paul Sabatier, 118 route de Narbonne 31062 Toulouse Cedex 9 France
�nstitut de Chimie de Toulouse (ICT), Université de Toulouse, Université Paul Sabatier, 118 route de Narbonne 31062 Toulouse Cedex 9 France
11Centre National d'Études Spatiales, 18 avenue Édouard Belin, 31401 Toulouse cedex 4 France
ABSTRACT: Estimates of cumulative plastic inputs into the
oceans are e:xpressed in hundred million tons, whereas the total R = ,,fITF
mass of microplastics afloat at sea is 3 orders of magnitude
t
w
t
In couni. l.ottrge pla.<_;tki, (1-f> mm) below this. This large gap is evidence of our ignorance aboutthe fate of plastics, as well as transformations and sinks in the
oceans. One of the current challenges consists of identifying and quantifying plastic particles at the microscale, the small
Il"'
�'
·
Sphcrc Microplastic Ellip,oid �!n��"pl�!�, � (�6 ln mass Smnll plastics Large 1>laslks (251un-l mm) (1-5 mm) microplastics (SMP, 25-1000 µm). The aim of the presentstudy is to investigate SMP concentration in count and in mass at the sea surface in the North Atlantic subtropical gyre during the sea campaign Expedition ih Continent After isolation,
From plastic dcbris
SMP were characterized by micro Fourier transform infrared to models
Rise velocities 1\,ficroplo.stics corrœtcd concentrations
spectroscopy. Microplastic distribution was modeled by a
wind driven vertical mixing correction mode! taking into account individual particle properties ( dimension, shape and density). We demonstrate that SMP buoyancy is significantly decreased compared to the large microplastics (LMP, 1-5 mm) and consequently more susceptible to vertical transport. The uncorrected LMP concentration in count was between 13 000 and 174000 pieces 1an-2, and was between 5 and 170 times more abundant for SMP. With a wind driven vertical mixing correction, we estimated that SMP were 300 to 70 000 times more abundant than LMP. When discussing this in terms of weight after correction, LMP concentrations were between 50 and 1000 g 1an-2, and SMP concentrations were between 5 and 14000 g 1an-2_
• INTRODUCTION
Plastic production has had an amazing exponential growth since its industrialization in the 1950s. However, only 40 years later, we realized that we do not control plastic's end oflife and have not put forth suflicient effort to promote its recycling. In the 2010s, the annual plastic input into the ocean was estimated to be 10 million tons. 1 None of the commonly used plastics are biodegradable, and thus, they tend to accumulate once discarded in the environment.2 With solar illumination
and mechanical forcing, plastic waste is oxidized and fragmented into smaller and smaller particles, reaching the nanoscale.3 Currently, one important scientific question is how to balance the annual input into the oceans, which is one hundred of times more than the amount we are actually able to locate. This large gap is evidence of our critical Jack of knowledge about the fate of plastic in the ocean. Efforts to detect plastic particles at the micro and nanoscales are needed.4,s Published works state that small microplastics
(SMP, 25-1000 µm) are present in the natural environment6•7
and that they are genuinely more abundant than large
microplastics (LMP, 1-5 mm).8
•9 However, until now, there
has been no estimation of the weight SMP could represent at sea.
The scientific community has agreed that the character ization of SMP by visual detection and manual sorting is prone to significant errors.6•10-12 For the detection and quantification
of SMP, micro Fourier transform infrared (µ FTIR) and
micro Raman spectroscopy are promising tools that should be considered. The development ofµ FTIR and its suitability were demonstrated with spiked natural samples.13 This
concentration in count in environmental samples. However, the data are still scarce, and studies have been conducted with marine sediments,14 lagoon sediment,15 coastal waters6 and wastewater treatment plant16samples. From these studies, it is apparent that SMP outnumber LMP, but the SMP weight concentration basis was not discussed. SMP weight estimates have only been discussed on the basis of emission scenarios.17 Another specific issue discussed here is how to properly estimate the abundance of plastic particles at sea in the water column at a given location by the extrapolation of sea surface samples. The sea surface state, with turbulence induced by
wind and waves or some specific flows,18 can mix the upper
water column and transport plastic particles vertically. This effect has been rationalized by turbulent models based on the assumption of a balance between the upwardflux of particles
due to buoyancy and the downward flux due to turbu
lence.19−21 These models rely on the rise velocity of plastic, Wb, and turbulence modeling. The simplest approach consists of using a mean rise velocity of 0.01 m s−1 for all plastic
particles.19 However, laboratory measurements of Wb for
plastic debris between 0.5 and 207 mm are evidence of important variations with ratios up to a factor 40; smaller particles rising slower.22Enders et al used a sphere to model
microplastic (25 μm to 5 mm) buoyancy and demonstrated
that LMP can be mixed over a few meters, whereas SMP could be transported down to hundreds of meters at the same sea state.21Improvements to current modeling approaches are still highly necessary to better quantify concentration and mass estimates in open oceans.4,23 The present study investigates SMP and LMP composition, count and weight concentrations in the North Atlantic subtropical gyre at the sea surface. SMP
were characterized and numbered by μ FTIR. A wind driven
vertical mixing correction was developed to account for individual particle properties (density and geometry). Owing to the very dispersed geometry and density of microplastics, our modeling approach provided lower and upper bounds for the concentrations. The results with and without wind driven mixing were discussed.
■
MATERIALS AND METHODSChemicals. High density polyethylene (PE) pellets (CAS#
9002−88−4), poly(ethylene terephthalate) (PET) pellets
(CAS# 25038−59−9, density of 1.68 g mL−1), poly(vinyl
chloride) (PVC) powder (CAS# 9002−86−2, density of 1.4 g
mL−1at 25°C), poly(methyl methacrylate) (PMMA) (CAS#
90011−14−7, an average molecular weight of 120 000),
Nylon 6/6 pellets (CAS# 25038−54−4, density of 1.14 g
mL−1at 25°C) and Nylon 12 (CAS# 25038−74−8, density of
1.14 g mL−1 at 25 °C) were purchased from Sigma Aldrich
(Saint Louis, MO). Polystyrene (PS) pellets (3.5 mm) (CAS#
9003−53−6 PS), polypropylene (PP) pellets (3 mm) (CAS#
9003−07−0, melting flow index of 0.4 g per 10 min), low
density PE pellets (1 mm), nonexpanded polyurethane (PU), and foam were purchased from Goodfellow (Huntingdon, UK). Sodium dodecyl sulfate (ACS reagent, >99%) and sodium hydroxide pellets were purchased from Sigma Aldrich (Saint Louis, MO).
Microplastic Sampling and Extraction. Plastic particles were collected from the sailing vessel Guyavoile in the North Atlantic subtropical gyre in June 2015 during the French sea
campaign Expedition 7th Continent.24 LMP were collected
using a Neuston net with a rectangular frame (0.5× 0.4 m)
fitted with a 2 m long net with a standard mesh size of 300 μm.
LMP were collected from the surface layer at a depth of [0− 20] cm. Tow durations were set to 30 min, and tows were all undertaken while the vessel was traveling at a speed of 1−2.5 knots. On the boat, the content of the tows wasfiltered on 300 μm sieves. Most of the plastic particles were removed with tweezers and stored at−5 °C in glass vials. In total, 40 nets were towed: 12 outside the accumulation area and 28 within the accumulation area. The GPS locations and sea states associated with these 28 stations are supplied in theSupporting Information (SI), Table S1. SMP were collected using a Neuston net with a standard mesh size of 25μm. The net was fixed to a 0.3 × 0.1 m rectangular frame and was 3 m long. SMP were collected from the surface layer at a depth of [0−6] cm. Tow durations were set to 10 min and were all undertaken while the vessel was traveling at a speed of less than 1 knot. Indeed, the speed of the boat was strictly restricted to below 1 knot to avoid clogging the 25μm net. The net was towed from a zodiac boat, and for security reasons, it was only possible when the sea was relatively calm. Thus, only eight measure ments were performed within the accumulation area. The content of the tows was filtered through a cellulose acetate
membrane (5μm) in a closed filtration unit and immediately
stored in closed glass vials at−18 °C. Both manta nets were
equipped withflow meters from which sea concentrations in
count were calculated and expressed as numbers of particles per square kilometer.
Microplastic Isolation. The sorting and numbering of LMP were carried out classically and described elsewhere.24To calculate LMP sea surface concentrations (in count and weight), only those having at least one dimension above 1 mm were considered. For SMP isolation, the acetatefilters obtained on the boat were immersed under laboratory conditions in 80 mL ultrapure water in a closed glass bottle at ambient temperature under gentle agitation for 1 h. After removal of the filter, the biogenic matter was eliminated by the addition of 20 mL of a 10 mol L−1NaOH solution and 300μL of a 50 g L−1 sodium dodecyl sulfate solution. The solution was gently agitated for 4 h and stored for 1 week at ambient temperature. After 1 week, the solution wasfiltered through glass filters in a
closed unit (Whatman GF/F; 0.7 μm; 47 mm) and rinsed
abundantly with ultrapure water. Thefilters were then stored in closed glass Petri dishes prior to analysis. A control experiment under these conditions was performed to ensure that the plastic was not altered. (PET, PVC, PS, PE, PP, PU expanded or foam, Nylon6, Nylon12, and PMMA) were
grinded at 200 μm using a ZM 200 grinder (Retsch, Haen,
Germany). The plastic powder (300 mg) was treated with sodium hydroxide under the same conditions.
SMP Characterization byμ-FTIR. Micro FTIR spectros
copy was performed using a Thermo Fisher Scientific Nicolet
iN10 apparatus in reflection mode equipped with a liquid
nitrogen cooled MCT detector. The particle bigger than 30× 30μm visually detected by the operator under the microscope were analyzed. We cannot estimate how many particles could be missed by the operator, this is the most problem of working with an operator. All the work done those past two years by Primpke et al. are a huge improvement of the method. In the future we will work like this team. The spectra were recorded as the average of 16 scans in the spectral range of 650−4000 cm−1 at a resolution of 8 cm−1. The library was from the
Thermo Scientific software (database: Hummel Polymer
library, HR Polymer and additives, HR Polymer additives and plasticizers). Each particle was identified and analyzed
individually. The microscope aperture was adapted to each particle. If the particle was suspected to be plastic, several
measurements at different spots were undertaken to prevent
false signals due to either local impurities or the rough and irregular shapes of the particles, which could alter their spectra. The plastic particles were identified using a polymer spectral library if the match was greater than 80% (by the software OMNIC PICTA with no normalization or derivation).
Microplastic Geometrical Description. We have identi fied two families of objects: lines and pieces. Lines were less numerous than pieces (14,6% for the LMP and 6.6% for the SMP). Here, we only consider pieces, and lines were excluded from the calculation.
We measured the length (L), width (S) and mass (M) to the nearest 0.01 mg using a precise scale (Genius shatorius, Gottingen, Germany). In addition, for 415 microplastics (the sum of LMP and SMP) collected during a previous sea campaign in the North Atlantic subtropical gyre,26 we also measured the thickness (h) and the apparent surface area (Sa) using image analysis (ImageJ©). A complete description is given inSI Section S2.
Rise Velocity Measurements. Rise velocity measure ments of LMP samples collected were done in the laboratory. A cylindrical tank (diameter, 13 cm and height, 100 cm) was filled with 18 L of fresh (1.001 g cm−3) or salt water (1.025 g cm−3). A single particle was inserted at the bottom of the column using a double valve system. The particle raised in the quiescent fluid (no residual flow observed). Passing times of the particle at three marks (50, 70, and 80 cm away from the bottom) were recorded in order to calculate Wb. We verified that the particle had reached a steady velocity, and each measurement was repeated four times, leading to less than 5% of uncertainty on Wb.
■
RESULTS AND DISCUSSIONMicroplastic Characterization. LMP and SMP have been sampled at the sea surface of the North Atlantic subtropical
gyre during the cruise Expedition 7th Continent. LMP
extraction and numbering are classical procedures and have
been described previously.27 For SMP characterization, an
essentialfirst step of purification is needed to eliminate organic matter (algae, plankton) and inorganic particles (sand and silt) before detection. Very diverse purification approaches have been developed; all methods consist of several steps using density separation together with degradation of the organic matter.11,28,29Organic matter is eliminated by strong acidic21,30 or alkaline31solutions, by oxidation agents13or by the use of enzymes.32We underline that the purification step needs to be as efficient as possible to facilitate spectroscopic detection without damaging the plastic particles by breaking them down or by altering the structure of the polymer, that is, conditions should remain mild. For SMP isolation, a sodium hydroxide treatment was chosen. As a control, 10 different polymers were
ground (500 μm) and tested with the sodium hydroxide
treatment. Recoveries were higher than 95% (±5%). Under the microscope, the treated polymer did not appear to be altered (no yellowing), and theμ FTIR spectra of the treated plastics
were not modified. Procedural blank experiments have been
conducted: no plastic particles or cloth fibers have been
detected in these control experiments. After purification and filtration, the particles deposited on the filter are analyzed by microspectroscopy. Both FTIR and Raman provide vibrational fingerprint spectra with information about the shape and
dimension of the particles. The techniques present a spatial resolution in the micrometric range and both methods have advantages and disadvantages for the detection of SMP. Their use in combination has been proposed by Kaeppler et al.33The
detection and characterization of SMP by μ FTIR can be
envisioned three ways. A first approach consists of a visual presorting; in this case, the attenuate total reflection (ATR) crystal is focused on every single particle.6,11,21,34The visual presorting and focusing is very time consuming. In a second
approach, the automated image analysis of the filter is
proposed. This consists of the detection and localization of the particles prior to characterization.25The third option is a spectroscopic mapping of the whole surface of thefilter.14,15In this later case, the bands selected to detect the plastic have to be chosen among polymer specific regions that are insensitive to variations in the particle shape or state of oxidation.10 To control the amount of data generated, the region for the IR scanning is also restricted to some specific polymer bands, and the number of scans per measurement, thus the resolution of the measurements, is lower. All these options affect the signal/ noise ratio, and these adjustments are detrimental to the reliability of the measure. Primpke et al. developed software to analyze and interpret the very voluminous data generated by the mapping.25
Here, we opted for theμ FTIR characterization with a visual presorting and a systematic crystal focus on every single particle. The spectra were much better compared to the automated method. We decided to analyze the whole surface of thefilter because it presented very important heterogeneity. In contrast, this option utilized an operator for a long time and thus was accompanied by an operator bias that was difficult to estimate. Lines with diameters a few hundreds of micron and a few millimeter big were present in the LMP samples. Line probably comes from the degradation offishing lines or gears. Textilefibers present much smaller diameters, tens of microns,
they belong to the SMP category. But becausefibers do not
depositflat on the surface of the filter (a part of the fiber is out of focus of the IRbeam) they are hardly detectable and their infrared spectra does not allow a correct correspondence with
the library.35 We presume that this method underestimated
SMP abundance, and we acknowledge that this method needs further methodological improvement to make the analysis more reliable.
LMP (960 particles isolated in total) were made of 90% PE and 10% PP; this is in agreement with reported data from the open ocean.26 SMP (1 100 particles isolated in total) were made of a greater diversity of polymers, as has already
reported.21 SMP were made of PE (70%), PP (17%), PVC
(7%), PS (1%), PET (1%) and to a lesser extent polyurethane,
poly aryl ether sulfone and phenoxy resins (Figure 1).
However, polyolefins were still predominant. SMP repartition among polymer types presented variation along the sampling locations (SI Table S1). For example, at station 12, 98% of the SMP were made of PE, while at station 20, only 41% were made of PE and 51% of PP. A contribution of 13% of PVC particles was identified at station 24. Finally, for all sampling points, PS and PET proportions never exceeded 5%.
Modeling Approach and Validation. LMP concen trations at the sea surface are usually corrected using the modeling approach introduced by Kukulka et al.19This model is based on the number of microplastics collected at the surface (Ntow), the rise velocity (Wb) and the surface forcing (wind and waves), which is based on the friction velocity of water
slower than the sphere with Req= Leq. Thus, to encompass the dynamics of microplastics, we attributed to the ellipsoid density the upper limit (1.005 g cm−3), and to the sphere density, the lower limit (0.900 g cm−3). We note that Meand Ms are the corresponding masses for the ellipsoid and sphere geometries. The drag coefficient models and corresponding resolution ofeq 2for these objects are presented inSI Section S4.
As afirst validation of the model, we compared the mass of the LMP to the calculated mass of the sphere and the ellipsoid. The majority of LMP mass (85%) fell within the delimited boundaries (Figure 2A). Since we could not weigh the SMP, we assumed that the two geometries described the SMP well, and we used the average mass, Mm= (Me+ Ms)/2, to provide a mass estimate for the direct observations. As a second validation, we compared the calculated rise velocity of the ellipsoid, Wbe, and the sphere, W
b
s, to the rise velocity of 35 arbitrarily selected LMP. Their rise velocities were measured in laboratory conditions with a system that avoided the generation of any turbulence during the introduction of the
particle into the water column (Figure 2B). The majority
(97%) had a rise velocity between Wbeand Wbs. Only one object was out of bounds, it turned out to have an aspect ratio larger than 10, which is consistent with a smaller rising velocity. We calculated Wbfor a wide range of microplastic sizes. However,
our calculations of Wb were in the same range as those
measured previously (>0.5 mm).19,22 It was not possible to measure the rise velocity of SMP because they were too small
to be handled. Nonetheless, eq 2 is also valid in the
micrometric range. For SMP, the calculated values for Wb
are between 3× 10⁻³and 10−4m s−1. These are 1−2 orders of
magnitude below the mean value for LMP. Thisfinding well
illustrates the importance of integrating the variations of Wb into the turbulence model.
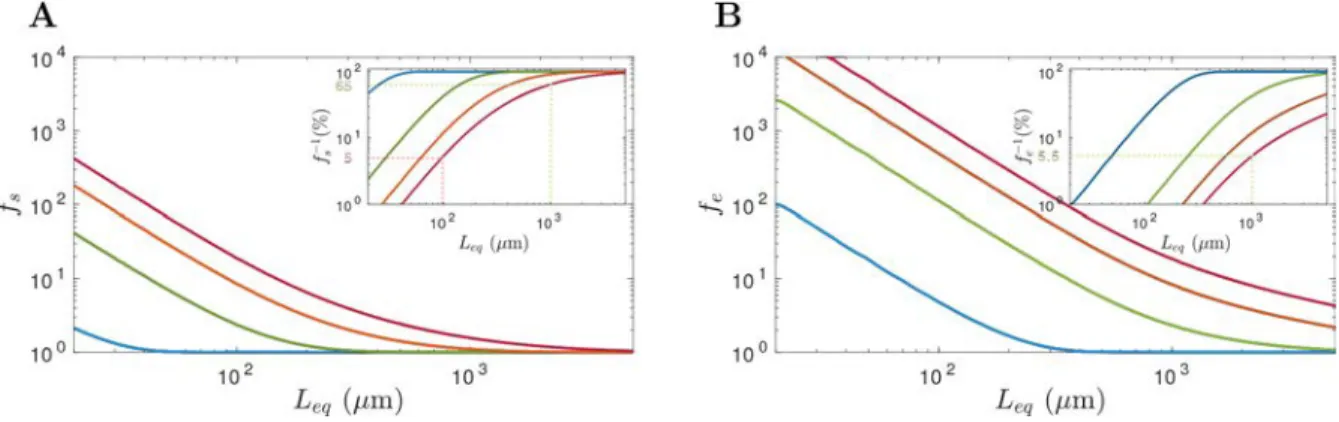
Using eq 1, we define fe and fs as the correction factors associated with the ellipsoid and the sphere, respectively (Figure 3A and B). As smaller particles present lower buoyancy at a given sea state, their correction factors are higher. For example, at Beaufort 1, 100% of the plastic particles with Leq> 1 mm are within thefirst 20 cm (fe= fs= 1), while when Leq= 100μm, only between 20 and 100% are within the first 20 cm ( fe = 5 and fs = 1). The corrections proposed by previous studies for LMP fell within the interval proposed here (data not shown).19,22It must be noted that this difference between small and large microplastic distributions in the water column increases with the Beaufort. For instance, at Beaufort 5,
between 5.5 and 65% of plastic particles with Leq= 1 mm are located within the surface layer, but only between 1 and 5% of plastic particles with Leq= 100μm are (inset plotsFigures 3A and B). In these conditions, the corrections could lead to major error estimates, which is why we excluded stations at Beaufort 5 from the following discussion (Tables 1and2).
Our modeling approach allows us to relate count and weight concentrations evaluations. For each sample, an estimated mass can be provided, and for the sake of simplicity, we chose the average mass of the two geometries, Mm. For a given Leq, the corrected concentrations in weight are obtained by multiplying Mmwith the correction factors feand fs(Table 2). Measured Count and Weight Concentrations. Aver aged LMP and SMP concentrations in count without correction were 50 000 particles km−2and 1 630 000 particles km−2, respectively. LMP concentrations were between 13 000 and 174 000 particles km−2, while SMP concentrations were between 630 000 and 6 000 000 particles km−2(Table 1). The highest concentrations for both LMP and SMP were measured for station 24 at low wind speed (Beaufort 2). LMP concentrations in count were typical of the ones encountered in subtropical gyres.43−46 Concerning SMP concentrations, there are no data for comparison. The global trend over these 8 sampling stations was that there were between 5 and 171 times
Figure 3.Correction factors estimated for (A) the sphere model ( fs) and (B) the ellipsoid model ( fe) calculated for a net immersion depth of 20
cm. Each color corresponds to a Beaufort (blue: Beaufort 1−2, green: Beaufort 3, orange: Beaufort 4, and magenta: Beaufort 5). Inset plots correspond to the theoretical fraction of surface captured plastic particles ( f−1) in percent at [0−20] cm.
Table 1. Concentration in Count (×105Particles km−2) for LMP (1 5 mm) and SMP (25−1000 μm) at Eight Sampling Stations (detailed information available inSI Table S1),
Lines and Fibers Excludeda
1 5 mm 25 1000μm # Beaufort Ntow Ncorrs Necorr Ntow Ncorrs Ncorre
6 5 0.14 24 8 5 0.18 12 11 3 0.13 0.13 0.27 7.9 870 41 000 12 5 0.14 11 17 3 0.38 0.40 1.13 6.3 730 34 000 20 3 0.98 0.98 3.20 5.0 600 24 000 24 2 1.74 1.74 1.88 60 750 36 000 27 3 0.34 0.34 0.66 3.8 110 45 000 mean 0.50 0.72 1.43 16.3 610 36 000 aN
tow is the uncorrected concentration in count, and Ncorri is the
corrected concentration in count, where superscript i refers to the model used for correction (s for the sphere model and e for the ellipsoid model).
(5) Gigault, J.; ter Halle, A.; Baudrimont, M.; Pascal, P. Y.; Gauffre, F.; Phi, T. L.; El Hadri, H.; Grassl, B.; Reynaud, S. What is a nanoplastic ? Environ. Pollut. 2018, 235, 1030−1034.
(6) Song, Y. K.; Hong, S. H.; Jang, M.; Han, G. M.; Rani, M.; Lee, J.; Shim, W. J. A comparison of microscopic and spectroscopic identification methods for analysis of microplastics in environmental samples. Mar. Pollut. Bull. 2015, 93, 202−209.
(7) Bergmann, M.; Wirzberger, V.; Krumpen, T.; Lorenz, C.; Primpke, S.; Tekman, M. B.; Gerdts, G. High Quantities of Microplastic in Arctic Deep Sea Sediments from the HAUSGARTEN Observatory. Environ. Sci. Technol. 2017, 51, 11000−11010 PMID: 28816440 .
(8) Cauwenberghe, L. V.; Devriese, L.; Galgani, F.; Robbens, J.; Janssen, C. R. Microplastics in sediments: A review of techniques, occurrence and effects. Mar. Environ. Res. 2015, 111, 5−17.
(9) Hanvey, J. S.; Lewis, P. J.; Lavers, J. L.; Crosbie, N. D.; Pozo, K.; Clarke, B. O. A review of analytical techniques for quantifying microplastics in sediments. Anal. Methods 2017, 9, 1369−1383.
(10) Harrison, J. P.; Ojeda, J. J.; Romero Gonzalez, M. E. The applicability of reflectance micro Fourier transform infrared spectros copy for the detection of synthetic microplastics in marine sediments. Sci. Total Environ. 2012, 416, 455−463.
(11) Imhof, H. K.; Schmid, J.; Niessner, R.; Ivleva, N. P.; Laforsch, C. A novel, highly efficient method for the separation and quantification of plastic particles in sediments of aquatic environ ments. Limnol. Oceanogr.: Methods 2012, 10, 524−537.
(12) Lenz, R.; Enders, K.; Stedmon, C. A.; Mackenzie, D. M. A.; Nielsen, T. G. A critical assessment of visual identification of marine microplastic using Raman spectroscopy for analysis improvement. Mar. Pollut. Bull. 2015, 100, 82−91.
(13) Tagg, A. S.; Sapp, M.; Harrison, J. P.; Ojeda, J. J. Identification and Quantification of Microplastics in Wastewater Using Focal Plane Array Based Reflectance Micro FT IR Imaging. Anal. Chem. 2015, 87, 6032−6040.
(14) Loeder, M. G. J.; Kuczera, M.; Mintenig, S.; Lorenz, C.; Gerdts, G. Focal plane array detector based micro Fourier transform infrared imaging for the analysis of microplastics in environmental samples. Environ.Chem. 2015, 12, 563−581.
(15) Vianello, A.; Boldrin, A.; Guerriero, P.; Moschino, V.; Rella, R.; Sturaro, A.; Da Ros, L. Microplastic particles in sediments of Lagoon of Venice, Italy: First observations on occurrence, spatial patterns and identification. Estuarine, Coastal Shelf Sci. 2013, 130, 54−61.
(16) Mintenig, S. M.; Int Veen, I.; Loeder, M. G. J.; Primpke, S.; Gerdts, G. Identification of microplastic in effluents of waste water treatment plants using focal plane array based micro Fourier trans form infrared imaging. Water Res. 2017, 108, 365−372.
(17) van Wezel, A.; Caris, I.; Kools, S. A. E. Release of primary microplastics from consumer products to wastewater in the Netherlands. Environ. Toxicol. Chem. 2016, 35, 1627−1631.
(18) Kukulka, T.; Law, K. L.; Proskurowski, G. Evidence for the Influence of Surface Heat Fluxes on Turbulent Mixing of Microplastic Marine Debris. J. Geophys. Res. Oceans 2016, 46, 809−815.
(19) Kukulka, T.; Proskurowski, G.; Meyer, D. W.; Law, K. L.; et al. The effect of wind mixing on the vertical distribution of buoyant plastic debris. Geophys. Res. Lett. 2012, 39, 1−6.
(20) Kukulka, T.; Brunner, K. Passive buoyant tracers in the ocean surface boundary layer: 1. Influence of equilibrium wind waves on vertical distributions. J. Geophys. Res. Oceans 2015, 120, 3837−3858. (21) Enders, K.; Lenz, R.; Stedmon, C. A.; Nielsen, T. G. Abundance, size and polymer composition of marine microplastics ≥ 10 μm in the Atlantic Ocean and their modelled vertical distribution. Mar. Pollut. Bull. 2015, 100, 70−81.
(22) Reisser, J.; Slat, B.; Noble, K.; Du Plessis, K.; Epp, M.; Proietti, M.; De Sonneville, J.; Becker, T.; Pattiaratchi, C. The vertical distribution of buoyant plastics at sea: An observational study in the North Atlantic Gyre. Biogeosciences 2015, 12, 1249−1256.
(23) Law, K. L. Plastics in the Marine Environment. Annu. Rev. Mar. Sci. 2017, 9, 205−229 PMID: 27620829 .
(24) Ter Halle, A.; Jeanneau, L.; Martignac, M.; Jarde, E.; Pedrono, B.; Brach, L.; Gigault, J. Nanoplastic in the North Atlantic Subtropical Gyre. Environ. Sci. Technol. 2017, 51, 13689−13697.
(25) Primpke, S.; Lorenz, C.; Rascher Friesenhausen, R.; Gerdts, G. An automated approach for microplastics analysis using focal plane array (FPA) FTIR microscopy and image analysis. Anal. Methods 2017, 9, 1499−1511.
(26) Ter Halle, A.; Ladirat, L.; Gendre, X.; Goudouneche, D.; Pusineri, C.; Routaboul, C.; Tenailleau, C.; Duployer, B.; Perez, E. Understanding the Fragmentation Pattern of Marine Plastic Debris. Environ. Sci. Technol. 2016, 50, 5668−5675.
(27) Brach, L.; Deixonne, P.; Bernard, M. F.; Durand, E.; Desjean, M. C.; Perez, E.; van Sebille, E.; ter Halle, A. Anticyclonic eddies increase accumulation of microplastic in the North Atlantic subtropical gyre. Mar. Pollut. Bull. 2018, 126, 191−196.
(28) Claessens, M.; De Meester, S.; Van Landuyt, L.; De Clerck, K.; Janssen, C. R. Occurrence and distribution of microplastics in marine sediments along the Belgian coast. Mar. Pollut. Bull. 2011, 62, 2199− 2204.
(29) Nuelle, M. T.; Dekiff, J. H.; Remy, D.; Fries, E. A new analytical approach for monitoring microplastics in marine sediments. Environ. Pollut. 2014, 184, 161−169.
(30) Imhof, H. K.; Laforsch, C.; Wiesheu, A. C.; Schmid, J.; Anger, P. M.; Niessner, R.; Ivleva, N. P. Pigments and plastic in limnetic ecosystems: A qualitative and quantitative study on microparticles of different size classes. Water Res. 2016, 98, 64−74.
(31) Foekema, E. M.; De Gruijter, C.; Mergia, M. T.; van Franeker, J. A.; Murk, A. J.; Koelmans, A. A. Plastic in North Sea Fish. Environ. Sci. Technol. 2013, 47, 8818−8824.
(32) Cole, M.; Webb, H.; Lindeque, P. K.; Fileman, E. S.; Halsband, C.; Galloway, T. S. Isolation of microplastics in biota rich seawater samples and marine organisms. Sci. Rep. 2015, 4, 4528.
(33) Kaeppler, A.; Fischer, D.; Oberbeckmann, S.; Schernewski, G.; Labrenz, M.; Eichhorn, K. J.; Voit, B. Analysis of environmental microplastics by vibrational microspectroscopy: FTIR, Raman or both? Anal. Bioanal. Chem. 2016, 408, 8377−8391.
(34) Cauwenberghe, L. V.; Vanreusel, A.; Mees, J.; Janssen, C. R. Microplastic pollution in deep sea sediments. Environ. Pollut. 2013, 182, 495−499.
(35) Peeken, I.; Primpke, S.; Beyer, B.; Guetermann, J.; Katlein, C.; Krumpen, T.; Bergmann, M.; Hehemann, L.; Gerdts, G. Arctic sea ice is an important temporal sink and means of transport for microplastic. Nat. Commun. 2018, 9, 1505.
(36) Smith, S. D. Coefficients for sea surface wind stress, heat flux, and wind profiles as a function of wind speed and temperature. J. Geophys. Res. 1988, 93, 15467−15472.
(37) Thorpe, S.; Osborn, T. R.; Farmer, D. M.; Vagle, S. Bubble Clouds and Langmuir Circulation: Observations and Models. J. Phys. Oceanogr. 2003, 33, 2013−2031.
(38) Smith, S. D. Wind Stress and Heat Flux over the Ocean in Gale Force Winds. J. Phys. Oceanogr. 1980, 10, 709−726.
(39) Fan, Y.; Hwang, P. Kinetic energy flux budget across air sea interface. Ocean Model. 2017, 120, 27−40.
(40) Clip, R.; Grace, J. R.; Weber, M. E. Bubbles, Drops, and Particles; Academic Press: United Kingdom, 1978.
(41) Li, L.; Manikantan, H.; Saintillan, D.; Spagnolie, S. E. The sedimentation of flexible filaments. J. Fluid Mech. 2013, 735, 705− 736.
(42) Morét Ferguson, S.; Law, K. L.; Proskurowski, G.; Murphy, E. K.; Peacock, E. E.; Reddy, C. M. The size, mass, and composition of plastic debris in the western North Atlantic Ocean. Mar. Pollut. Bull. 2010, 60, 1873−1878.
(43) Law, K. L.; Morét Ferguson, S. E.; Maximenko, N. A.; Proskurowski, G.; Peacock, E. E.; Hafner, J.; Reddy, C. M. Plastic Accumulation in the North Atlantic Subtropical Gyre. Science 2010, 329, 1185−1188.
(44) Law, K. L.; Morét Ferguson, S. E.; Goodwin, D. S.; Zettler, E. R.; Deforce, E.; Kukulka, T.; Proskurowski, G. Distribution of surface
plastic debris in the eastern pacific ocean from an 11 year data set. Environ. Sci. Technol. 2014, 48, 4732−4738.
(45) Cozar, A.; Echevarria, F.; Gonzalez Gordillo, J. I.; Irigoien, X.; Ubeda, B.; Hernandez Leon, S.; Palma, A. T.; Navarro, S.; Garcia de Lomas, J.; Ruiz, A.; Fernandez de Puelles, M. L.; Duarte, C. M. Plastic debris in the open ocean. Proc. Natl. Acad. Sci. U. S. A. 2014, 111, 10239−10244.
(46) Eriksen, M.; Lebreton, L. C.; Carson, H. S.; Thiel, M.; Moore, C. J.; Borerro, J. C.; Galgani, F.; Ryan, P. G.; Reisser, J. Plastic Pollution in the World’s Oceans: More than 5 Trillion Plastic Pieces Weighing over 250,000 Tons Afloat at Sea. PLoS One 2014, 9, 1−15. (47) Kanhai, L. D. K.; Officer, R.; Lyashevska, O.; Thompson, R. C.; O’Connor, I. Microplastic abundance, distribution and composition along a latitudinal gradient in the Atlantic Ocean. Mar. Pollut. Bull. 2017, 115, 307−314.
(48) Michallet, H.; Mory, M. Modelling of sediment suspensions in oscillating grid turbulence. Fluid Dyn. Res. 2004, 35, 87−106.
(49) Huppert, H. E.; Turner, J. S.; Hallworth, M. A. Sedimentation and entrainment in dense layers of suspended particles by an oscillating grid. J. Fluid Mech. 1995, 289, 263−293.