HAL Id: hal-01097877
https://hal.archives-ouvertes.fr/hal-01097877
Submitted on 10 Jan 2015HAL is a multi-disciplinary open access archive for the deposit and dissemination of sci-entific research documents, whether they are pub-lished or not. The documents may come from teaching and research institutions in France or abroad, or from public or private research centers.
L’archive ouverte pluridisciplinaire HAL, est destinée au dépôt et à la diffusion de documents scientifiques de niveau recherche, publiés ou non, émanant des établissements d’enseignement et de recherche français ou étrangers, des laboratoires publics ou privés.
How does the resuspension of the biofilm alter the
functioning of the benthos–pelagos coupled food web of
a bare mudflat in Marennes-Oléron Bay (NE Atlantic)?
Blanche Saint-Béat, Christine Dupuy, Hélène Agogué, Alexandre Carpentier,
Julien Chalumeau, Serena Como, Valérie David, Margot de Crignis,
Jean-Claude Duchêne, Camille Fontaine, et al.
To cite this version:
Blanche Saint-Béat, Christine Dupuy, Hélène Agogué, Alexandre Carpentier, Julien Chalumeau, et al.. How does the resuspension of the biofilm alter the functioning of the benthos–pelagos coupled food web of a bare mudflat in Marennes-Oléron Bay (NE Atlantic)?. Journal of Sea Research (JSR), Elsevier, 2014, 92, pp.144-157. �10.1016/j.seares.2014.02.003�. �hal-01097877�
1
How does the resuspension of the biofilm alter the functioning of the
1benthos-pelagos coupled food web of a bare mudflat in Marennes-Oléron
2Bay (NE Atlantic)?
34
Blanche Saint-Béata*, Christine Dupuya, Hélène Agoguéa, Alexandre Carpentierb, Julien
5
Chalumeaua, Serena Comoa, Valérie Davidc, Margot De Crignisa, Jean-Claude Duchênec,
6
Camille Fontainea, Eric Feunteunb, Katell Guiziend, Hans Hartmanna, Johann Lavauda,
7
Sébastien Lefebvree, Christel Lefrancoisa, Clarisse Malletf, Hélène Montaniéa, Jean-Luc
8
Mougetg, Francis Orvainh, Pascaline Orya, Pierre-Yves Pascali, Gilles Radenaca, Pierre
9
Richarda, Alain Vézinaj, Nathalie Niquila,h.
10 11
a
Université de la Rochelle-CNRS, UMR 7266, Littoral Environnement et Sociétés (LIENSs),
12
2 rue Olympe de Gouges 17000 La Rochelle cedex, France
13
b
Station Maritime de Dinard, Museum National d'Histoire Naturelle,17 avenue George V,
14
BP28, 35801 Dinard, France
15
c
UMR 5805 EPOCU, Station Marine d'Arcachon, Université Bordeaux 1, 2 Rue du
16
Professeur Jolyet, 33120 Arcachon cedex, France
17
d
Laboratoire d‟Océanographie Biologique de Banyuls, rue du Fontaulé, BP 44, 66651
18
Banyuls sur mer cedex, France
19
e
Université de Lille 1/Station Marine de Wimereux, UMR CNRS 8187, Laboratoire
20
d‟Océanographie et de Géoscience (LOG), 28 avenue Foch, 62930 Wimereux, France
2
f
CNRS-Université de Clermont-Ferrand II, UMR 6023, Laboratoire Microorganismes:
22
Génome et Environnement, 24 avenue des Landais, 63177 Aubière Cedex, France
23
g
Université du Maine, EA 2663 « Ecophysiologie Marine Intégrée » Laboratoire de
24
Physiologie et Biochimie Végétales, avenue Olivier Messiaen, 72085 Le Mans cedex 9,
25
France
26
h
Université de Caen Basse-Normandie, FRE3484 BioMEA CNRS, Esplanade de la Paix,
27
14032 Caen cedex, France
28
i
Université des Antilles et de la Guyane, UMR 7138 SAE, Pointe-à-Pitre, Guadeloupe
29
j
Bedford Institute of Oceanography, 1 Challenger Drive, P.O. Box 1006,
30
Dartmouth, NS, Canada, B2Y 4A2
31 32
*
Corresponding author at Université de la Rochelle-CNRS, UMR 7266, Littoral
33
Environnement et Sociétés (LIENSs), 2 rue Olympe de Gouges 17000 La Rochelle cedex,
34
France
35
tel: + 33 5 46 45 83 14
36
e-mail address :blanche.saint-beat@univ-lr.fr
37 38
3
Abstract
39
Intertidal mudflats are ecosystems submitted to natural hydrodynamical forcings during each
40
tide. When the offshore water flows at high tide, a proportion of the biofilm produced at low
41
tide can be resuspended in the water column and interact with the pelagic food web. As a
42
consequence, the resuspension creates a link between the benthos and the pelagos, modifying
43
their properties and the stability of the meta-ecosystem they form together. The aim of this
44
study is to describe the consequences of the microbial biofilm resuspension on the pelagic
45
food web, and to investigate the question of the stability of the benthos-pelagos coupling
46
resulting from the biofilm resuspension. Two food webs were considered, corresponding to
47
different hydrodynamical conditions in summer condition: one allowing the biofilm massive
48
resuspension, and one without resuspension, but with particle sedimentation. The
Monte-49
Carlo Markov Chain Linear Modelling was used to estimate the unknown flows of the food
50
web. The comparison of the Ecological Network Analysis indices for the two food webs
51
allowed defining their respective differences of structure and functioning. The results showed
52
that the massive resuspension of the microbial biofilm stimulates pelagic primary production
53
and microbial food web via a higher bacterivory. The higher activity of the whole system
54
coupled with both a drop in the specialization of the trophic pathways and a low cycling
55
activity demonstrated that when massive resuspension occurs, the system is disturbed. In
56
contrast, when sedimentation occurs, the food webs show functioning features pointing out to
57
a higher stability of the whole system.
58
59
Keywords: intertidal mudflat, biofilm resuspension, stability, meta-ecosystem
60 61 62
4
1. Introduction
63
The structure and the functioning of food webs affect the emergent properties and thus the
64
stability of the ecosystem. As a consequence, describing the emergent properties of the
65
ecosystem is a prerequisite for establishing their stability. The literature on the subject is
66
diverse and can lead to controversial interpretations and conclusions. However, some trends
67
can be observed such as equilibrium between two extremes that allows the ecosystem to act
68
like a buffer to external perturbations. For instance, the coexistence of weak and strong
69
interactions is assumed to bring stability to the ecosystem (McCann et al., 1998), or the
70
asymmetry in the ecosystem ensures a higher stability (Rooney et al., 2006), or an ecosystem
71
that presents a balance between Ascendency and redundancy is supposed to be more stable
72
(Ulanowicz, 2003). Moreover, Levin (1999) proposed that a stable ecosystem pattern is
73
composed of subsystems strongly intraconnected but weakly interconnected. At larger scale,
74
this theory is transposable to the concept of the meta-ecosystem defined by Loreau et al.
75
(2003) as a set of ecosystems connected by spatial flows. A set of ecosystems strongly
76
intraconnected weakly interconnected thus form a stable meta-ecosystem. In this study, we
77
propose to consider the benthos and the pelagos as systems connected by spatial flows at high
78
tide to form a stable meta-system. We have used this concept in order to describe and to
79
understand the effects of the benthos-pelagos coupling on the properties of the food webs and
80
its consequences on the stability of the Brouage mudflat meta-system.
81
As bare intertidal mudflat, Brouage mudflat, is characterized by the development of a
82
microbial biofilm at the surface of the sediments at diurnal low tide. This biofilm is usually
83
mainly composed of brown micro-algae (diatoms) which constitute the microphytobenthos
84
(Cariou-Le Gall and Blanchard, 1995) and prokaryotes, all of them linked by a matrix of
85
extracellular polymeric substances (EPS) (Decho, 2000). The production of the biofilm is
86
integrated to the benthic food web via the deposit feeders, especially Peringia ulvae (Haubois
5
et al., 2005; Pascal et al., 2008a; Pascal et al., 2009), via the facultative suspension feeders
88
and via the meiofauna (Pascal et al., 2009; Pascal et al., 2008b; Pascal et al., 2008c). The
89
meio- and macrofauna are not only involved in the regulation of the microphytobenthos
90
biomass via the grazing, but also via the bioturbation and the biostabilisation of the sediment
91
whose effects are coupled with physical factors (tides and swell) (Blanchard et al., 2001).
92
When the tidal flow arises, the microphytobenthos biomass decreases at the surface of the
93
sediments (Guarini et al., 2000) for two reasons: i) the downward „migration‟ of motile
94
diatoms into the sediments (Consalvey et al., 2004; Guarini et al., 2000; Herlory et al., 2004;
95
Ni Longphuirt et al., 2009) and ii) the resuspension of a part of the diatom stock into the
96
water column. The resuspension of the microphytobenthic biofilm is controlled by a complex
97
interaction between physical and biological forcing. The physical resuspension of the
98
microphytobenthos depends on the bed shear stress which is induced by the tidal current
99
and/or the wind-waves (Blanchard et al., 2002; De Jonge and Van Beuselom, 1992). The
100
erodability of the sediment is strongly variable in space and in time (Tolhurst et al., 2006) and
101
depends on biological factor modifying sediment properties such as macrofauna activities and
102
microbial biofilm setting up (Herman et al., 2001; Orvain et al., 2004). The
103
microphytobenthos resuspension also depends on biological factors such as the ageing of the
104
biofilm (Orvain et al., 2004) and the content of exopolysaccharids (EPS) (Orvain et al.,
105
present issue). When the microphytobenthic biofilm is in its exponential growth phase, it
106
stabilizes the sediments and counteracts the bioturbation due to macrofauna which favors its
107
resuspension (Orvain et al., 2004). In contrast, when the biofilm reaches its senescent phase,
108
the roughness of the biofilm as well as bacterial biofilm degradation are enhanced and the mat
109
is more easily resuspended (Orvain et al., 2004). The microphytobenthic diatom that are
110
resuspended in the water column are integrated to the pelagic food web and can be ingested
111
by suspension feeders, in the case of the Brouage mudflat especially by Crassostrea gigas, a
6
cultivated species (Riera and Richard, 1996) and Cerastoderma edule (Sauriau and Kang,
113
2000).
114
In this study new in situ observations and experimentations were taken into account,
115
especially on the resuspension of the biofilm (Orvain et al., present issue) and the
116
consequences on the pelagic food web are evaluated by using a model describing trophic
117
pathways. Erosion experiments allowed to determine the critical shear velocity necessary
118
regarding the resuspension of benthic micro-organisms and resuspension rates (Dupuy et al.,
119
present issue) . The Lagrangian and Eulerian field surveys followed the future of the
120
resuspended particles in the water column, respectively following the water mass or at a fixed
121
point (Guizien et al., 2013). Moreover grazing experiments and viral lysis experiments
122
(Montanié et al., present issue) were performed in order to determine the effect of
123
resuspension of benthic organisms on the pelagic food web sensu largo (i.e. including virus).
124
These refinements were incorporated in the framework of a trophic-flow model to better
125
unravel the impact of the biofilm resuspension on the food web functioning by deciphering
126
the contribution of each flow in the contribution in the functioning during high-tide phase. At
127
high tide, the rise of the tide and the chemical/physical/biological processes associated with
128
the increase of the water level on the Brouage mudflat create spatial flows linking benthic and
129
pelagic parts. Consequently, it can be considered as a „meta-ecosystem‟ defined by Loreau et
130
al., (2003) as a set of ecosystems which are linked by spatial biotic and/or abiotic flows across
131
the ecosystem boundaries. We especially focused on one question: How does the resuspension
132
of the microbial biofilm at high tide modifies the stability of ecosystem in respect to the
meta-133
ecosystem pattern? We explored this question by comparing the network organization of two
134
distinct food web models representing 2 scenarii of a summer situation. In the first model
135
scenario, the hydrodynamic conditions were extreme and sufficient to induce the resuspension
136
of the microphytobenthos (physical mass erosion, when bed shear stress BSS > 3 cm.s-1 on
7
Brouage mudflat). In this case the velocity of current stays superior to the critical sinking
138
velocity, thus no sedimentation is possible. While in the second case the physical forcing was
139
too weak to induce any resuspension, only limited and extremely low erosion of chla
140
(biological erosion when BSS < 3 cm.s-1) induced by the bioturbation of the macrofauna can
141
be observed (Orvain et al., present issue). Moreover the settling of pelagic particles (organic
142
or not) could occur and the sinking velocity enhanced by the pelletisation (Orvain et al.,
143
present issue). The missing flows of the food web (i.e. flows which were not measured in situ)
144
were estimated by the Monte Carlo Markov Chain Linear Inverse Modelling (MCMC-LIM)
145
(Van den Meersche et al., 2009). This mathematical method explores a solution space defined
146
by constraints issued from in situ measurement and values issued from the literature. All
147
solutions proposed by the MCMC-LIM were used to calculate several ecological network
148
analysis (ENA) indices, describing the emergent properties of the ecosystem.
149 150
2. Material and Methods
151
2.1. The study area
152
The Brouage intertidal mudflat is located at the French Atlantic coast in the bay of
Marennes-153
Oléron (figure 1). The bay covers 150 km² and the Brouage mudflat, at the eastern part of the
154
bay, represents 68 km² at low tide. The averaged bottom slope is relatively flat (1:1000) and
155
the tidal area is large (up to 4 km). The sediment consists of silt and clay particles (95% <63
156
µm) (Pascal et al., 2009). The current speeds in the bay range from 0.2 to 0.6 m.s-1 and the
157
bed shear stress from 1.5 to 4 Pa (Bassoullet et al., 2000; Le Hir et al., 2000). The zone of
158
interest is located in the middle of the Brouage mudflat and is characterized by a typical ridge
159
and runnel bedform (Gouleau et al., 2000).
160 161
2.2. Inverse modelling
8
Two summer food web models were performed: the first one simulated a high-tide situation
163
with massive suspension of micro-organisms in the water column (resuspension model), and
164
the second one also at high tide, where the physical forcing was not sufficient to induce
165
resuspension (sedimentation model). As a consequence, an insignificant quantity of particles
166
is suspended via biological factors as macrofauna bioturbation and it counterparts by a strong
167
sedimentation of organic matter.
168
The inverse modelling can be divided into 3 steps: (i) determine the species that compose the
169
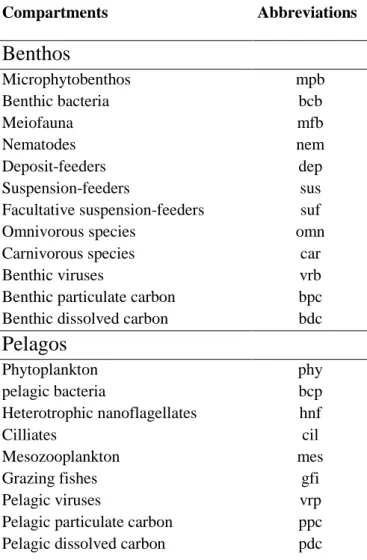
food web, and all possible flows between them. Twenty-one compartments were listed (Table
170
1) linked by 115 or 118 flows for the models with and without resuspension, respectively. (ii)
171
determine the mass balance of each compartment and constrains flow values by in situ
172
measurements. (iii)limite possible values of flows by biological constraints.
173 174
2.2.1. Considered compartments and flows
175
2.2.1.1. Resuspension and sedimentation
176
A portable erodimeter (Guizien et al., 2012) was used to estimate the erosion shear stress of in
177
situ cohesive sediments. An increased shear stress (by small steps, each timed to last about 10
178
minutes) was applied to the mud surface and the suspension of micro-organisms inhabiting in
179
the sediment was monitored by changes in water column micro-organisms concentration.
180
From these experiments, it was defined that resuspension of the microorganisms and diatoms
181
took place when the shear bed velocity was higher or equal to 3 cm.s-1. Sedimentation could
182
not occur at higher current velocity.
183
Sedimentation was only considered in the model without resuspension, because the lower
184
current velocity (< 3 cm.s-1) allowed particles to settle down on the bottom during the slack
185
water. The sedimentation rate was estimated from the formula D=Ws*C where D is expressed
186
in mgC.m-².h-1, C is the concentration of particles in the water column (mgC.m-3) and Ws the
9
sinking velocity of particles (m.h-1) (Krone, 1962). Concentration of both pelagic bacteria and
188
chlorophyll a were measured in situ. The minimal limit for the concentration of the particulate
189
carbon corresponded to the pelagic particulate carbon produced during high tide. For defining
190
its maximal limit we considered that the import of carbon into the water column was equal to
191
the amount of the benthic particulate carbon resuspended in the water column and not
192
consumed. Consequently, it was assumed that the particulate carbon present in the water
193
column at high tide, when resuspension occurred was likely to be found in a similar quantity
194 at high tide n+1. 195 196 2.2.1.2. The microphytobenthos 197
Primary production of the microphytobenthos is linked to the biomass of diatoms present in
198
the biofilm and to light conditions (Macintyre et al., 1996). During immersion, the turbidity of
199
the overlying water, stopping the penetration of light (Alpine and Cloern, 1988) inhibits
200
benthic primary production (Denis and Desreumaux, 2009; Migné et al., 2009). Moreover,
201
just before the flood return, the diatoms move down into the sediment (Herlory et al., 2004;
202
Round and Palmer, 1966). In our models, no microphytobenthic production was considered.
203
The only input to the microphytobenthos compartment is thus an import of carbon which
204
comes from the production of the previous diurnal low tide by the microphytobenthos,
205
andwhich was not consumed during low tide. The import of carbon to the high tide
206
corresponded to the export of carbon determined for microphytobenthos in a low tide model
207
and was equal to 31.9 mgC.m-2 per high tide(Saint-Béat et al., 2013). Moreover the secretion
208
of EPS, related to the activity of photosynthesis and migration (Underwood and Paterson,
209
2003), was supposed negligible at high tide (Hanlon et al., 2006). This was confirmed by a
210
survey of EPS concentration in a tidal mesocosm during a tidal cycle showing a fall of EPS
211
concentration in the biofilm during high tide (Agogué et al., present issue)
10
9.7mgC of benthic diatoms were resuspended per high tide (Dupuy et al., present issue); they
213
constitute a flow from the benthos to the pelagos that enhances the phytoplanktonic biomass
214
after resuspension (Brito et al., 2012; Koh et al., 2006). In this way, the microphytobenthos
215
constitutes a food resource for the secondary producers in pelagic and benthic ecosystems
216
(Guarini et al., 1998; Riera and Richard, 1996; Yoshino et al., 2012).
217 218
2.2.1.3. Benthic bacteria
219
Biofilms (i.e an assemblage of benthic diatoms and bacteria) were reconstituted in a tidal
220
mesocosm: the production and the biomass of the bacteria were measured during 5 days at
221
low and high tides (Agogué et al., present issue). . The benthic bacterial production was
222
estimated by tritiated thymidine incorporation (Garet and Moriarty, 1996), whichwas
223
converted to numbers of cells using the ratio of 1.96*1017 cells per mol of thymidine
224
determined for this study. A mean increase of 24.3% of the bacterial production in
225
comparison to the bacterial production at low tide was observed in mesocosm experiments.
226
The bacterial biomass was obtained from the mean cell volume calculated with Furhman‟s
227
formula (1981) and converted in carbon units from the formula 133.754*V0.438(Vin µm3)
228
(Romanova and Sazhin, 2010). The carbon contain in a bacterium was thus estimated as equal
229
to 79 fg C. cell-1 for a mean biovolume of 0.28 µm3.During erosion experiments at the
230
threshold velocity considered in this study, 58.2 mgC per high tide issued from the benthic
231
bacteria were suspended (Dupuy et al., present issue). A part of the suspended bacteria were
232
damaged or dead during the erosion process (40%) (Mallet et al., present issue), and thus they
233
integrated the pelagic particulate organic carbon compartment. On the contrary the remaining
234
suspended benthic bacteria, still active, were considered to increase the pelagic bacteria
235
biomass (Mallet et al., present issue).
236 237
11
2.2.1.4. Infauna (meiofauna and macrofauna)
238
The microphytobenthos is the preferential resource of the benthic fauna but in case of
239
unavailability of microphytobenthos, bacterivory becomes significant (Pascal et al., 2009). At
240
high tide, bacterivory was supposed to be higher than the low tide values: the values of low
241
tide used in the previous model (Saint-Béat et al., 2013) were thus integrated to high tide
242
models as minimal values. The obligate as well as facultative suspension feeders were
243
assumed to feed on particles from bacteria to mesozooplankton (Self and Jumars, 1988;
244 Taghon, 1982). 245 246 2.2.1.5. Phytoplankton 247
The primary production of the phytoplankton was estimated for six other sites in
Marennes-248
Oléron Bay based on in situ measurement of chlorophyll a water concentration, salinity,
249
temperature and depth profiles of light attenuation (Struski and Bacher, 2006). The
250
phytoplanktonic primary production is influenced by the erosion of sediment, limited light
251
penetration and by the resuspension of benthic diatoms which likely participate to the
252
phytoplanktonic production (Macintyre et al., 1996). In order to prevent any bias in the
253
estimation of the planktonic primary production, we constrained it by minimal and maximal
254
primary production values measured in summer for the different stations of the bay. These
255
stations are characterized by different hydrological conditions and are thus characterized by
256
different resuspension and turbidity, and consequently by a different light penetration.
257
Constraining the phytoplanktonic production by a range of possible values allowed to adjust
258
the probability density function for gross primary production according to the needs of the
259
food web based on the situation considered (i.e. with or without resuspension).
260 261
2.2.1.6. Pelagic bacteria
12
The summer abundance and the summer production of the pelagic bacteria were measured in
263
situ (Ory et al., 2011). Bacteria were counted by epifluorescence microscopy after being fixed
264
with 0.02µm filtered formaldehyde (2% final concentration) and staining for 30 min with
265
Sybr Green I (for more details see Noble and Fuhrman, 1998; Ory et al., 2011). The
266
measurement of AMPase (Vmax), which is considered as an indicator of the bacterial
267
production, was used to estimate the bacterial production from the equation log BP =
268
0.9271*log Vmax + 5.3641 (r²=0.67, n=10, p=0.003). Pelagic bacteria being assumed to
269
contain 16 fgC per cell (Labry et al., 2002), the bacterial production was thus expressed in
270
carbon.
271
Experiments on viral lysis were conducted to test the interactions between bacteria,
272
heterotrophic nanoflagellates (HNF) and viruses in the water column. In artificial incubations,
273
they were re-combined to mimic the field assemblage with respect to the natural viral to
274
bacterial ratio (VRB) and the bacteria to flagellates ratios. Fractionation allowed creating
275
experimental recombined treatments and then differentiating between the direct and indirect
276
interactions of the presence/absence of the virus and HNF. Through in vitro experiments,
277
bacterial losses induced by viruses and flagellates were estimated by comparing the reduction
278
of the bacteria cell production (MBP) between the different experimental assemblages.
279 280
2.2.1.7. Benthic and pelagic viruses
281
Viral lysis was estimated from viral production (i.e. net increase of viral abundance divided
282
by the time of the experiment) within 2 L bottle incubations in the presence or absence of
283
benthic particulates in order to determine the effect of the biofilm resuspension on the viral
284
lysis. Bacterial mortality due to viral lysis was calculated from the viral production divided by
285
the burst-size viruses (i.e. number of viruses produced by a bacterium at burst-time) which
286
was estimated as 33 in this study (Montanié, pers. comm.). The quantity of viruses produced
13
per time unit was converted into carbon considering that one virus contains 0.2 fgC
288
(Magagnini et al., 2007; Suttle, 2005).
289
The viral lysis of benthic bacteria at high tide was considered to be similar to the one at low
290
tide, thus we considered that 40 % of the bacterial production was lost by viral lysis
(Saint-291
Béat et al., 2013). At high tide, the benthic viruses were suspended and integrated into the
292
pelagic virus compartment. 1.29 mgC per high tide of virus per m² were resuspended in the
293
water column at the critical shear bed velocity of 3cm.s-1 (Dupuy et al., present issue)
294
determined by the erosion experiment (see above).
295 296
2.2.1.8. Ciliates and heterotrophic Nanoflagellates
297
The biomasses were expressed in carbon from a conversion factor of 19 µgC.µm-3 (Putt and
298
Stoecker, 1989) by considering equivalent spherical diameter (ESD). The abundances and
299
biomass of Ciliates (ESD < 50 µm) and heterotrophic nanoflagellates (2µm < ESD < 10µm)
300
were estimated in situ. The seawater was filtered onto 0.8 µm Nucleopore black filter. The
301
ciliates and nanoflagellates were enumerated by epifluorescence microscopy. Cells were first
302
fixed by the glutaraldehyde and the paraformaldehyde and stained with the lugol 1% and
303
DAPI respectively.
304
In the models, phytoplankton and pelagic bacteria are prey of the compartments ciliates and
305
nanoflagellates, which are themselves the preys of ciliates. The nanoflagellates also
306
potentially graze the viruses (Bettarel et al., 2005; Manage et al., 2002).
307 308
2.2.1.9. Mesozooplankton
309
Mesozooplankton (200µm < ESD < 400µm)play a central role in the pelagic food web in the
310
Marennes-Oléron Bay (Sautour and Castel, 1998) and show a variable diet (Vincent and
311
Hartmann, 2001). The resources of mesozooplankton, as confirmed by bottle grazer
14
experiments, in the area of Brouage mudflat are phytoplankton, either directly or indirectly
313
via ciliates and the heterotrophic nanoflagellates (Azémar et al., 2007). This diet can be
314
completed by the ingestion of detritic matter (David et al., 2006).
315
The abundance and the biomass of the mesozooplankton were estimated during study period.
316
The mesozooplankton was sampled using a 200µm mesh WP2 net, preserved in buffered
317
formaldehyde with Na(Bo3)4 (final concentration 5%) and counted under binocular
318
microscope. The biomasses were expressed in carbon by multiplying the dry weight by 0.4
319
(Simard et al., 1985). These measurements were completed by bottle grazer experiments to
320
test the effects of the biofilm suspension on the grazing of mesozooplankton. Water from the
321
erodimeter (after erosion experiments) was mixed with filtered pelagic water (200 µm, in
322
order to exclude mesozooplankton) in different proportions (20, 40 or 70%). This mix was
323
transferred in 1.13 L Nalgene bottles and and incubated during 12 or 24 h in presence/absence
324
(temoin) of mesozooplankton predators collected in situ. The resuspended biofilm in the water
325
disturbs the trophic interactions of the mesozooplankton, especially through an inhibition of
326
the grazing of phytoplankton and heterotrophic nanoflagellates by the mesozooplankton
327
(Hartmann, pers. comm.). Thus in the model with the resuspension no flow between
328
phytoplankton and nanoflagellates towards mesozooplankton was considered.
329 330
2.2.1.10. Grazing Fishes
331
Main species able to graze on mudflat at high tide are mullets (Liza ramada and Liza aurata).
332
Observed individuals arrive on the mudflat with an empty stomach, while they leave it with a
333
full stomach (Carpentier et al., present issue). Thus the mullets were considered as a vector of
334
carbon export. Since, the abundance of individuals going about the Brouage mudflat at high
335
tide could not be measured in situ, grazing traces left by mullets on mudflat were considered
336
as a proxy of their grazing pressure. Presence of traces was estimated from pictures of one
15
square meter quadrats (expressed by surface of sediment removed by mullets by square
338
meter). In addition, experiments on the feeding behavior of mullets were conducted in
339
mesocoms to assess the volume of sediment ingested per individual at each tide (Como et al.,
340
present issue)). The coupling with field pictures finally allowed estimating the density of
341
fishes per square meter.
342 343
2.2.1.11. Imports and exports
344
For all benthic compartments, we considered that the production during the previous low tide
345
was not totally consumed, thus imports of carbon from the diurnal low tide were taken into
346
account. These import values corresponded to the mean export values of the low tide model
347
(Saint-Béat et al., 2013). Export was considered for both models regarding the
348
microphytobenthos and the macrofauna, while export was considered only in the model
349
without resuspension regarding the benthic particulate carbon and the dissolved particulate
350
carbon. For the pelagic compartment, no import from the open sea was considered in the
351
model with resuspension and an import from the open sea of pelagic particulate carbon was
352
considered in the model without resuspension. We supposed that the production of the
353
pelagos was totally consumed during the high tide, thus no export from the bay to the open
354
sea of carbon was considered except for the pelagic particulate carbon, when the suspension
355 occurred. 356 357 2.2.2. Equations 358
The second step characterizes the mass balances of each compartment (listed in Table S1) and
359
flows measured in the field. These two elements (i.e. mass balance and equations) were
360
written within an equation: 𝐴 ∗ 𝑥 = 𝑏 where 𝑥 was vector that contained possible flows, the
361
matrix 𝐴 expressed the mass balance and the field observation as a combination of
16
coefficients of the carbon flows and the vector 𝑏 contained value of mass balances and values
363
of known flows (Vézina, 1989). The mass balances correspond to the report of inputs and
364
outputs for each compartment of the food web. By default, a compartment is considered to be
365
at the equilibrium (i.e. a constant biomass). Concerning the model with suspension we needed
366
to consider standing stock of the benthic particulate carbon and the benthic dissolved carbon
367
in deficit. Indeed, for these two compartments, there was a net change in mass equal to
368
resuspension term for particulate carbon and equal to the minimal value necessary to the
369
running of model for the dissolved organic carbon. In the case without resuspension, we
370
considered that the biomass loss of pelagic bacteria was equal to the value of the
371
sedimentation. The other sets of equations corresponded to the values of flows, which were
372 measured in situ. 373 374 2.2.3. Inequalities 375
At the last step, some biological constraints were added to the mass balances and flow values.
376
These constraints were obtained from the literature and limit the possible solutions of flows to
377
realistic values. The information was added to the model with the inequality: 𝐺 ∗ 𝑥 ≤ ℎ,
378
where 𝑥 remains the vector containing flows, 𝐺 is a matrix that contains the coefficients of the
379
biological constraints and the vector ℎ is composed of values of biological constraints
380
(Vézina, 1989). For the benthic compartments the set of inequalities of the low tide model
381
(Saint-Béat et al., 2013) was used. When the constraints corresponded to a value of flows, the
382
value of this constraint was updated according to the time of high tide (8h). The inequalities
383
for the pelagic compartments were grouped in the Table 2.
384
The sedimentation flows values were limited, considering two different sinking velocities,
385
which is different according to the particle size (De La Rocha and Passow, 2007). The
386
minimal sinking velocity corresponded to the sinking velocity of a single isolated particle. We
17
considered a minimal sinking velocity of 0.05 m.d-1 for free bacteria (Lapoussière et al.,
388
2011), 0.25 m.d-1 for chlorophyll a (Lapoussière et al., 2011) and 2.32 m.d-1 for particulate
389
carbon (Burns and Rosa, 1980). The maximal sinking velocity referred to the sinking velocity
390
of „marine snow‟, that are defined as organic aggregates with a diameter > 0.5 mm (Alldredge
391
and Silver, 1988). The maximum sinking velocity chosen for this study was 16 m.d-1 (Turner,
392
2002). We considered that pelagic dissolved carbon can fall with the aggregates formed by
393
„marine snow‟ and represents one third of the total carbon in aggregates (Alldredge, 2000).
394 395
2.2.4. Calculation of solutions
396
The generated matrices (A, b, G and h) define a multi-dimensional space delimiting possible
397
solutions of the flows (x). The MCMC-LIM mirror (Van den Meersche et al., 2009) was used
398
to sample through that solution space in an attempt to map it completely. The MCMC-LIM,
399
based on the mirror technique defined by Van Den Meersche et al.(2009) and updated for
400
LIM use by van Oevelen et al. (2010), calculates several solutions and allows a direct
401
characterization of the uncertainty. This modelling technique brings the advantage of
402
calculating a range of possible values for each flow (i.e. a probability density function). For
403
each model (with resuspension and without resuspension), 500, 000 iterations with a jump of
404
0.5 were calculated. The length of jump and the number of iterations were determined to
405
cover the solution space as completely as possible. In this study the simulations were realized
406
with a MATLAB© translation conceived by Alain Vézina and Lauriane Campo of the
R-407
CRAN project package LIM-Solve created by Van den Meersche et al. (2009).
408 409
2.2.5. Network analysis
410
From the 500,000 solutions estimated by MCMC-LIM, seven ecological network analysis
411
(ENA) indices were calculated. These indices allow assessing the structure and the
18
functioning of the two food webs. The magnitude of cycling within the system was described
413
by the Finn cycling Index (i.e. FCI). This index represents the fraction of flows involved in
414
the cycling (Finn, 1976). A cycle represents a series of transfers between components in an
415
ecosystem beginning and ending in the same compartment without going through the same
416
compartment twice. The FCI is estimated by the ratio Tc/TST, where TST is the total system
417
throughput (i.e. sum of all flows) and Tc the amount devoted to cycling. Various global
418
indices describe the developmental and organizational state of the ecosystem (Ulanowicz,
419
1986). The TST measures the activity of the whole ecosystem. The TST can be considered as
420
the total power generated within the system (Baird et al., 1998). The AMI value is indicative
421
of the specialization of flows in the network (Ulanowicz, 2004). The probability of flows
422
between two compartments increases with the AMI value, and thus with the specialization of
423
flows. The Ascendency (A) which represents the state of organization within the ecosystem
424
(Ulanowicz, 1986), is described as the product of the TST and the average mutual information
425
(i.e. AMI). The development capacity (DC) is defined as the upper limit of Ascendency. The
426
relative Ascendency is the ratio A/DC and estimates the proportion of the network that is
427
organized and thus efficient. The (DC – A) difference estimates the inefficient part of the
428
network, corresponding to the overheads (i.e. overheads on imports, exports and dissipation)
429
and redundancy, that measures the uncertainty associated to the presence of multiple or
430
parallel pathways among the compartments (Ulanowicz and Norden, 1990). The internal
431
Ascendency (Ai) and internal development capacity (DCi) refer to internal exchanges alone
432
and exclude the exogenous flows.
433
These indices were estimated using MATLAB© routine written by Carole Lebreton and
434
Markus Schartau (GKSS Research Centre, Geesthacht, Germany) to calculate the index value
435
for every solution estimated by the LIM-MCMC.
436 437
19
2.2.6 Statistical test
438
Since the distribution of the data did not follow a normal distribution a non-parametric test
439
was used. The significance of the differences between the indices calculated for both
440
networks with and without resuspension was controlled by the Wilcoxon test (α = 0.01). The
441
tested hypothesis was that the two data sets were issued from a continuous distribution with
442
equal medians. Statistical tests is possible because using the LIM-MCMC technique on
443
500,000 solutions, 500,000 values of each ENA index were also calculated, as consequence
444
we can use statistical tests which are not usually possible in such a context of food web
445
modelling using static methods and at this level of functional diversity.
446 447 3. Results 448 3.1. Flow values 449
Some differences in flow values between the two conditions (i.e. with or without suspension)
450
were observed (Table S2). The pelagic primary production was higher with resuspension. On
451
the whole, consumption rates remained the same irrespective of the condition, except for the
452
bacterivory of heterotrophic nanoflagellates (doubled with resuspension), the bacterivory of
453
nematodes (consumption without resuspension was 7 times higher than the value during
454
resuspension), as well as herbivory of deposit-feeders (about twice higher without
455
resuspension than with resuspension) and consumption on nematodes by grazing fishes that
456
both doubled without suspension. The exudation of DOC by benthic bacteria increased
457
without suspension contrary to the exudation of DOC by pelagic bacteria that was five times
458
higher during resuspension. The mortality of phytoplankton (i.e. phyTOppc) was higher when
459
resuspension occurred. The egestion of nematodes without suspension was twice the egestion
460
during resuspension. The export of carbon from benthic compartment was higher without
461
suspension.
20 463
3.2. Compartment activities
464
Significant differences appeared according to the condition considered (Figure 2). The benthic
465
activity was stimulated by the sedimentation of micro-organisms of the water column. In
466
contrast, the resuspension of micro-organisms inhabiting in the sediment stimulated the
467
pelagic activity.
468
Several pelagic compartments were affected by the resuspension of micro-organisms. The
469
phytoplankton (phy), the pelagic non-living compartments (i.e. particulate compartment (ppc)
470
and dissolved organic carbon (pdc)) as well as the pelagic bacteria (bcp) had a higher activity
471
in the case of resuspension. On the contrary the microphytobenthos, the benthic bacteria, the
472
benthic non-living compartments were more active when sedimentation occurred.
473 474
3.3. Diet and consumption
475
Herbivory tended to represent a more important part in the pelagic system (Table 3). In
476
contrast, bacterivory was higher in the benthic compartment. The resuspension of the
micro-477
organisms to the water column had an effect on bacterivory, herbivory and the ratio between
478
them. In the pelagic part, the resuspension favored the bacterivory. On the contrary, the
479
herbivory was favored in the case without resuspension. The herbivory and bacterivory in
480
benthos were both higher without resuspension.
481
The ratios showed that the herbivory was dominant in the pelagos. Nevertheless, when
482
resuspension occurred, the decline in the ratio (almost divided by 2) was due to a fall of
483
herbivory as well as a rise in bacterivory. A fall in the ratio was observed regarding the
484
benthos due to a decline in the bacterivory lower than in herbivory.
485
None of the compartment was affected by the resuspension (Figure 3). Conversely, the diet of
486
nematodes was drastically altered during the resuspension phase (B). Whatever the
21
resuspension occurred or not, the contribution of the microphytobenthos as a food item for
488
nematodes did not change (about 15%). On the contrary, benthic bacteria and detritus
489
contributed to nematodes diet almost equally in the case without resuspension (40 and 30%,
490
respectively), while it mainly shifted to benthic particulate (about 80%) in resuspension
491
situation.
492
The detritus contributed only slightly to the diet of deposit feeders. This group fed mainly on
493
microphytobenthos and benthic bacteria. The contribution of each of these two groups
494
changed with the resuspension. While the consumption on the benthic bacteria remained the
495
same between resuspension and sedimentation phases, it corresponded to a higher
496
contribution to the deposit-feeder diet during resuspension.
497
The facultative suspension feeders fed on the planktonic and benthic species. The contribution
498
of the phytoplankton to the diet of this group was higher when the resuspension occurred.
499
Consequently, the microphytobenthos was merely consumed. In contrast, in the case without
500
resuspension, the microphytobenthos contributed to 40% of the consumption and the
501
phytoplankton for 20%. The contribution of pelagic and particulate carbon tended to be lower
502
with the resuspension.
503
The resuspension tended to have some consequences on the diet of the heterotrophic
504
nanoflagellates and mesozooplankton (Figure 4). The diet of the heterotrophic nanoflagellates
505
was more diversified during resuspension because of the contribution of virus (vrp). The
506
contribution of pelagic bacteria (bcp) was three times higher in the case of resuspension.
507
Consequently the contribution of the phytoplankton (phy) decreased. The most affected
508
compartment was the mesozooplankton. Without resuspension the mesozooplankton fed
509
equally on the phytoplankton, heterotrophic nanoflagellates, pelagic particulate carbon (ppc)
510
and ciliates. During the resuspension, the consumption on both heterotrophic nanoflagellates
511
and phytoplankton was inhibited.
22 513
3.4. ENA indices
514
Significant differences between values of the indices of the two situations were observed
515
(Figure 5). The TST was about 3 times higher when the resuspension occurred. The
516
Ascendency followed the same trend. However, a lower organization of the system (i.e. lower
517
AMI value) was observed. The higher relative Ascendency, coupled with a lower AMI value
518
observed in the case of resuspension, suggested a lower diversity of flows. The overheads
519
based on the imports, exports, respiration and redundancy of the system were lower during
520
resuspension. The internal normalized Ascendency tended to be similar for the two situations.
521
The proportion of flows involved in the cycling (i.e. FCI value) was lower during
522 resuspension event. 523 524 4. Discussion 525
4.1. Activity of the benthic and the pelagic compartments
526
The benthos was more active than the pelagos regarding simulation without resuspension; in
527
contrast the pelagic activity was higher during resuspension. This fact can be explained by a
528
large import of particulate carbon to the pelagic particulate compartment. Without this import
529
of pelagic carbon, the pelagic activity was equal to the benthic activity during resuspension.
530
The higher benthic activity was previously shown in the model of the Brouage mudflat food
531
web. In fact, the higher activity of the benthos was observed irrespective of the model
532
considered in previous studies by regarding annual budget (Leguerrier et al., 2004) or by
533
deciphering seasonal budgets (Degré et al., 2006). However, in our model, the ranking of the
534
compartments was modified. The main difference concerned the benthic bacteria and the
535
microphytobenthos. The benthic bacteria dominated the ecosystem; they were followed by the
536
benthic non-living detritus compartments. Surprisingly, the microphytobenthos was ranked
23
only 8th. The difference with previous models is the time-scale considered: a mean year
538
(Leguerrier et al., 2004) or a mean month (Degré et al., 2006) which is in dramatic contrast to
539
the small scale mean immersion period integrated in our model. During immersion, because
540
of darkness due to sediment burying, the microphytobenthos production was null (Blanchard,
541
2006). As a consequence, the carbon input to this compartment exclusively originated from
542
the photosynthesis performed during the previous diurnal low tide, which might explain its 8th
543
rank in our model. The first pelagic compartments were ranked 4th and 5th and corresponded
544
to the phytoplankton and the dissolved organic carbon, respectively.
545
The resuspension of the microbial biofilm stimulated the activity of the phytoplankton, the
546
non-living compartments (detritus) and the pelagic bacteria. This stimulation was not only the
547
consequence of the input of new matter in the water column. The phytoplankton showed a
548
higher gross primary production when the resuspension of the microbial biofilm occurred.
549
Pelagic primary production was not imposed to the model; it was only constrained by minimal
550
and maximal values of pelagic production found for different hydrological conditions in
551
Marennes-Oléron Bay. The higher production was somewhat surprising because the
552
resuspension also generates a high turbidity and the reduction of the light penetration which
553
dramatically reduces phytoplankton photosynthesis (Billerbeck et al., 2007; Porter et al.,
554
2010). When buried in the sediments, the microphytobenthos can remove nutrients from the
555
overlying water and the sediment pore water (Macintyre et al., 1996). Such activity tends to
556
reduce the nutrient fluxes from the sediments to the water column which can limit the
557
phytoplankton production (Sarker et al., 2009; Sloth et al., 1996). When the
558
microphytobenthos resuspension occurs, the nutrient fluxes to the water column increase
559
which has a positive effect on the phytoplankton production even if light is limiting (Porter et
560
al., 2010). Paradoxically, the import of microphytobenthic diatoms to the water column
561
contributes itself positively to the production of the phytoplankton (Macintyre et al., 1996).
24
By enriching water in particulate and dissolved carbon, which sustained a higher bacterial
563
activity as previously reported (Cotner et al., 2000; Poremba et al., 1999; Sloth et al., 1996),
564
the resuspension also stimulated heterotrophic production.
565
On the contrary, the settling of pelagic micro-organisms to the bottom of the water column
566
had smaller but significant consequences on the benthic compartments. In our model, the
567
input of pelagic fresh matter to the benthos increased the stock of available carbon for higher
568
trophic levels but it did not affect the production of the different compartments. The higher
569
activity observed for the benthic compartments (mpb, bdc, bcb, bpc) (Figure 2) was linked to
570
the deposit of pelagic diatoms, dissolved carbon, pelagic bacteria and particulate carbon
571
respectively at the surface of the sediments. The photosynthetic production of the pelagic
572
diatoms settled at the bottom of the water column during immersion is more probably limited
573
by the penetration of light than by the nutrient availability. It is supposed that, in contrast to
574
the light reaching the surface of the sediments (Billerbeck et al., 2007; Macintyre et al., 1996),
575
nutrients are often not a limiting factor for the photosynthesis in the intertidal sediments
576
(Migné et al., 2004; Serôdio and Catarino, 2000). The high turbidity reported in the bay of
577
Marennes-Oléron (Raillard and Mesenguen, 1994) likely stops the light penetration to the
578
sediment surface and strongly impairs the photosynthesis of pelagic diatoms. The effect of the
579
settling on the benthic bacterial production is more obvious. The bacterial production depends
580
on the substrate supply including organic carbon (Sander and Kalff, 1993). For instance in
581
Kiel Bight, the settling of detritus stimulates the benthic bacterial production (Meyer-Reil,
582
1983). Consequently, it is very likely that the benthic bacterial production is stimulated in the
583
Brouage mudflat during sedimentation.
584 585
4.2. Herbivory versus bacterivory
25
The massive resuspension event impacted the pelagic microbial food web. It stimulated the
587
bacterivory of the pelagos as reported before for heterotrophic nanoflagellates (Garstecki et
588
al., 2002). A higher quantity of carbon flowed through the virus (viral lysis was doubled) and
589
consequently more virus were consumed by heterotrophic nanoflagellates. The increase of
590
pelagic bacterial abundance and production doubled the bacterivory rate of heterotrophic
591
nanoflagellates. In contrast, the resuspension tended to decrease the pelagic herbivory. In spite
592
of a higher gross primary production and a direct input of benthic diatoms biomass to the
593
water column, the phytoplankton was integrated to a lower proportion to the pelagic food
594
web. Indeed, the grazing of phytoplankton by the mesozooplankton had been shown to be
595
inhibited during catastrophic erosion event (Hartmann, pers.comm.). Consequently, our
596
models showed that a lower part of the phytoplankton was consumed in the model with
597
resuspension, inducing a greater mortality of this comportment. This result of the models (i.e.
598
higher phyTOppc when resuspension occurs) is coherent with previous results of resuspension
599
experiments (Porter et al., 2010). It thus appears that in conditions of resuspension, the
600
phytoplankton indirectly participated to the enrichment of the water column in dissolved
601
organic carbon and to the pelagic bacterial production.
602
The bacterivory dominated the benthic compartment during immersion irrespective of the
603
resuspension. At high tide, benthic diatoms moves down the sediment and cannot perform
604
photosynthesis because of the absence of light (Cartaxana et al., 2011). Hence, the benthic
605
food web must be sustained by the input of carbon coming from the photosynthetic
606
production of the previous emersion and by the bacterial production. In our model, we
607
supposed that the meiofauna and the macrofauna showed a constant consumption along the
608
day irrespective of immersion/emersion periods. This hypothesis was based on the assumption
609
that the meiofauna and the deposit feeders had alternative resources since the
610
microphytobenthos was not sufficient to sustain their respective metabolism. Detritus (van
26
Oevelen et al., 2006) bacteria were possible alternative resource for benthic fauna (Pascal et
612
al., 2009; van Oevelen et al., 2006). Some isotopic analyses at the Brouage mudflat showed
613
that the benthic detritus contributes to 11% in maximum to the deposit-feeders consumption
614
(Richard, comm. pers.). We supposed that the alternative feeding resource was the benthic
615
bacteria (see result section .
616
Previous studies on the bacterivory rates of the nematodes, the foraminifera and Peringia
617
ulvae in the Brouage mudflat indeed showed that bacteria can constitute a significant
618
alternative resource to the microphytobenthos under some conditions (Pascal et al., 2008a;
619
Pascal et al., 2008b; Pascal et al., 2008c). When there was no resuspension, the herbivory and
620
the bacterivory were both stimulated, although the bacterivory was stimulated in a larger
621
proportion due to the higher activity of the nematodes. The bacterivory thus remained
622
dominant in the benthic compartment irrespective of the physical forcing.The Sylt- Rømø
623
Bight in the North of Germany is composed of a mosaic of habitats including a mudflat. Its
624
benthic food web is based on microphytobenthos and macrophytes. In this benthic ecosystem,
625
the herbivory dominates the bacterivory (Baird et al., 2004). Indeed, herbivory is more than
626
two times higher than bacterivory. Thus the ratio herbivory/bacterivory of the Sylt-Rømø
627
Bight displays an opposite tendency than the ratio estimated for the Brouage mudflat. This
628
opposite tendency may be linked to the fact that this ratio was obtained from the food web for
629
the whole bay on a long term. As a consequence, habitats with high and low primary
630
production were associated, thus the available carbon issued from the primary production was
631
more important. Moreover, the food web considered in Baird et al. (2004) represents a mean
632
day as a consequence the difference between low tide and high tide was not visible and the
633
effect of the season was not considered contrary to present simulations, which focused on
634
summer conditions and high tide only In this study, that considered the summer period, little
635
carbon issued from the primary production at low tide was available. The consideration of the
27
food web for the whole year at the Brouage mudflat should abate the seasonal difference and
637
change the trend of herbivory/bacterivory ratio.
638 639
4.3. Functioning of the Brouage food web
640
For comparing the functional indices from our model to others, we took care of selecting
641
ecosystem models that coupled the pelagic and benthic compartments. Moreover the
non-642
living compartments must be separated from bacteria, otherwise the ENA indices would be
643
biased (Johnson et al., 2009). Values of relative Ascendency and internal relative Ascendency
644
were in general higher to those previously reported. Relative Ascendency ranged from 33.4
645
(Monaco and Ulanowicz, 1997) to 49.5 for the Chesapeake Bay (Baird et al., 1991) and the
646
internal Ascendency from 31.2 for the Delaware (Monaco and Ulanowicz, 1997) to 44.1 for
647
the Sundays Bay (Scharler and Baird, 2005). The cycling estimated without resuspension was
648
higher to the FCI (i.e. Finn Cycling Index) estimated in the Sylt- Rømø Bight (= 17.2%) and
649
close to the value of Sundays Estuary (Scharler and Baird, 2005). The differences between
650
our study and previous ones are most probably based on the shorter time scale in our models.
651
In the aforementioned studies, the ecosystems considered are estuaries which are subjected to
652
the tidal rhythm and thus which are controlled by strong temporal/physical forcing. It was
653
demonstrated how physical parameters can influence the ecological properties described by
654
the ENA indices (Niquil et al., 2012). The consequences of physical forcing like the
655
resuspension are smoothed when the considered networks use flows averaged over a mean
656
day, more representative of normal conditions without waves. Additionally, the biological
657
processes change according to the immersion and the emersion periods which impacts the
658
carbon budget (Migné et al., 2009). Consequently, when emersion and immersion are
659
considered separately (i.e. short time scale), it allows more precisely deciphering the
660
biological and physical processes that control the functioning of the food web.
28
When the massive resuspension of the microbial biofilm occurred, the enrichment of the
662
water column by the benthic particulate carbon (i.e. 3.584gC.m-2.per high tide) mainly
663
supported the increased activity of the whole system and the decreased organization of the
664
network decreased. The higher value of Ascendency (2*104 mgC.m-2.per high tide against
665
0.6*104 mgC.m-2.per high tide during sedimentation) was the consequence of a higher TST
666
(10000 mgC.m-2.per high tide during resuspension and 3500 mgC.m-2.per high tide during
667
sedimentation), in spite of a drop down in the specialization of the trophic way (measured by
668
AMI)This is a characteristic observation for a so-called “pulse eutrophication”, an intermittent
669
increase of organic matter supply combined with physical factors (Patrício et al ., 2004).
670
Moreover a high value of Ascendency derived from a very high TST, could disturb the
671
internal stability of the system (Ulanowicz, 2003). The lower overheads suggest a lower
672
resistance to the perturbation as proposed by Ulanowicz (2003). Thus the resuspension
673
decreased the resistance of the system to a perturbation. We propose that the massive
674
resuspension event in the Brouage mudflat could be defined as a “pulse eutrophication” event
675
that regularly disturbs the meta-ecosystem. On the contrary the biological erosion coupled
676
with a high sedimentation tended to reduce the perturbation in the meta-system.
677
During the massive resuspension, the lower proportion of cycling (i.e. lower value of FCI)
678
coupled with a high internal relative Ascendency (close to 50%) can be explained by the
679
limited integration to the planktonic food web of the non-living carbon suspended in the water
680
column. Indeed, in spite of a higher pelagic bacterial production and a higher detritivory, a
681
low quantity of carbon was recycled. As a consequence, almost all the carbon suspended in
682
the water column (i.e. 3.534 gC.m-2.per high tide) was exported. Note that the export value
683
was not constrained in the model, thus this value reflected a real property of the network. The
684
larger the difference between the cycling and the internal relative Ascendency, the less
685
organized and more under pressure a system would be (Baird et al., 2007; Baird et al., 1991).