SOIL-VEGETATION-ATMOSPHERE INTERACTION IN THE BOREAL FOREST ECOSYSTEM IN EASTERN CANADA
THESIS PRESENTED
AS A PARTIAL REQUIREMENT OF
DOCTORATE IN SCIENCES DE L’ENVIRONNEMENT
BY
SHALINI OOGATHOO
INTERACTION SOL-VÉGÉTATION-ATMOSPHÈRE DANS L’ÉCOSYSTÈME DE LA FORÊT BORÉALE DE L’EST DU CANADA
THÈSE PRÉSENTÉE
COMME EXIGENCE PARTIELLE
DOCTORAT EN SCIENCES DE L’ENVIRONNEMENT
PAR
SHALINI OOGATHOO
UNIVERSITÉ DU QUÉBEC À MONTRÉAL Service des bibliothèques
Avertissement
La diffusion de cette thèse se fait dans le respect des droits de son auteur, qui a signé le formulaire Autorisation de reproduire et de diffuser un travail de recherche de cycles
supérieurs (SDU-522 – Rév.10-2015). Cette autorisation stipule que «conformément à
l’article 11 du Règlement no 8 des études de cycles supérieurs, [l’auteur] concède à l’Université du Québec à Montréal une licence non exclusive d’utilisation et de publication de la totalité ou d’une partie importante de [son] travail de recherche pour des fins pédagogiques et non commerciales. Plus précisément, [l’auteur] autorise l’Université du Québec à Montréal à reproduire, diffuser, prêter, distribuer ou vendre des copies de [son] travail de recherche à des fins non commerciales sur quelque support que ce soit, y compris l’Internet. Cette licence et cette autorisation n’entraînent pas une renonciation de [la] part [de l’auteur] à [ses] droits moraux ni à [ses] droits de propriété intellectuelle. Sauf entente contraire, [l’auteur] conserve la liberté de diffuser et de commercialiser ou non ce travail dont [il] possède un exemplaire.»
Je tiens à débuter ma thèse en remerciant les personnes qui m’ont soutenu pendant toute la durée de mon doctorat. Je souhaite d’abord remercier grandement mon directeur Daniel Houle, qui m’a donné l’opportunité de faire ce doctorat, pour sa supervision continue, et aussi pour son expertise, sa présence et disponibilité et de répondre à toutes mes questions et doutes pendant toute la durée de mon doctorat. J’aimerai aussi remercier grandement mon co-directeur, Daniel Kneeshaw, pour son expertise, ses conseils et ses questions qui me poussent à réfléchir au delà. J’aimerai aussi ajouter la gentillesse, la générosité et l’encouragement continu de mes deux directeurs m’ont aidé beaucoup à terminer ce doctorat.
Un grand remerciement à Louis Duchesne, qui m’a fourni toutes les données et informations pertinentes utilisées dans mon projet de doctorat, et aussi pour ses conseils sur les analyses statistiques et le logiciel R, et pour les révisions de mes trois chapitres. J’aimerai aussi remercier Richard Harvey pour ces conseils sur l’utilisation de CLASS et à Travis Logan pour son aide sur l’extraction des données au début de mon doctorat. Un remerciement au personnel d’ Ouranos (Mourad et Romy) pour leur aide technique et à Marco Alves pour ses conseils sur CLASS et le logiciel R au début de mon doctorat. Un remerciement également à Christine Guillerme pour son aide au niveau administratif à UQAM. J’aimerai aussi remercier mon amie Stéphanie Gladu et tous les amis dans le labo de Daniel Kneeshaw qui m’ont soutenu pendant mes dernières années de doctorat. Finalement, un grand remerciement à ma fille Mishti pour sa patience pendant toute la durée de mon doctorat.
La présente recherche fait partie d’une plus grande question de recherche sur la sécheresse dans la forêt boréale, conçu par Dr Daniel Houle (Professeur associé à UQAM) et Dr Daniel Kneeshaw (Professeur à UQAM) et financé par le MFFP, Ouranos et MITACS. De fait, la problématique est de mieux comprendre le lien entre le contenu en eau et la transpiration durant la saison de croissance et des épisodes de sécheresse dans des peuplements forestiers boréaux situés dans la province du Québec, au Canada.
Cette thèse de doctorat est formée de cinq chapitres rédigés en anglais (trois sous forme d'articles scientifiques) sur l’interaction du sol-végétation-atmosphère dans la forêt boréale. Ces trois articles sont mes contributions originales pour ma thèse de doctorat en sciences de l’environnement à Université du Québec à Montréal.
Chapitre I et V sont l’introduction générale et la conclusion générale de ma thèse, respectivement. Les chapitres II, III et IV sont les trois articles suivants.
Le premier article est intitulé: « PERFORMANCE EVALUATION AND SENSITIVITY ANALYSES USING THE CANADIAN LAND SURFACE SCHEME (CLASS) FOR THE SIMULATION OF SOIL TEMPERATURE AND SOIL WATER IN THE BOREAL FOREST OF EASTERN CANADA ». Les coauteurs sont Daniel Houle, Louis Duchesne, et Daniel Kneeshaw. Cet article sera soumis sous peu à la revue Journal of Hydrology.
Le deuxième article est intitulé : « VAPOUR PRESSURE DEFICIT AND SOLAR RADIATION ARE THE MAJOR DRIVERS OF TRANSPIRATION OF BALSAM FIR AND BLACK SPRUCE TREE SPECIES IN HUMID BOREAL REGIONS, EVEN DURING A SHORT-TERM DROUGHT ». Les coauteurs sont Daniel Houle, Louis Duchesne et Daniel Kneeshaw. Cet article est publié dans la revue Agricultural and Forest Meteorology.
Le troisième article est intitulé : « TREE TRANSPIRATION WELL SIMULATED BY THE CANADIAN LAND SURFACE SCHEME (CLASS) BUT NOT DURING DROUGHT ». Les coauteurs sont Daniel Houle, Louis Duchesne, et Daniel Kneeshaw. Cet article est soumis à la revue Journal of Hydrology.
Daniel Houle, Daniel Kneeshaw et moi-même avons conçu les projets de même que leurs approches méthodologiques. Louis Duchesne a collaboré à la collection de toutes les données de mesure et des informations pertinentes sur les deux sites d’étude. J’ai fait toutes les simulations avec le modèle CLASS et toutes les analyses statistiques. J’ai aussi rédigé les trois articles, l’introduction générale et la conclusion générale. Pendant toute la durée de mon doctorat, Louis Duchesne a fourni des informations pour combler des manquements pour simuler le modèle et les analyses statistiques. Il m’avait aussi conseillé sur l’utilisation de certaines applications d’analyse sur le logiciel R. Richard Harvey m’a aussi conseillé plusieurs fois sur le modèle CLASS, sur le fonctionnement et la limitation du modèle. De plus, mes directeurs, Daniel Houle et Daniel Kneeshaw, ont commenté et suggéré plusieurs fois sur le contenu de ma thèse pour l’améliorer. Ils ont aussi corrigé les trois articles et la thèse en générale.
AVANT-PROPOS ... iv
LISTE DES FIGURES ... x
LISTE DES TABLEAUX ... xvi
RÉSUMÉ ... xviii
ABSTRACT ... xx
CHAPITRE I GENERAL INTRODUCTION ... 1
1.1 Trees in boreal forest ecosystems ... 1
1.1.1 Annual cycle of stem diameter variation ... 3
1.2 Soil temperature and soil water ... 5
1.3 Transpiration ... 6
1.3.1 Environmental control on transpiration ... 7
1.3.2 Plant physiological control on transpiration ... 8
1.3.3 Measurement of transpiration via sap flow techniques ... 8
1.4 Representation of land surface processes in land surface schemes ... 11
1.4.1 Land surface processes ... 11
1.4.2 Land surface schemes ... 12
1.4.3 Impact of land surface processes in Land Surface Schemes on climate models ... 14
1.5 Objectives of the study ... 16
1.6 Study area – Laflamme and Tirasse... 17
1.7 References... 18
CHAPITRE II Performance evaluation and sensitivity analyses using the Canadian Land Surface Scheme (CLASS) for the simulation of soil temperature and soil water in the boreal forest of eastern Canada ... 26
2.1 Résumé ... 27
2.2 Abstract ... 28
2.3 Introduction... 29
2.4 Methods ... 33
2.4.1 Description of study areas ... 33
2.4.2 Measured data ... 33
2.4.3 Canadian Land Surface Scheme (CLASS) ... 34
2.4.4 Analyses ... 37 2.5 Results ... 41 2.5.1 Soil temperature ... 41 2.5.2 Soil water ... 43 2.5.3 Sensitivity analysis ... 45 2.6 Discussion ... 52 2.6.1 Soil temperature ... 52 2.6.2 Soil water ... 54 2.7 Conclusion ... 56 2.8 Acknowledgements... 58 2.9 References... 58 2.10 Supplementary materials ... 64
CHAPITRE III VAPOUR PRESSURE DEFICIT AND SOLAR RADIATION ARE THE MAJOR DRIVERS OF TRANSPIRATION OF BALSAM FIR AND BLACK SPRUCE TREE SPECIES IN HUMID BOREAL REGIONS, EVEN DURING A SHORT-TERM DROUGHT ... 72
3.1 Résumé ... 73
3.2 Abstract ... 74
3.3 Introduction... 75
3.4 Materials and methods ... 77
3.4.1 Site description ... 77
3.4.2 Meteorological and soil measurements ... 78
3.4.3 Sap flow & dendrometric data ... 79
3.4.4 Analyses ... 81
3.5.1 Impact of environmental variables on sap flow during the growing season
……….. ... 84
3.5.2 Impact of an extreme drought on sap flow in the summer 2012 at the balsam fir site ... 89
3.6 Discussion ... 92
3.6.1 Control of sap flow during the growing season ... 92
3.6.2 The analysis of the 2012 summer drought at the balsam fir site ... 95
3.7 Conclusion ... 97
3.8 Acknowledgements... 98
3.9 References... 98
3.10 Supplementary materials ... 104
CHAPITRE IV TREE TRANSPIRATION WELL SIMULATED BY THE CANADIAN LAND SURFACE SCHEME (CLASS) BUT NOT DURING DROUGHT ... 112
4.1 Résumé ... 113
4.2 Abstract ... 114
4.3 Introduction... 114
4.4 Materials & methods... 118
4.4.1 Description of study area ... 118
4.4.2 Measured data ... 118
4.4.3 Canadian Land Surface Scheme (CLASS) ... 120
4.4.4 Analyses ... 124
4.5 Results and discussion ... 125
4.5.1 Transpiration during the rehydration period (prior to growing season) 125 4.5.2 Transpiration during the growing season ... 128
4.5.3 Transpiration during observed and simulated drought at the balsam fir site ………. ... 132
4.6 Conclusion ... 137
4.7 Acknowledgements... 137
4.8 References... 138
4.9 Supplementary materials ... 144
5.1 Summary of findings ... 149
5.1.1 Performance and sensitivity analyses of CLASS for the simulation of soil water and soil temperature ... 150
5.1.2 Environmental drivers of transpiration in humid boreal region during growing season and a drought period ... 151
5.1.3 Performance of CLASS for the simulation of transpiration during the rehydration period, the growing season and a drought ... 152
5.2 Limitations and future works ... 154
5.2.1 Field measurement limitations ... 154
5.2.2 Shortcomings of CLASS ... 156
5.3 Concluding remarks ... 157
5.4 References... 158
APPENDIX A ... 161
Figure Page
1.1 Major forest ecozones across Canada ... 1 1.2 Phenology of stem diameter variation of boreal trees over three years with
shrinkage, rehydration and growth illustrated for one of those years... 3 1.3 Cross sectional views of wood composition ... 4 1.4 Three main sap flow techniques: thermal dissipation (TD); heat field
deformation (HFD); and heat pulse velocity (HPV)... 10 1.5 Schematic diagram of CLASS ... 15 1.6 Location of the two study areas (red squares) in the Quebec province,
Canada ... 17 2.1 Observations of daily soil water at the three soil profiles (SP1 to SP3) at
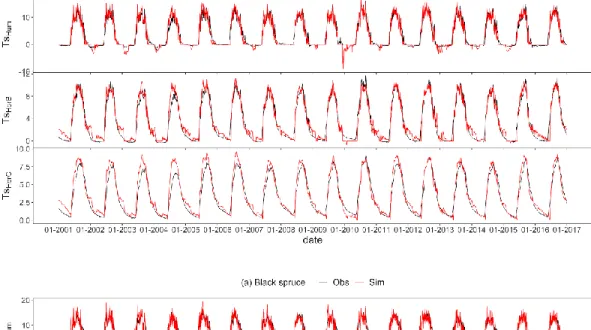
the black spruce (a) and four soil profiles (SP1 to SP4) in the B and C horizons at the balsam fir (b) sites ... 39 2.2 Observed and simulated daily soil temperature (°C) for the humus layer
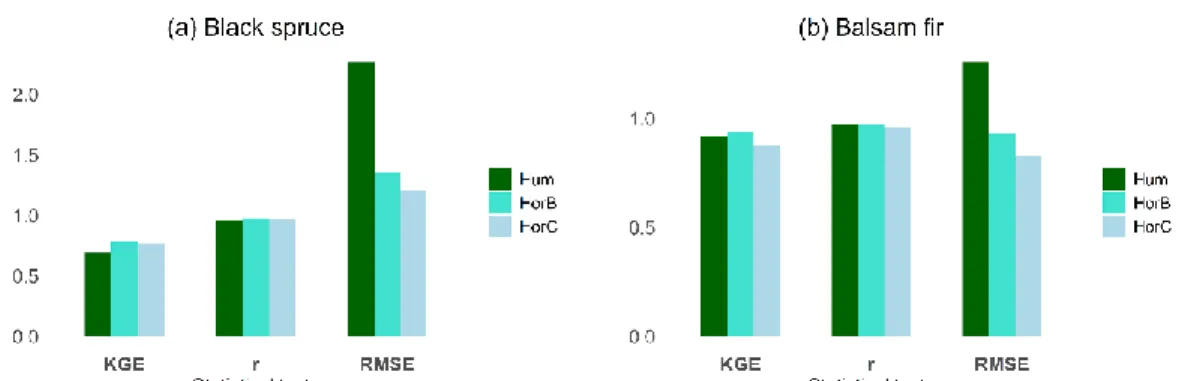
(top), horizon B (middle) and C (bottom) at the black spruce (observed Ts is mean of 3 soil profiles; a) and balsam fir (observed Ts is mean of 4 soil profiles; b) sites from 2001 to 2016 ... 42 2.3 Performance metrics of Kling-Gupta Efficiency (KGE), Pearson’s
correlation (r), and root mean square error (RMSE) at the black spruce (a) and balsam fir (b) sites for soil temperature for the three soil horizons (Hum, HorB and Horc) for the entire year ... 43
2.4 Observed and simulated daily soil water (%) for horizons B (top) and C (bottom) at the black spruce (a) and balsam fir (b) sites from 2001 to 2016. ... 44 2.5 Performance metrics of Kling-Gupta Efficiency (KGE), Pearson’s
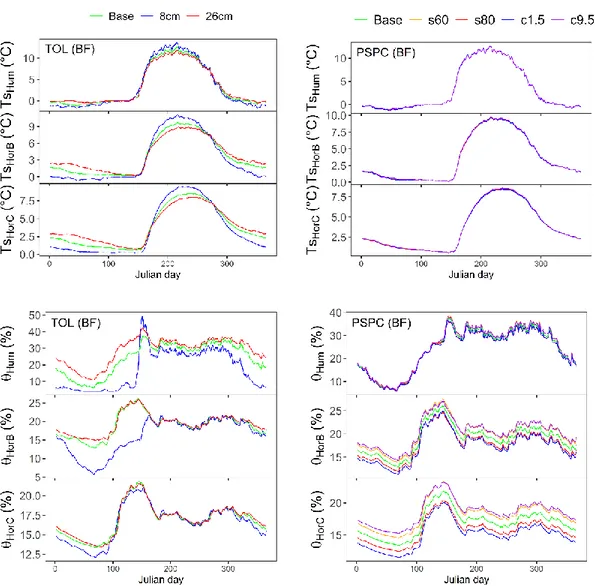
correlation (r), and root mean square error (RMSE) at black spruce (a) and balsam fir (b) sites for soil liquid water for the two soil horizons (HorB and Horc) for an entire year (Year), winter/spring (DJFMAM) and summer (JJAS) periods ... 45 2.6 Sensitivity analysis of the thickness of the organic layer (TOL; left panel)
and of % of sand and % of clay (PSPC; right panel) on multiyear (2001 to 2016) average daily soil temperature (top) and soil liquid water (bottom) at the balsam fir (BF) site. ... 48 2.7 Sensitivity analysis of the drainage parameter (DP; left panel) and of
freezing point (FP; right panel) for multiyear (2001 to 2016) average daily soil temperature (top) and soil liquid water (bottom) at the balsam fir site. 49 2.8 Taylor diagrams of observations vs simulations of all sensitivity analyses
for soil temperature (Ts; left) and soil liquid water (θ; right) for the three soil horizons (Hum, HorB and HorC) at the balsam fir site.. ... 50 2.9 Taylor diagrams of observations vs simulations of all sensitivity analyses
for soil liquid water (θ) during winter (DJFMAM; left) and summer months (JJAS; right) for the three soil horizons (Hum, HorB and HorC) at the balsam fir site ... 51 2S.1 Observed and simulated daily snow depth (m) at black spruce (a) and
balsam fir (b) sites from 2001 to 2016... 64 2S.2 Sensitivity analysis of thickness of organic matter (TOL; left panel) and
of % sand and % clay (PSPC; right panel) on multiyear (2001 to 2016) average daily soil temperature (°C; top) and soil liquid water (%; bottom) at black spruce (BS) site. ... 65 2S.3 Sensitivity analysis of drainage parameter (DP; left panel) and of freezing
point (FP; right panel) on multiyear (2001 to 2016) average daily soil temperature (°C; top) and soil liquid water (%; bottom) at black spruce (BS) site. ... 66
2S.4 Taylor diagrams of observations vs simulations of all sensitivity analyses for soil temperature (Ts; left) and soil liquid water (θ; right) for the three soil horizons (Hum, HorB and HorC) at the black spruce site. ... 67 2S.5 Taylor diagrams of observations vs simulations of all sensitivity analyses
for soil liquid water (θ) during winter (DJFMAM; left) and summer (JJAS; right) months for the three soil horizons (Hum, HorB and HorC) at the black spruce site. ... 68 2S.6 Multiyear (2001 to 2016) average daily soil heat fluxes (W m-2) entering
(positive) & leaving (negative) by thickness of organic layer (TOL; top left), drainage parameter (DP; top right), and freezing point (FP; bottom left) sensitivity analyses at the balsam fir (BF) site; multiyear (2001 to 2016) average daily energy used to melt ice (W m-2) in snow and soil layers for freezing point sensitivity analysis at the balsam fir (bottom right)... 69 2S.7 Multiyear (2001 to 2016) average frozen soil water (%) by thickness of
organic layer (TOL) and freezing point (FP) sensitivity analyses at the balsam (BF) fir site (top and bottom left) and black spruce site (top and bottom right); multiyear (2001 to 2016) average daily snow depth (m) for freezing point sensitivity analysis at balsam fir (middle left) and black spruce (middle right) sites ... 71 3.1 Daily soil water content from 1st May (Julian day 122) to 31st October
(Julian day 305) in soil horizons B (θHorB) and C (θHorC) at the balsam fir site for the year 2012 (red) and for the average of years 1999 to 2016 (excluding 2012) ... 83 3.2 An example of sap flow velocity (cm h-1; mean of the sun-side and
shade-side of each tree) for balsam fir (BF1, BF2 and BF3; top left) and black spruce (BS1, BS2 and BS3; bottom left) together with vapour pressure deficit (VPD, Pa) and solar radiation (Rad, W m-2) for one week in June (peak transpiration period) 2007; hourly mean sap flow velocity (average of the six probes) and hourly mean solar radiation for one-week in June 2007 and one-week in August 2007 for balsam fir (BF; top right) and black spruce (BS; bottom right) ... 85 3.3 Coefficient of determination (R2) between daily sap flow and each
environmental variable of the three sample trees at both balsam fir (left) and black spruce (right) site for each studied year. ... 86
3.4 Example of the relationship between daily sap flow (cm/d) and vapour pressure deficit (VPD; kPa) for each probe (sun and shade sides) for balsam fir (BF1 to BF3) and black spruce trees (BS1 to BS3) for the year 2007 using the Gompertz (3 parameters) equation ... 87 3.5 Example of the relationship between daily sap flow (cm/d) and solar
radiation (Rad; W m-2) for each probe (sun and shade sides) for balsam fir (BF1 to BF3) and black spruce (BS1 to BS3) for the year 2007 using the sigmoidal (3 parameters) equation... 88 3.6 Typical hysteresis loop of standardized sap flow velocity (SFNORM) data
with standardized VPD and Rad on an hourly basis for 2007 for the period from the beginning of the growing season to the end of August ... 89 3.7 Daily sap flow (SF, cm) with stem diameter variation (SDV, mm) for the
three balsam fir trees during the growing season (May-Sep) over a year (2012), together with variations in vapour pressure deficit (VPD, kPa), minimum and maximum air temperature (Tmin and Tmax, °C), soil water content (SWC, %) in the B horizon and precipitation (PCP, mm) ... 90 3.8 Moving average (15-day) of coefficient of determination (R2; average of
the six probes) for the regression between daily sap flow and the main environmental variables (VPD, Rad and SWC) for balsam fir during and one week prior to and after the drought (1st Jul to 4th Aug 2012; highlighted in grey) ... 91 3S.1 Total monthly precipitation and its anomalies from 2001 to 2016 (top
panel) and daily soil moisture anomalies during growing season (Jun to Aug) from 1999 to 2016 (bottom panel) at the balsam fir site ... 108 3S.2 Diel hysteresis of standardized sap flow velocity (SFNORM) with
standardized VPD from 2001 to 2013 (excluding 2007 which is shown in the main text) for balsam fir for the period from the beginning of the growing season to the end of August at the balsam fir site. ... 109 3S.3 Diel hysteresis of standardized sap flow velocity (SFNORM) with
standardized Rad from 2001 to 2013 (excluding 2007 which is shown in the main text) for the period from the beginning of the growing season to the end of August at the balsam fir site.. ... 110
3S.4 Diel hysteresis of standardized sap flow velocity (SFNORM) with standardized VPD (top panel) and Rad (bottom panel) from 2006 to 2009 (excluding 2007 which is shown in the main text) for the period from the beginning of the growing season to the end of August at the black spruce site.. ... 111 4.1 Simulated and observed air temperature within canopy (Tac - °C; top
panel); simulated and observed snow depth (m; 2nd panel); standardized modeled transpiration and standardized observed sapflow velocity (mean ± 1 SE [grey zone] of three trees; 3rd panel); simulated (liquid and ice) and observed (mean of four pedons) soil water content in the B horizon (%; 4th panel); and simulated and observed (mean of four pedons) soil temperature in the B horizon (°C; bottom panel) at the balsam fir site in 2004 (a) and 2010 (b). ... 126 4.2 Simulated and observed snow depth (m) from 2004 to 2013 at the balsam
fir site (top) and from 2006 to 2009 at the black spruce site (bottom) ... 128 4.3 Daily standardized modeled transpiration [unitless] and standardized sap
flow velocity [-; mean ± 1 SE (grey zone) of six probes] at the black spruce (a) and balsam fir sites (b) in 2007.. ... 130 4.4 Simple linear regression of standardized modeled transpiration
(TrSIM_NORM) vs standardized observed sap flow velocity (SFOBS_NORM, mean of three trees) during the growing period at black spruce (a; 2006 to 2009) and balsam fir (b; 2004 to 2013) sites.. ... 131 4.5 Vapour pressure deficit (VPD, kPa; top panel); standardized modeled
transpiration (Sim) and standardized observed sap flow velocity (Obs, mean of six probes; 2nd panel); observed soil water content (%) in the B and C Horizons and precipitation (mm, PCP; 3rd panel); 15-day moving average of regression coefficients between simulated and observed data (R2; bottom panel) at the balsam fir site during the drought (grey shaded area) of 2012 ... 134 4.6 Simulated ice (top panel) and liquid (middle panel) soil water content for
the three soil layers (Hum, HorB, HorC) and simulated transpiration (bottom panel) for the first hydrological year of the forced zero-precipitation simulation.. ... 135
4S.1 Daily standardized modeled transpiration [-] and daily standardized sapflow velocity [-; mean ± 1 SE (grey zone) of six probes] at the balsam fir site from 2004 to 2013 (excluding 2007) ... 146 4S.2 Daily standardized modeled transpiration [-] and daily standardized
sapflow velocity [-; mean ± 1 SE (grey zone) of six probes] at the black spruce site ... 147 4S.3 Simulated and observed air temperature within canopy (Tac-°C; 1st panel);
simulated and observed snow depth (m; 2nd panel); standardized modeled transpiration and standardized observed sapflow velocity (mean of six probes; 3rd panel); simulated (liquid and ice) and observed soil water content in the B horizon (%; 4th panel); and simulated and observed soil temperature in the B horizon (°C; bottom panel) at balsam fir in 2007. ... 148
Tableau Page
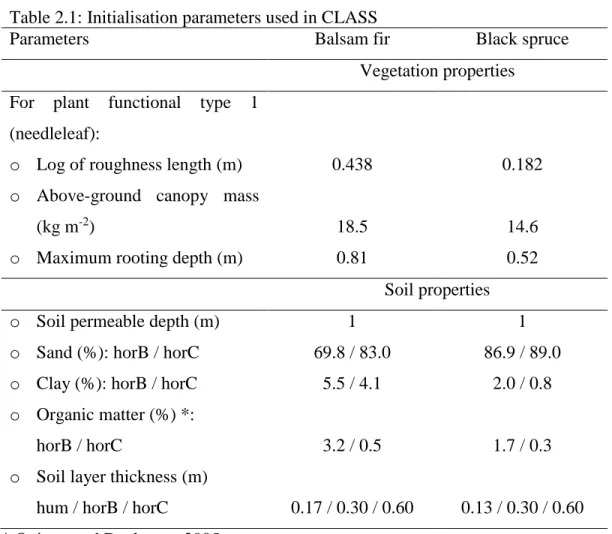
1.1 Climate and main tree species in the boreal forest ecozones of Canada ... 2 2.1 Initialisation parameters used in CLASS ... 37 2.2 Summary of sensitivity analyses carried out at the balsam fir and black
spruce sites ... 40 3.1 Description of forest stand characteristics for trees with a DBH > 9.1 cm
and the three instrumented trees at the two sites ... 79 3S.1 Description of soil characteristics at the two sites ... 104 3S.2 Regression coefficients of sap flow (daily and half-hourly) between the
sun-side and the shade side of the same tree and between trees from the beginning of the growing season to the end of August for each year at the balsam fir site ... 105 3S.3 Regression coefficients of sap flow (daily and half-hourly) between
sun-side and shade sun-side of the same tree and between trees from the beginning of the growing season to the end of August for each year at the black spruce site ... 106 3S.4 Mean seasonal regression coefficients (direction of correlation: positive or
negative) between daily sap flow and environmental variables for the six probes at the balsam fir and black spruce sites ... 107 3S.5 Characterization of average seasonal radial growth patterns for balsam fir
4.1 Initialisation parameters used in the model ... 123 4.2 Regression coefficients (R2) and slopes (b) of the simple linear regressions,
Euclidean Distances (ED) and Dynamic Time Warping (DTW) between standardized transpiration and standardized sap flow velocity for multiple years during the rehydration period of balsam fir and black spruce... 127 4.3 Regression coefficients (R2) and slopes (b) of the simple linear regressions,
Euclidean Distances (ED) and Dynamic Time Warping (DTW) between standardized transpiration and standardized sap flow velocity for multiple years during the period without snow from the beginning of the growing season to the end of August of balsam fir and black spruce ... 132
L’augmentation de la température de l’air et de l’occurrence des épisodes de sécheresses dans les dernières décennies à travers le monde ont stimulé la recherche sur les processus de surface, leurs interactions avec l’atmosphère, et aussi leurs effets sur les projections climatiques dans le futur. La transpiration est un processus important et la seule composante du cycle hydrologique qui relie les compartiments sols, végétation et atmosphère, les plantes relâchant dans l’atmosphère l’eau extrait du sol. La fiabilité des projections futures de la précipitation et de la température de l’air par les modèles climatiques dépendent de la précision et de l’exactitude de la modélisation de la transpiration par les schémas de surface intégrés à l’intérieur de ces modèles climatiques. Outre les variables climatiques (déficit de pression de vapeur, radiation solaire, température de l’air et vitesse du vent), les variables de la surface terrestre (e.g. contenue en eau et température du sol) ont aussi un effet important sur la transpiration. Tandis que le contenu en eau a un effet direct, la température du sol a un effet indirect à travers son influence sur le contenu en eau liquide du sol, et ceci particulièrement pour la forêt boréale. L’objectif général de ce projet est d’améliorer la compréhension du processus transpiration et des variables sous-jacentes dans un système naturel et à l’intérieur du schéma de surface Canadien (CLASS). L’étude a porté sur deux forêts boréales de l’est du Canada dominée par le sapin baumier et l’épinette noire. Premièrement, les simulations des variables sous-jacentes produites par CLASS, tel que le contenu en eau et la température du sol, ont été étudiées et validé par des mesures in situ à long terme. De plus, des analyses de sensibilité ont été aussi faites pour déterminer la sensibilité du modèle à des paramètres reliés au contenu en eau. Deuxièmement, le contrôle environnemental de la transpiration a été évalué pendant plusieurs saison de croissance ainsi que pendant un épisode de sécheresse dans un milieu naturel, en utilisant le flux de sève mesuré pendant plusieurs saisons de croissance. Troisièmement, le processus de la transpiration a été étudié dans le schéma de surface Canadien et validé avec ces mesures de flux de sève à long terme.
Les résultats montrent que CLASS simule très bien la température du sol et plus ou moins bien le contenu en eau, la qualité des simulations variant selon le site, la saison et l’horizon du sol. Le contenu en eau est grandement sous-estimé pendant l’hiver dans les deux sites malgré que CLASS simule bien les variations saisonnières. Les analyses de sensibilités montrent que l’épaisseur de la couche organique, le pourcentage de sable et d’argile, le drainage et le point de congélation ont eu des effets importants sur le contenu eau. Ceci démontre que ces paramètres sont importants dans le modèle, et
illustre l’importance de leur fidèle représentation dans le modèle pour obtenir des simulations fiables des variables d’étude et des processus qui contrôlent ces variables. L’évaluation du contrôle environnemental de la transpiration dans le système naturel montre que le déficit de pression de vapeur et la radiation solaire sont fortement corrélés aux variations quotidiennes de la transpiration pendant toutes les saisons de croissances étudiées et également pendant l’épisode de sécheresse Juillet 2012 comparé aux autres variables environnementales (température de l’air maximale, précipitation, contenu en eau, température de l’air minimale et vitesse du vent). CLASS simule adéquatement la transpiration pendant toute la période de croissance pour toutes les années d’études, sauf pendant la période de réhydratation (avant le début de croissance), le coup de chaleur et la sécheresse. Pendant la période de réhydratation, CLASS sous-estimait la transpiration, dû à la surestimation de durée de la présence de neige sur le sol dans le modèle. Durant le coup de chaleur et la sécheresse, CLASS surestimait la transpiration, malgré l’augmentation de la température de l’air et la baisse de contenu en eau dans le modèle, respectivement. Ceci montre que le modèle est insensible à la baisse du contenu en eau du sol, et également incapable de reproduire le comportement éco-physiologique des arbres lors d’épisodes climatiques extrêmes. La surestimation de la transpiration dans CLASS, malgré le stress hydrique, mènera à une surestimation de la précipitation par le modèle climatique. Ainsi, dans l’avenir, le modèle régional climatique Canadien (MRCC) aura tendance à sous-estimer le nombre de sécheresses intenses. Cette étude montre que CLASS a des failles importantes au niveau de la représentation du contenu en eau et aussi de la transpiration dans des circonstances particulières. La transpiration et le contenu en eau dans le modèle doivent être améliorés pour augmenter la qualité des projections climatiques, car ils ont des rétroactions directes sur l’atmosphère. Dans cette étude, plusieurs recommandations ont été faites à cet égard.
Mots-clés : contenu en eau, température du sol, transpiration, flux de sève, CLASS, sapin baumier, épinette noire, sécheresse, forêt boréale.
Rising air temperature and the increasing occurrence of drought in the past few decades across the globe have led to an increasing interest in investigating land surface processes, their interactions with the atmosphere, and their impacts on future climate projections. Transpiration is an important land surface process and the only component in the hydrological cycle that links soil-vegetation-atmosphere, via the transport of water from the soil, through the plant, to the atmosphere. Accurate projection of future precipitation and air temperature by climate models depends on the accurate simulation of transpiration by land surface schemes integrated within climate models. In addition to climatic variables (vapour pressure deficit, solar radiation, air temperature, and wind speed), land surface variables (soil water and soil temperature) also have an important impact on transpiration. Soil water has a direct impact while soil temperature has an indirect impact on transpiration through its impact on liquid soil water, particularly in the boreal region. The general objective of this PhD research project is to improve the understanding of the transpiration process and the driving factors in a natural system and in a model: the Canadian Land Surface Scheme (CLASS). This study focused on two boreal forests in eastern Canada, the first dominated by balsam fir and the second by black spruce. First, the simulation of the underlying variables of transpiration, such as soil water content and soil temperature, were studied and validated using long-term in-situ measurements. In addition, sensitivity analyses were also performed to determine the model’s sensitivity to parameters related to soil water content. Secondly, the environmental control on transpiration was evaluated in a natural system over multiple growing seasons as well as during a drought period, using long-term sap flow measurements. Third, the transpiration process was validated within CLASS, using these same long-term sap flow measurements.
The results showed that CLASS simulated well soil temperature, while the performance of soil water varied with site, season and soil horizon. Despite CLASS greatly underestimating soil water during winter at both sites, the seasonal variation of simulated soil water corresponded well with observations. The sensitivity analyses showed that thickness of organic layer, percentage of sand and percentage of clay, drainage parameter, and freezing point had substantial impacts on soil water. This shows that these parameters are important in the model and their accurate representation in CLASS is crucial in order to obtain reliable simulations of studied variables and linked processes. The evaluation of environmental control on transpiration in the natural system showed that vapour pressure deficit and solar
radiation were the main drivers of transpiration on a daily basis, throughout all growing seasons as well as during the July 2012 drought compared to other environmental variables (maximum air temperature, precipitation, soil water content, minimum air temperature and wind speed). Transpiration was adequately simulated by CLASS during all growing seasons, except during the rehydration period (prior to the growing season), and during heat stress and drought conditions. For the rehydration period, CLASS underestimated transpiration due to overestimating the duration of snow cover on the ground. For heat stress and drought conditions, CLASS overestimated transpiration, despite the increase in air temperature and the decrease in soil water content in the model. This shows the model’s insensitivity to the decrease in soil water content as well as its inability to reproduce the eco-physiological behaviour of trees during extreme climatic events. The overestimation of transpiration in CLASS, despite water stress, will result in an overestimation of precipitation by the coupled climate model. Hence, in the future, the Canadian Regional Climate Model (CRCM) will tend to underestimate the frequency of intense drought events. This study showed that CLASS is significantly limited by its representation of soil water content and transpiration in specific conditions. Both transpiration and soil water need to be improved in the model in order to increase the accuracy of climate projections, as they have a direct feedback to the atmosphere. In this study, several recommendations were made in this regard.
Keywords : soil water, soil temperature, transpiration, sap flow, CLASS, balsam fir, black spruce, drought, boreal forest.
GENERAL INTRODUCTION
1.1 Trees in boreal forest ecosystems
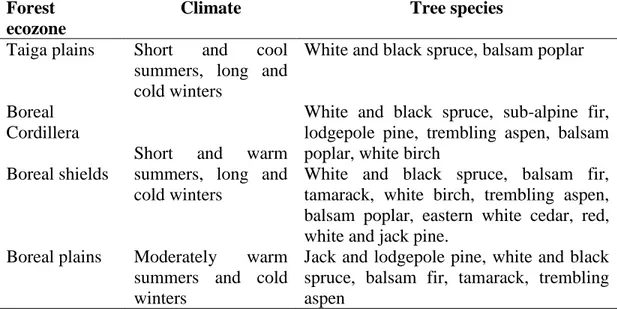
While more than 100 tree species are found across different ecozones in the Canadian forest, boreal tree species are much less numerous and are located in the taiga plains, boreal cordillera, boreal plains and boreal shield forest ecozones (Johnston, 2009; Figure 1.1). The boreal forest ecozones are composed mostly of white and black spruce, balsam fir and trempling aspen (Table 1.1).
For my PhD research project, black spruce and balsam fir were the tree species studied as they are the two most important commercial species in the region. These are located in the boreal shield forest ecozone, which comprises mostly closed-canopy conifer stands. In general, the boreal ecozones have acidic soils caused by the accumulation of lignin-rich needles in the soil (Tyrrell, 2020) and undergo frequent forest fires and insect outbreaks such as spruce budworm. In addition, unlike other forest ecosystems where there is only expansion of stem diameter annually (except during drought, Sánchez-Costa et al., 2015), boreal trees have a unique annual stem diameter variation based on their climate (cold and long winters and short summers). Trees growing in boreal climate exhibit shrinkage in stem diameter during winter, followed by expansion of stem diameter in the spring (returning to the stem diameter attained the previous year) and further stem expansion during summer.
Figure 1.1: Major forest ecozones across Canada (Johnston, 2009)
Table 1.1: Climate and main tree species in the boreal forest ecozones of Canada (Johnston, 2009)
Forest ecozone
Climate Tree species
Taiga plains Short and cool summers, long and cold winters
White and black spruce, balsam poplar
Boreal Cordillera
Short and warm summers, long and cold winters
White and black spruce, sub-alpine fir, lodgepole pine, trembling aspen, balsam poplar, white birch
Boreal shields White and black spruce, balsam fir, tamarack, white birch, trembling aspen, balsam poplar, eastern white cedar, red, white and jack pine.
Boreal plains Moderately warm summers and cold winters
Jack and lodgepole pine, white and black spruce, balsam fir, tamarack, trembling aspen
1.1.1 Annual cycle of stem diameter variation
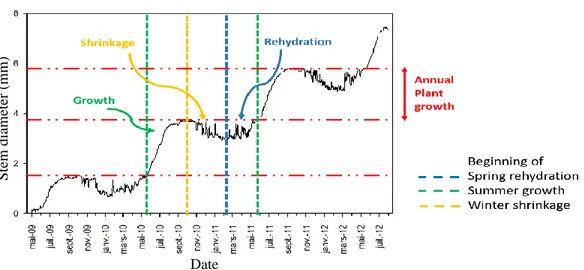
The annual cycle of stem diameter variation of trees in the boreal region can be classified into three phases: 1) autumn/winter shrinkage/dehydration; 2) spring rehydration; and 3) summer tree growth (wood formation) (Figure 1.2).
Figure 1.2: Phenology of stem diameter variation of boreal trees over three years with shrinkage, rehydration, and growth illustrated for one of those years
1.1.1.1 Autumn/winter dehydration
During autumn/winter, prior to the rehydration phase, trees normally exhibit stem shrinkage when temperatures are below -5 °C due to the dehydration of living cells (cambium, phloem and parenchyma; Figure 1.3) (Zweifel and Hasler, 2000). However, during this period, there are also episodes of stem expansion probably associated with freeze-thaw events. Stem expansion occurs when a potential water gradient is built up once ice has formed in the xylem, thus drawing water from the outer portion of the stem into the xylem (Zweifel and Hasler, 2000). The water drawn in can be stored in the air-filled intercellular spaces of the xylem, as ice or in a liquid state.
Date Stem d iam eter ( m m )
Figure 1.3: Cross-sectional views of wood composition. Reprinted from “Comparison of phloem and xylem hydraulic architecture in Picea abies stems” by T. Jyske and T. Hölttä, 2015, New phytologist, 205(1), 102-115. CB is base of the living crown
1.1.1.2 Spring rehydration
In the boreal forest, the rehydration phase consists of stem expansion after the cold, dry winter season but there is no new cell production in the cambium (Ziaco et al, 2016). Rehydration is the recharge of the depleted internal stem water stores. The beginning of the rehydration period normally coincides with the beginning of the snowmelt period, while the ending of rehydration period coincides with the initial phase of cambial initiation/wood formation, where the latter in turn depends again on air temperature and date of snowmelt (Turcotte et al., 2009). Since stem radius expansion in the boreal forest might be a consequence of both rehydration and wood formation at the beginning of the growing season, the process causing stem expansion during this transition period may be masked (Mäkinen et al., 2003).
1.1.1.3 Tree growth (wood formation period)
In boreal forests, the growing season when wood formation occurs (i.e. production of new xylem cells or xylogenesis) is limited to the period of the year when daily minimum air temperature is above a threshold value (4 - 5 °C) (Rossi et al., 2008). The duration of xylogenesis may range from 3 to 5 months depending on the region and the elevation, whereby it starts after approximately one month of rehydration (Turcotte et al, 2009) and ends around the beginning of September (Rossi et al., 2008). A wider cambial zone and higher cell production throughout the growing season were found to be associated with early snowmelt and high temperature (Vaganov et al., 1999). While soil temperature is not the main driving variable for xylogenesis (as air temperature is the main driving variable; Lupi et al., 2012), it was observed to have an indirect impact on xylogenesis due to the interchange of water between the plant and the soil (Ziaco et al., 2016). In the presence of frozen soil or low soil moisture content, trees may use water stored in the stem (mainly from the sapwood) for photosynthesis (Waring et al., 1979). The amount of xylem stored water varies with tree age and height (Phillips et al., 2003), and basal sapwood area (Goldstein et al., 1998).
1.2 Soil temperature and soil water
Global warming in recent decades has resulted in an increase in air and soil temperature (Qian et al., 2011) as well as increased aridity across the globe including western Canada (Dai, 2011; Michaelian et al., 2011), leading to high tree mortality (Allen et al., 2010). In the boreal forest region, despite the fact that soil temperature is not the main factor limiting tree growth compared to air temperature (Lupi et al., 2012), it affects the exchange of liquid water between the soil and the plant (Ziaco et al., 2016). In turn, soil temperature is greatly influenced by air temperature, ground cover (snow or litter),
soil water content, and freezing/melting processes. As for soil water, it is an important variable controlling tree growth, whereby the latter is suppressed under water stress condition. The plant’s available water in the soil depends on the intensity, duration and frequency of rainfall, the water holding capacity of the soil and the evaporative demand. The soil water holding capacity itself is a function of soil texture, organic matter and the degree of soil compaction. In the boreal forest region, both soil temperature and soil water are important variables that affect transpiration, which in turn has an important feedback to the climate system.
1.3 Transpiration
Kramer (1983) defined transpiration as the ‘loss of water in the form of vapor from plants’ (Ward and Trimble, 2004). Evapotranspiration is the combined process of transpiration and evaporation that occurs on vegetation-covered land surfaces, whereby evaporation is the loss of water from the soil surface and canopy. In forest ecosystems, the contribution of transpiration is much greater than evaporation (Ward and Trimble, 2004). In a boreal forest, evaporation from the canopy and the forest floor were found to be 20 % and 15 %, respectively, while tree transpiration was found to be 65 % of the total forest evapotranspiration during the growing season (Grelle, et al. 1997).
Evapotranspiration is an important component of the hydrological cycle that links the land surface with the atmosphere. As mentioned by Granier et al. (1996), a strong coupling was found between the forest and the atmosphere, whereby the vertical transfer of water flux to the atmosphere is strongly controlled by the vapour pressure deficit and canopy conductance. However, the impact of environmental variables on transpiration varies with climatic region, tree species (Ewers et al., 2005), and age of trees (Delzon and Loustau, 2005; Ewers et al., 2005). For example, in tropical regions,
the air is warmer and drier, resulting in much higher vapour pressure deficit than in the boreal region. Similarly, the growing season with favourable air temperature is longer (i.e. throughout the year) in the tropical region. These combined conditions (higher vapour pressure deficit and optimum air temperature) lead to higher transpiration in tropical forests than in boreal forests. The intrinsic properties of tree species (iso/anisohydricity of trees) has a great influence on the impact of environmental variables on transpiration, such that isohydric trees stop transpiring much earlier during a drought, while anisohydric trees continue to transpire despite decreasing soil water content (Tardieu and Simmoneau, 1998). In the study of Ewers et al. (2005), younger black spruce trees had greater stomatal control of transpiration compared to older ones (> 70 years) in the Canadian boreal forest. On the other hand, transpiration decreased with age in a maritime pine forest due to decreasing stomatal conductance and leaf area index (Delzon and Loustau, 2005).
1.3.1 Environmental control on transpiration
As mentioned earlier, transpiration is controlled by many environmental variables, such as solar radiation, vapour pressure deficit, air temperature, soil water and wind speed. Many studies have been conducted on transpiration to determine the key variables affecting this process. As mentioned in the preceding section, vapour pressure deficit is the physical variable that drives most transpiration followed by solar radiation (Tsuruta et al., 2016; Wang et al., 2017). This being said, contrasting results have been found for the influence of air temperature. Tsuruta et al. (2016) found air temperature to be an important variable in the temperate Japanese cypress forest while Wang et al. (2017) suggested it was less important than other variables in boreal Scots pine forests of Scotland for transpiration. Besides climatic variables, soil water was identified as an important land surface variable for transpiration, but only when rainfall was scarce (Gartner et al., 2009; Wang et al., 2017), implying the presence of a threshold beyond which soil water begins to drive transpiration. According to Lagergren and Lindroth
(2002), a reduction in transpiration begins only after plant available water in the soil drops below 20 %.
1.3.2 Plant physiological control on transpiration
Though water stress conditions affect plant physiology, which in extreme drought conditions can lead to mortality, its impact depends on the characteristics of the plant species. Plants have varying stomatal responses to drought, with isohydric plants being more preventive of drought effects and anisohydric plants being more tolerant (Tardieu and Simmoneau, 1998). When isohydric plants reach a severe minimum water potential, they close their stomata to reduce water loss via transpiration and thus protect the xylem from cavitation. However, with the cessation of photosynthesis but the continuation of respiration, there will be depletion of the carbon stores, which in a long drought can lead to death. On the other hand, anisohydric plants keep their stomata open even under water stress conditions, thus maintaining photosynthesis and respiration (Tardieu and Simmoneau, 1998). However, by keeping stomata open, anisohydric plants are more exposed to cavitation that can lead to death of the plant (McDowell et al., 2008). Tree species were found to occur in “a continuum from isohydric to anishohydric behaviors” based on the response of stomata to their leaf water potential (Klein, 2014). Both our study tree species were found to be anisohydric in this humid boreal forest of eastern Canada, with the degree of anisohydricity being greater in black spruce than in balsam fir (unpublished data). A logarithmic model was fitted to the relationship of standardized total conductance versus vapour pressure deficit in order to determine the degree of anisohydricity (smaller slope of the fitted logarithmic model implies higher degree of anisohydricity).
1.3.3 Measurement of transpiration via sap flow techniques
While eddy covariance techniques are widely used to measure transpiration at the stand level, transpiration can also be measured using sap flow techniques at the tree level.
There are numerous sap flow techniques that exist, which can be classified into continuous or heat-pulse (Vandegehuchte and Steppe, 2013). Among the continuous sap flow techniques, there are thermal dissipation and heat field deformation techniques, whereby continuous heat is applied to the heater probe. For the heat-pulse technique, there are compensation heat pulse, Tmax, heat ratio, calibrated average gradient, Sapflow+ methods, whereby heat pulse is applied to the heater probe. Among all the sap flow techniques (Figure 1.4), only the heat field deformation (Vandegehuchte and Steppe, 2013) and the recent heat pulse sapflow sensors (East 30 sensors, 2021) measure the radial sapflux density profile. Though each technique has its own advantages and flaws, all of them cause wounds to the tree (Vandegehuchte and Steppe, 2013). Moreover, Steppe et al. (2010) found thermal dissipation, heat field deformation and heat pulse to greatly underestimate sap flux density and recommended carrying out species-specific calibration when using these techniques. Unlike other techniques, thermal dissipation requires a zero flow condition to determine the maximum temperature difference. The zero flow condition is when there is no sap flow in the stem, which occurs during the night for most tree species, except for those having nocturnal transpiration (Kavanagh et al., 2007; Konarska et al., 2016). Our studied species did not exhibit any nocturnal transpiration based on our sap flow data, thus met the zero flow condition. While thermal dissipation measures from low to high sap flows, heat field deformation and Sapflow+ measures reverse, low to high sap flows (Vandegehuchte and Steppe, 2013). The reverse sap flow is the downward movement of sap that occurs mostly at night, for the purpose of hydraulic redistribution in stems (Burgess and Bleby, 2006). Similarly, low flows mostly occur at night (Forster, 2014), thus they are more relevant for species exhibiting nocturnal transpiration. In this study, the thermal dissipation technique is used for the measurement of sap flow. Moreover, in terms of performance, the thermal dissipation technique is comparable to heat field deformation and heat pulse techniques (Steppe et al., 2010).
Figure 1.4: Three main sap flow techniques: thermal dissipation (TD); heat field deformation (HFD); and heat pulse velocity (HPV). Xd and Xu are the downstream and upstream distance of the needle from the heater. Zax and Ztg are the axial and tangential distance of needle from the heater. Reprinted from “A comparison of sap flux density using thermal dissipation, heat pulse velocity and heat field deformation methods” by K. Steppe, D.J. De Pauw, T.M. Doody and R.O. Teskey, 2010, Agricultural and Forest Meteorology, 150(7-8), pp.1046-1056.
Many studies have been carried out using sap flow techniques to determine tree transpiration or canopy conductance (Saugier et al., 1997; Köstner et al., 1998; Granier et al., 2000; Daley and Phillips, 2006; Macfarlane et al., 2010; Jung et al., 2011) or to evaluate the impact of environmental variables on sap flow (Hogg and Hurdle, 1997; Wullschleger et al., 2000; Lagergren and Lindroth, 2002; Bovard et al., 2005; Wang et al., 2005; Chen et al., 2011; Jonard et al., 2011; van Herk et al., 2011; Patankar et al., 2015; Juice et al., 2016; Wang et al., 2017; Collins et al., 2018). However, most studies on the environmental controls over sap flow have been carried out in the temperate
region. Although a few studies have been conducted in the boreal forest, the study sites were either in dry boreal forests focusing on vapour pressure deficit and air/soil temperature only (Hogg and Hurdle, 1997; van Herk et al., 2011) or in boreal peatlands exhibiting rapid permafrost thaw (Patankar et al., 2015). Those studies conducted in humid boreal regions were on other tree species (Lagergren and Lindroth, 2002; Wang et al., 2017). No studies on the relationship between sap flow and environmental variables have been carried out on dominant boreal species black spruce or balsam fir in cold-humid boreal forests such as those found in eastern Canada.
1.4 Representation of land surface processes in land surface schemes
1.4.1 Land surface processes
Although the land surface accounts for only 29 % of the Earth’s surface compared to the ocean, many studies have shown that its impact on the atmosphere is important due to changing surface albedo and heating in contrast to the ocean (Sellers, 1965 in Verstraete and Dickinson, 1986). Surface albedo varies based on the type of surface, with snow having the highest albedo followed by desert, vegetation, dry soil, wet soil, and finally water. Moreover, some of these surface albedos vary seasonally such as snow and deciduous vegetation in winter. Although vegetation surfaces cover at most 20 % of the Earth’s surface, they have a complex interaction with the atmosphere compared to flat surfaces like snow, soil and water bodies. As leaf area index (projected area of leaves over a unit of land, m2/m2) ranges from 1 to 10, the total areal coverage of vegetation may exceed the total surface area of the Earth. Verstraete and Dickinson, 1986.
Interactions between land surface and atmosphere in vegetation-covered areas occur in four ways. Firstly via transpiration, where a large portion of the continental water goes
to the atmosphere as vegetation has the ability to extract water from deeper soil profiles compared to soil evaporation that occurs only from shallow soil layers. Second via its albedo, where a considerable amount of leaf albedo (reflected radiation) in the visible (10-15 %) and near infrared portion (30- 50 %) of the electromagnetic spectrum goes to the atmosphere. Third via heat energy, with higher exchange between the canopy and the atmosphere during both the dry season (as sensible heat) and wet season (as latent heat) compared to bare land surfaces. Fourth via increased vegetation surface roughness, which leads to reduced momentum in the lower atmosphere. Bare soil surfaces are flat, thus have a small surface roughness. On the other hand, vegetation-covered surfaces have irregular heights, and thus have higher surface roughness, leading to a greater interaction with the lower atmosphere and thereby reducing the motion (momentum) of air masses. Overall, compared to the ocean, the land surface exhibits a high spatial and temporal variability in its interaction with the atmosphere. These land-atmosphere interactions (or land surface processes) will in turn have major feedbacks on the climate system. Verstraete and Dickinson, 1986.
1.4.2 Land Surface Schemes
The land surface can be described as “the surface that comprises vegetation, soil and snow, coupled with the way these influence the exchange of energy, water and carbon within the Earth system” (Pitman, 2003). Land surface schemes (LSSs), which numerically represent the hydrosphere, cryosphere, lithosphere and biosphere, are models that were especially designed to work within climate models. Climate models are themselves numerical models that were developed for climate projections as well as to simulate past climate. These climate models, in general, are complex due to the numerous processes and components that represent the entire climate system (Laprise, 2008), with processes being physically-based, empirical or statistical (Dutrieux, 2016). According to Chapin et al. (2000), the land surface - atmosphere coupling is controlled via water and heat exchange from local to regional scales, and via carbon dioxide and
methane at a global scale. As a result, these LSSs within climate models enable us to study the impact of land cover changes, such as deforestation, afforestation or agricultural intensification, on the climate system (Pitman, 2003).
In order to represent land surface processes, numerous LSSs have been built by different research groups with varying levels of complexity across the globe to couple with their climate models. These LSSs range from a simple bucket Model (1st generation LSS; Manabe, 1969), to those that add a vegetation layer that computes transpiration using an empirical equation (2nd generation LSS; Dickinson et al., 1986; Sellers et al., 1986), and finally to schemes that add a semi-mechanistic photosynthesis model (3rd generation LSS; Collatz et al., 1991). The 2nd generation LSSs have an empirical approach to the computation of stomatal conductance based on the Jarvis (1976) formulation, where it is controlled by environmental stresses (solar radiation, humidity, air temperature and soil water potential). However, the individual functions of these environmental stresses vary among the various LSSs. Examples of 2nd generation LSSs are Biosphere-Atmosphere Transfer scheme (BATS; Dickinson et al., 1986), Simple Biosphere Model (SiB; Sellers et al., 1986), and Canadian Land Surface Scheme (CLASS; Verseghy, 1991; Verseghy et al., 1993). The 3rd generation LSSs use a biochemical approach for stomatal conductance, in which conductance is controlled by the net assimilation rate, partial pressure of carbon dioxide at the leaf surface, and relative humidity/vapour pressure deficit. However, the 3rd generation LSSs are more complex in their input data requirements. Examples of 3rd generation LSSs are coupled CLASS-Canadian Terrestrial Ecosystem Model (CTEM; Arora, 2003), CSIRO Atmosphere Biosphere Land Exchange (CABLE; Kowalczyk et al., 2006), the Joint UK Land Environment Simulator (JULES; Best et al., 2011), and Community Land Model (CLM; Oleson et al., 2013).
In my study, since my focus is transpiration instead of photosynthesis, CLASS (version 3.6) is used in place of the CLASS-CTEM version. Thus, CLASS, which was built to
be coupled with the Canadian Regional Climate Model (CRCM; Zadra et al., 2008), is used to evaluate soil temperature, soil water and the temporal variation of transpiration. CLASS models the hydrological cycle in a one-dimensional column, at a time step of 30 mins. The model consists of a layer of vegetation, a single snow layer of variable depth and multiple soil layers of varying thicknesses. The vegetation in the model is grouped into four categories: broadleaves, conifers, crops, and grass. Each model grid is divided into four sub-grids based on land cover types: 1) bare soil; 2) soil covered with snow; 3) soil covered with vegetation; 4) and vegetation over snow-covered soil. The energy and mass balances are calculated for each sub-grid and the composite energy and mass balance are determined for each grid by doing a weighted average based on the area occupied by each land cover type (Verseghy, 1991; Verseghy et al., 1993). Figure 1.5 shows the main processes modelled in CLASS, such as evaporation from soil and canopy, transpiration, albedo of snow, ground and canopy, sensible and latent heat flux, infiltration and vertical drainage, interception of water and snow by canopy, etc..
1.4.3 Impact of land surface processes in Land Surface Schemes on climate models Many studies have shown that the representation of land surface variables and processes in an LSS have considerable impact on climate projections in climate models (Brochu and Laprise, 2007; Roy et al., 2012). Using an LSS coupled with a climate model, simulated regional deforestation resulted in a decrease in evapotranspiration and an increase in surface temperature (Dickinson and Henderson-Sellers, 1988; Brovkin et al. 2009), whilst global-scale deforestation led to a net decrease in Earth’s average temperature (Bala et al. 2007) due to an increase in surface albedo in the higher latitudes (Betts, 2000). On the other hand, simulated afforestation in a global climate model in high northern latitudes led to increased transpiration and warming of the arctic region (Swann et al., 2010) due to decreased surface albedo (Betts, 2000).
Figure 1.5: Schematic diagram of CLASS. Reprinted from “CLASS–The Canadian land surface scheme (version 3.6)” by D. Verseghy, 2012. Environment Canada Science and Technology Branch Tech. Rep.
These findings underscore the importance of forested ecosystems on the climate system via the impact of afforestation/deforestation on both air/surface temperature and transpiration/evapotranspiration. On the other hand, transpiration in LSSs is greatly influenced by soil water (Ukkola et al., 2016). The study of Ukkola et al. (2016) showed that accurate simulation of soil water is crucial for the simulation of latent heat flux and evapotranspiration in LSSs, especially during dry periods, across different
ecosystems (including forests). Furthermore, increasing soil water was found to have positive feedbacks on precipitation in climate models most of the time from global, regional to continental scales (e.g. Schär et al., 1999 in Seneviratne et al., 2010), although in a few exceptions negative feedbacks occurred (Cook et al., 2006).
Thus, in this study, the transpiration process in the CLASS LSS will be evaluated for its performance in the boreal forest ecosystem of eastern Canada. Since in the boreal region, both soil water and soil temperature are important variables that greatly influence transpiration, the simulation of these variables will be assessed using CLASS.
1.5 Objectives of the study
The aim of my thesis is to analyse transpiration and its underlying driving environmental variables in a natural system, and to evaluate simulated transpiration and land surface variables (soil water and soil temperature) in a numerical model. The natural system is two humid boreal forests located in Quebec, Canada, while the numerical model is the Canadian Land Surface Scheme (CLASS). This study comprises three phrases, where the goal of the first phase is to evaluate the performance of CLASS as well as the model’s sensitivity to certain model parameters for simulating the land surface variables soil water and soil temperature over multiple years. The goal of the second phase is to understand the impact of environmental variables on boreal tree sap flow (as a proxy for transpiration) during the growing season and during extreme events such as drought based on long-term observations. The goal of the third phase is to evaluate the performance of CLASS in simulating the temporal evolution of transpiration during tree rehydration and the growing season over multiple years, and a drought period.
1.6 Study area - Laflamme and Tirasse
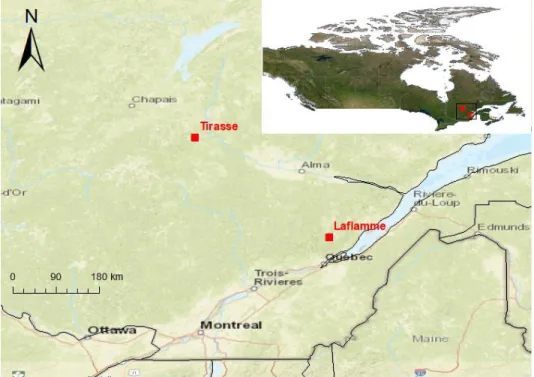
The study area comprises two boreal forests sites situated in two different watersheds, located in the province of Quebec in Canada (Figure 1.6). The first site, the Laflamme watershed, located north of Québec city (47°19’41’’ N and 71°07’37’’ W), is dominated by balsam fir, with some white spruce and paper birch (Duchesne et al., 2012). The site elevation is 784 m above sea level, with mean annual temperature of 1.3 °C and mean annual precipitation of 1300 mm. The forest floor is covered with mosses and lichen. The second site, the Tirasse watershed, located in the wildlife reserve Ashuapmushuan (49°12’45’’ N and 73°39’00’’ W), consists of black spruce (66.4%) and Jack pine as the dominant vegetation and a thick layer of mosses on the forest floor (Duchesne and Houle, 2006; Houle and Moore, 2008). The site elevation is at 411 m above sea level, with mean annual temperature of 1.3 °C and mean annual precipitation of 941 mm.
Figure 1.6: Location of the two study areas (red squares) in the Quebec province, Canada.
1.7 References
Allen, C. D., A. K. Macalady, H. Chenchouni, D. Bachelet, N. McDowell, M. Vennetier, T. Kitzberger, A. Rigling, D. D. Breshears, E. H. Hogg, P. Gonzalez, R. Fensham, Z. Zhang, J. Castro, N. Demidova, J.-H. Lim, G. Allard, S. W. Running, A. Semerci and N. Cobb, 2010. A global overview of drought and heat induced tree mortality reveals emerging climate change risks for forests. Forest Ecology and Management 259(4): 660-684.
Arora, V.K., 2003. Simulating energy and carbon fluxes over winter wheat using coupled land surface and terrestrial ecosystem models. Agricultural and Forest Meteorology, 118(1-2), pp.21-47.
Bala, G., Caldeira, K., Wickett, M., Phillips, T.J., Lobell, D.B., Delire, C. and Mirin, A., 2007. Combined climate and carbon-cycle effects of large-scale deforestation. Proceedings of the National Academy of Sciences, 104(16), pp.6550-6555.
Best, M.J., Pryor, M., Clark, D.B., Rooney, G.G., Essery, R.L.H., Ménard, C.B., Edwards, J.M., Hendry, M.A., Porson, A., Gedney, N. and Mercado, L.M., 2011. The Joint UK Land Environment Simulator (JULES), model description– Part 1: energy and water fluxes. Geoscientific Model Development, 4(1), pp.677-699.
Betts, R.A., 2000. Offset of the potential carbon sink from boreal forestation by decreases in surface albedo. Nature, 408(6809), pp.187-190.
Bovard, B.D., Curtis, P.S., Vogel, C.S., Su, H.B., Schmid, H.P., 2005. Environmental controls on sap flow in a northern hardwood forest. Tree Physiol. 25 (1), 31– 38. https://doi.org/10.1093/treephys/25.1.31.
Brochu, R. and Laprise, R., 2007. Surface water and energy budgets over the Mississippi and Columbia river basins as simulated by two generations of the Canadian Regional Climate Model. Atmosphere-ocean, 45(1), pp.19-35. Brovkin, V., Raddatz, T., Reick, C.H., Claussen, M. and Gayler, V., 2009. Global
biogeophysical interactions between forest and climate. Geophysical Research Letters, 36(7).
Burgess, S.S.O. and Bleby, T.M., 2006. Redistribution of soil water by lateral roots mediated by stem tissues. Journal of Experimental Botany, 57(12), pp.3283-3291.
Chapin iii, F. S., McGuire, A. D., Randerson, J., Pielke Sr, R., Baldocchi, D., Hobbie, S. E., Roulet N., Eugster W., Kasischke E., Rastetter E.B., Zimov S.A., Running, S. W., 2000. Arctic and boreal ecosystems of western North America as
components of the climate system. Global Change Biology, 6(SUPPLEMENT 1), 211-223. doi: 10.1046/j.1365-2486.2000.06022.x
Chen, L., Zhang, Z., Li, Z., Tang, J., Caldwell, P., Zhang, W., 2011. Biophysical control of whole tree transpiration under an urban environment in Northern
China. J. Hydrol. (Amst.) 402 (3–4), 388–400
https://doi.org/10.1016/j.jhydrol.2011.03.034.
Collatz GJ, Ball JT, Grivet C, Berry JA. 1991. Physiological and environmental regulation of stomatal conductance, photosynthesis and transpiration: a model that includes a laminar boundary layer. Agricultural and Forest Meteorology 54: 107–136.
Collins, A.R., Burton, A.J., Cavaleri, M.A., 2018. Effects of Experimental Soil Warming and Water Addition on the Transpiration of Mature Sugar Maple. Ecosystems 21 (1), 98–111. https://doi.org/10.1007/s10021-017-0137-9. Cook, B.I., Bonan, G.B. and Levis, S., 2006. Soil moisture feedbacks to precipitation
in southern Africa. Journal of Climate, 19(17), pp.4198-4206.
Dai, A., 2011. Characteristics and trends in various forms of the Palmer Drought Severity Index during 1900–2008. Journal of Geophysical Research: Atmospheres, 116(D12).
Daley, M.J., Phillips, N.G., 2006. Interspecific variation in nighttime transpiration and stomatal conductance in a mixed New England deciduous forest. Tree Physiol. 26 (4), 411–419.
Delzon, S. and Loustau, D., 2005. Age-related decline in stand water use: sap flow and transpiration in a pine forest chronosequence. Agricultural and Forest Meteorology, 129(3-4), pp.105-119.
Dickinson, R. E., A. Henderson-Sellers, P. J. Kennedy, M.F. Wilson., 1986. Biosphere-atmosphere transfer scheme (BATS) for the NCAR community climate model Tech Note/TN-275+STR. Nat. Cent. for Atmos.Res., Boulder, Colo.
Dickinson, R.E. and Henderson‐Sellers, A., 1988. Modelling tropical deforestation: A study of GCM land‐surface parametrizations. Quarterly Journal of the Royal Meteorological Society, 114(480), pp.439-462.
Duchesne, L. and D. Houle, 2006. Base cation cycling in a pristine watershed of the Canadian boreal forest. Biogeochemistry 78(2): 195-216.
Duchesne, L., Houle, D. and D’Orangeville, L., 2012. Influence of climate on seasonal patterns of stem increment of balsam fir in a boreal forest of Québec, Canada. Agricultural and forest meteorology, 162, pp.108-114.
Dutrieux, P., 2016. Évaluation de simulations du Modèle Régional Canadien du Climat (MRCC5) au-dessus de l'Atlantique Nord. Maîtrise, Université du Québec à Montréal.
East 30 sensors, 2021. East 30 Sapflow sensors. Available at <Sap Flow Sensors (east30sensors.com)> [Accessed 12 February 2021].
Ewers, B.E., Gower, S.T., Bond‐Lamberty, B. and Wang, C.K., 2005. Effects of stand age and tree species on canopy transpiration and average stomatal conductance of boreal forests. Plant, Cell & Environment, 28(5), pp.660-678.
Forster, M.A., 2014. How significant is nocturnal sap flow?. Tree physiology, 34(7), pp.757-765.
Gartner, K., Nadezhdina, N., Englisch, M., Čermak, J. and Leitgeb, E., 2009. Sap flow of birch and Norway spruce during the European heat and drought in summer 2003. Forest Ecology and Management, 258(5), pp.590-599.
Granier, A., P. Biron, N. Bréda, J. Y. Pontailler and B. Saugier, 1996. Transpiration of trees and forest stands: short and long-term monitoring using sapflow methods. Global Change Biology 2(3): 265-274.
Granier, A., Biron, P., Lemoine, D., 2000. Water balance, transpiration and canopy conductance in two beech stands. Agric. For. Meteorol. 100 (4), 291–308. Grelle, A., Lundberg, A., Lindroth, A., Morén, A.S. and Cienciala, E., 1997.
Evaporation components of a boreal forest: variations during the growing season. Journal of Hydrology, 197(1-4), pp.70-87.
Goldstein, G., J. L. Andrade, F. C. Meinzer, N. M. Holbrook, J. Cavelier, P. Jackson and A. Celis, 1998. Stem water storage and diurnal patterns of water use in tropical forest canopy trees. Plant, Cell & Environment 21(4): 397-406.
Jarvis, P.G., 1976. The interpretation of the variations in leaf water potential and stomatal conductance found in canopies in the field. Philosophical Transactions of the Royal Society of London. B, Biological Sciences, 273(927), pp.593-610.
Johnston, M., 2009. Vulnerability of Canada's tree species to climate change and management options for adaptation: An overview for policy makers and practitioners. Canadian Council of Forest Ministers.
Jonard, F., André, F., Ponette, Q., Vincke, C., Jonard, M., 2011. Sap flux density and stomatal conductance of European beech and common oak trees in pure and mixed stands during the summer drought of 2003. J. Hydrol. (Amst.) 409 (1– 2), 371–381.