HAL Id: hal-01907178
https://hal.archives-ouvertes.fr/hal-01907178
Submitted on 7 Nov 2018HAL is a multi-disciplinary open access archive for the deposit and dissemination of sci-entific research documents, whether they are pub-lished or not. The documents may come from teaching and research institutions in France or abroad, or from public or private research centers.
L’archive ouverte pluridisciplinaire HAL, est destinée au dépôt et à la diffusion de documents scientifiques de niveau recherche, publiés ou non, émanant des établissements d’enseignement et de recherche français ou étrangers, des laboratoires publics ou privés.
Chromium bioavailability in aquatic systems impacted
by tannery wastewaters. Part 2: New insights from
laboratory and in situ testing with Chironomus riparius
Meigen (Diptera, Chironomidae)
Benoît J.D. Ferrari, Davide Vignati, Jean-Louis Roulier, Marina Coquery,
Ewa Szalinska, Andrzej Bobrowski, Anna Czaplicka, Janusz Dominik
To cite this version:
Benoît J.D. Ferrari, Davide Vignati, Jean-Louis Roulier, Marina Coquery, Ewa Szalinska, et al.. Chromium bioavailability in aquatic systems impacted by tannery wastewaters. Part 2: New insights from laboratory and in situ testing with Chironomus riparius Meigen (Diptera, Chironomidae). Science of the Total Environment, Elsevier, 2019, 653 (653), pp.1-9. �10.1016/j.scitotenv.2018.10.258�. �hal-01907178�
1
This is the final peer-reviewed version of the article:
1
Chromium bioavailability in aquatic systems impacted by tannery wastewaters. Part 2:
2
new insights from laboratory and in situ testing with Chironomus riparius Meigen
3
(Diptera, Chironomidae)
4 5
Published in Science of the Total Environment, doi: 6
https://doi.org/10.1016/j.scitotenv.2018.10.258
7 8
Ferrari B.J.D.a,b, Vignati D.AL.a,c, Roulier J.-L.d, Coquery M.d, Szalinska E.e, Bobrowski A.f, 9
Czaplicka A.g, Dominik, J.a,h 10
11
a) Department F.-A. Forel for Environmental and Aquatic Sciences, University of Geneva, 12
Uni Carl Vogt, 66 boulevard Carl-Vogt CH-1211 Geneva, Switzerland 13
14
b) Swiss Centre for Applied Ecotoxicology Eawag-EPFL (Centre Ecotox), EPFL-ENAC-15
IIE-GE, Station 2, 1015 Lausanne, Switzerland 16
17
c) Université de Lorraine, CNRS, LIEC, F-57000 Metz, France 18
19
d) Irstea, UR RiverLy, centre de Lyon-Villeurbanne, F-69625 Villeurbanne, France 20
21
e) Department of Environment Protection, Faculty of Geology, Geophysics and 22
Environmental Protection, AGH University of Science and Technology, 30 A. 23
Mickiewicza Av. , 30-059 Krakow, Poland. 24
2 f) Department of Building Materials Technology Faculty of Materials Science and Ceramics, 26
AGH University of Science and Technology, 30 A. Mickiewicza Av. , 30-059 Krakow, 27
Poland 28
29
g) Department of Water Supply, Sewerage and Environmental Monitoring, Cracow 30
University of Technology, 24 Warszawska ul., 31-155 Krakow, Poland 31
32
h) Institute of Marine Science - National Research Council (ISMAR-CNR) Arsenale - Tesa 33
104, Castello 2737/F, 30122 Venice, Italy 34 35 36 37 38 39 40 41 42 43 44 45 46 47 48 49 50
3
Abstract
51
Chromium is widely used as a tanning agent and can become a contaminant of concern in 52
aquatic ecosystems receiving discharges from industrial or artisanal tanning activities. In a 53
companion study, we showed that Cr discharged by tanneries was bioavailable to indigenous 54
chironomids with accumulation via sediment ingestion likely to represent the predominant 55
exposure route. However, Cr accumulation by chironomids did not directly reflect the degree 56
of sediment contamination and the potential adverse effects of Cr accumulation on 57
chironomids were not evaluated. In the present study, chironomids were exposed to 58
homogenised, field-collected sediments in the laboratory and to intact sediments in situ using 59
a customised caging system. Chromium concentrations were assessed in sediments, exposed 60
larvae of laboratory-reared Chironomus riparius and overlying waters of in situ cages. 61
Experimental results of Cr bioaccumulation were compared with expected Cr body burden in 62
chironomids calculated using biodynamic modelling. Our data provided strong support to the 63
hypothesis that Cr bioaccumulation in the field is specifically controlled by the deposition of 64
contaminated suspended particulate matter (SPM) containing a pool of Cr readily bioavailable 65
to surface deposit feeders. Considering freshly deposited SPM as an additional route of 66
exposure for surface deposit feeders leads to a good agreement between the modelling and 67
experimental results. Additionally, a Cr body burden of about 77 µg g-1 d.w was identified as 68
a tentative threshold above which effects on the growth of C. riparius may appear. While both 69
laboratory and in situ experiments provide evidence for the availability of Cr in aquatic 70
system impacted by tannery wastewaters, standard laboratory exposure conditions may miss 71
additional exposure routes in the field and underestimate possible adverse effects on benthic 72
organisms. 73
Keywords. Chironomids; Bioaccumulation; Suspended matter; Body residue; Sediment;
74
Reservoir 75
4
1. Introduction
76
Bioaccumulation and toxicity of trace elements strongly depend on their speciation and on the 77
actual exposure conditions experienced by target organisms; e.g. continuous vs. discontinuous 78
inputs, contaminant uptake via different exposure routes (water vs. food), biological traits 79
(e.g. feeding habit, respiration, growth, reproduction) of the species of interest (Fairbrother et 80
al., 2007). Standardized laboratory experiments cannot account for all these factors although 81
their importance is well-recognized and their predictive ability can be improved by a careful 82
characterization of the actual exposure conditions in the selected laboratory settings (Simpson 83
and Batley, 2007). Similarly, pulse and chase experiments using radiolabelled elements allow 84
the study of the relative importance of different exposure routes, notably water exposure vs. 85
food ingestion, in a variety of organisms (Baumann and Fisher, 2011; Wang et al., 1997), but 86
cannot reproduce the complex array of environmental factors that influences bioavailability 87
and toxicity in situ. To address these problems, the scientific community has engaged in 88
actively developing tools to narrow the gap between laboratory and field studies. At present, 89
microcosm and in situ techniques are sufficiently mature and versatile to be of use as 90
supporting studies in tiered risk assessment procedures (Burton Jr et al., 2012; Crane et al., 91
2007; Ferrari and Faburé, 2017; Ferrari et al., 2014). An appropriate integration between 92
laboratory and in situ approaches can help to better understand the bioavailability and toxicity 93
of specific contaminants in ecosystems impacted by complex mixtures of contaminants such 94
as tannery effluents (Vignati et al., 2007). 95
Adverse biological effects on aquatic organism in tannery contaminated systems are well 96
documented (Khwaja et al., 2001; Koukal et al., 2004; Leghouchi et al., 2009). However, 97
tannery effluents have a very complex composition and specifically ascribing the observed 98
effects to Cr, typically used as a tanning agent in its trivalent form, remains difficult. 99
Understanding of Cr bioavailability and toxicity in the field is further complicated by the 100
5 possible simultaneous presence of trivalent and hexavalent Cr forms that are characterized by 101
different environmental mobility and toxicity (Vignati et al., this issue). On the other hand, 102
Michailova et al. (2011) showed a genotoxic response in chironomids growing in a tannery-103
impacted system (the Dunajec river, southern Poland), where Cr and Cd were the only trace 104
elements of concern. Although genotoxic and cancerogenic effects are mostly attributed to 105
Cr(VI) exposure ((De Flora et al., 1990), genotoxic effects of Cr(III) organic compounds were 106
also observed, along with changes in DNA and protein levels, in the yeast Saccharomyces 107
cerevisiae (Chatterjee and Luo, 2010). The number of studies documenting a high toxicity of 108
Cr(III) in standard laboratory settings is also increasing (Aharchaou et al., 2018; Bencheikh-109
Latmani et al., 2007; Kováčik et al., 2015; Ponti et al., 2014; Vignati et al., 2010), suggesting 110
that Cr(III) is less harmless than admitted by the current scientific consensus. Significant 111
polytene chromosome aberrations were found in Chironomus riparius exposed to Cr(III) 112
contaminated sediments in laboratory conditions (Michailova et al., 2001). 113
In part 1 of the present study (Vignati et al., this issue), we showed that Cr discharged by 114
tanneries is bioavailable to chironomids, but that the accumulation patterns do not simply 115
reflect the contamination in abiotic matrices. By combining laboratory tests and in situ studies 116
with caged, transplanted larvae of the model species Chironomus riparius Meigen (Diptera, 117
Chironomidae), we specifically tested: a) if bioaccumulation in the field can be controlled by 118
the ingestion of freshly-deposited contaminated SPM containing a pool of Cr readily 119
bioavailable to surface deposit feeders such as chironomids and, b) at which level Cr 120
accumulation may have adverse effects on the growth of C. riparius. 121
122
2. Material and Methods
123
2.1 Model organisms and study area 124
6 The non-biting midge larvae Chironomus riparius were used as model species for all 125
experiments. This species is commonly used for ecotoxicological purposes, can be reared in 126
laboratory conditions and has easily measurable and well modelled life-cycle traits. 127
Chironomus riparius has been considered as a model organism in several internationally 128
validated guidelines for assessing the toxicity of chemicals and for evaluating the quality of 129
natural sediments (see Ferrari et al. 2017 and references therein). 130
Larvae used in the tests originated from a culture maintained in our laboratory. The culture 131
was started from egg masses kindly provided by Dr. J. Garric (Irstea, formerly Cemagref, 132
Lyon, France). The methods for maintaining the culture and preparing the organisms for 133
experiments are detailed in Ferrari et al. (2014). For this study, two kinds of experiments were 134
conducted, either by starting with young second instar larvae (7-day laboratory tests) or by 135
starting with young fourth instar larvae (4-day laboratory and in situ tests). The larval stages 136
were determined by checking the length of the larvae and by controlling on few specimens the 137
head capsule width. Each set of experiment was designed to allow assessment of 138
bioaccumulation of Cr, but the toxicity of the whole sediment on chironomids (growth and 139
survival) was recorded at the same time. The chronological steps for implementing the tests 140
are depicted in Figure S1. 141
In situ exposure and sample collection for the concomitant laboratory experiments were 142
carried out in the Czorsztyn reservoir (Southern Poland, Fig. 1) which receives the tannery 143
contaminated wastewaters of the Dunajec river (about 300 small tanneries in the Nowy Targ 144
region) and of other smaller creeks. The in situ exposure/sampling site was located in 145
Maniowy Bay (Fig. 1) which is locally fed by a small creek collecting the effluent from a 146
rural wastewater treatment plant (Fig. 1). Tanneries are also present in the region of Maniowy, 147
although only some of them confer their wastes to the wastewater treatment plant. More 148
7 details on Cr contamination in the Czorsztyn reservoir can be found elsewhere (Dominik et 149
al., 2007; Szalinska et al., 2010) and in part 1 of this study (Vignati et al., this issue). 150
151
152
Figure 1. Study area (Czorsztyn reservoir; southern Poland) and location of the Maniowy Bay area where in situ
153
exposures performed and samples collected for laboratory experiments. The Nowy Targ region, where the many
154
artisanal tanneries are active, is also indicated.
155 156
2.2 In situ bioaccumulation 157
In situ exposure of C. riparius was carried out with a customized Sediment Water Interface 158
Study System (S-WISS1.1) suitable for exposing surface deposit feeders to intact sediments 159
for periods up to 4 days and allowing for food delivery to caged organisms during this period. 160
Construction details and functioning were described in detail in Ferrari et al. (2014). Briefly, 161
each exposure chamber consisted in a transparent polyvinyl chloride tube surmounted by a 162
customized corer-head to deliver the chironomids, ensure water exchange between the 163
8 exposure chambers and the surrounding waters and suspensions (150 µm Nitex mesh) and 164
deliver the required food doses. 165
Twelve S-WISS1.1 were deployed at Maniowy (water depth approx. 3 m) by scuba divers. 166
In addition, twelve control cages consisting in 1-L high-density polyethylene (HDPE), large-167
mouth bottles containing clean sand and partly covered with 150 µm Nitex mesh (Ferrari et 168
al., 2014) to ensure water exchange were deployed in the vicinity of the S-WISS1.1 devices. 169
Food delivery in the control cages was also ensured by adopting the design described in 170
Ferrari et al. (2014). At t=0, 20 individuals of C. riparius (4th instar larvae) were introduced 171
into each exposure system (i.e. S-WISS1.1 and control cages). Food doses (1 mg Tetramin® 172
per individual) were delivered immediately after deployment and then every 24 hours until the 173
end of the exposure period (4 days). At t=24, 48, 72, and 96 hours, three exposure chambers 174
and three control cages were randomly recovered. 175
Upon arrival at the laboratory, each S-WISS1.1 was opened and an aliquot of the overlying 176
water was sampled, filtered at 1.2 µm, acidified to 1% v/v with concentrated (65 %) Suprapur 177
HNO3 and stored in a polypropylene (PP) container at 4°C pending Cr analysis. After
178
siphoning-off the remaining water, an aliquot of the top layer of sediments (0–0.5 cm) was 179
gently scraped with a plastic spatula, passed through a 1 mm sieve to remove debris, and 180
possibly chironomids, and stored in a PP container at –22 °C pending Cr analysis. 181
The sediment from the surface layer was chosen because it represents the most relevant 182
exposure zone for surface deposit-feeders such as C. riparius (Rasmussen, 1984). The whole 183
sediment core was then sieved (500 µm) to recover surviving chironomids. No indigenous 184
chironomids were found in the cores. Recovered organisms were rinsed with site water and 185
placed for 5 min in trays filled with ultrapure water (MilliQ water, Millipore), followed by 10 186
min in 1 mM EDTA, and additional 5 min in ultrapure water. After gently blotting with paper 187
towels, each larva was measured using a digital image analysis system and organisms were 188
9 pooled and conditioned for Cr analysis (see Ferrari et al., 2014 for more details). Individual 189
length (n=20) and initial Cr body residue of unexposed larvae (2 pools of 30 individuals) were 190
determined at the start of each experiment. 191
192
2.3 Laboratory bioaccumulation studies 193
Laboratory experiments were set up using both field-collected sediments from Maniowy 194
and clean sand. Maniowy sediments were collected with an Ekman grab during the 195
deployment of the in situ test systems and stored at 4 °C. Upon return to the laboratory, the 196
overlying water was decanted and sediment were sieved at 1mm and homogenised on the day 197
before the start of the tests. Sediments (clean sand for controls) were transferred into 1-L 198
HDPE bottles analogous to those used for the control cages in the field experiment and 199
covered with filtered (1.2 µm) Lake Geneva water at a minimum ratio of 1:4. The following 200
day, 20 individuals of C. riparius were introduced into each exposure bottle and fed daily as 201
the chironomids exposed in situ. Young second instar larvae were used for performing a 7-day 202
bioaccumulation tests, while young fourth instar larvae were used for a 4-day tests. 203
All exposures were performed in triplicate at 21 °C under a 16:8-h light-dark photoperiod 204
and light intensity of 500 lux. Air was continuously bubbled into each beaker during the test 205
taking care to avoid sediment resuspension. The water level was controlled daily in each 206
beaker and adjusted with deionised water if necessary. Larvae were fed daily ad libitum with 207
0.6 mg of commercial food (Tetramin®) per individual (Péry et al., 2002). 208
For the 4-day bioaccumulation tests, organisms were retrieved and handled for length 209
measurement (i.e. each individual) and Cr content (i.e. pool of 20 individuals) as in situ 210
exposed ones at day 1, 2, 3 and 4. For the 7-day exposure tests, organisms were retrieved and 211
handled in the same way only at the end of the test. For each exposure condition, the surface 212
layer sediments (or sand) were sampled for total Cr analysis. 213
10 214
2.4 Chemical analyses 215
Chromium concentration in sediments and chironomids were assayed using the same 216
methodologies described in Vignati et al. (this issue). Total Cr concentrations in overlying 217
waters (filtered at 1.2 µm) in S-WISS1.1 cages were determined by ICP-MS, while Cr(VI) 218
levels were determined by catalytic adsorptive stripping voltammetry (Bobrowski et al., 219
2012). Accumulation by chironomids was corrected for gut sediment content according to 220
(Hare et al., 1989) assuming that ingested sediments represented 6% of the total weight of 221
individual organisms (see Ferrari et al., 2014). For quality control procedures, reference 222
materials LKSD-4 (Lynch, 1990) and WQB3 (NRC, Canada) were used for sediments, 223
TORT-2 (NRC, Canada) for biological material and SLRS3 (NRC, Canada) and 1643e 224
(NIST) for waters. Reference material 1643e was analyzed following a 10-fold dilution. 225
226
2.5 Modelling of bioaccumulation 227
According to the biodynamic bioaccumulation modelling — DYMBAM (Baumann and 228
Fisher, 2011; Wang et al., 1997), accumulation of a contaminant by living organism can be 229
described by the following formula: 230
231
(1) 232
233
where Cbiota is the concentration accumulated by organisms (in µg g-1), ku is the uptake rate 234
constant from the dissolved phase (in L g-1 d-1), Cw is the concentration in the water phase 235
(filtered water, in µg L-1), kew and kes are the efflux rate constants following uptake from the 236
dissolved phase and from food (sediments in the case of deposit feeders; both in d-1), AE is the 237 g k C IR AE g k C k C es s ew w u biota
11 assimilation efficiency (in % total content) from food (i.e., sediment), IR is the food ingestion 238
rate (in g g-1 d-1), Cs is the concentration in sediments (in µg g-1) and g is the growth rate 239
constant (in d-1). 240
Although model parameters were not available for C. riparius, first-order estimates of 241
expected Cr accumulation were obtained based on the following considerations. 242
Accumulation from the aqueous phase was neglected considering that sediments should be the 243
dominant route of contaminant uptake for chironomids (Dabrin et al., 2012; De Jonge et al., 244
2010; Martin et al., 2008). An ingestion rate of 0.325 g g-1 d-1 estimated for C. riparius at 10 245
°C (Bervoets et al., 2003) was adopted and corrected for the field/laboratory temperature of 246
this study (21 °C) as described in the supporting information. A value of 0.1%, determined 247
using the biomimetic approach described in the companion paper (Vignati et al., this issue), 248
was used for the AE of Cr from Maniowy sediments. Estimation of the organisms’ growth 249
rate constant (g) was performed by fitting an exponential curve to the plot of weight of 250
individual chironomids’ larvae vs. time (Fig. S2). Finally, the kes constant was neglected
251
considering that literature values for Cr egestion by various organisms (Baumann and Fisher, 252
2011; Roditi and Fisher, 1999; Wang et al., 1997) did not exceed 0.019 d-1 and thus were 4 to 253
8-fold lower than the growth rates calculated from our experimental data (Fig. S2). The 254
conclusions of the present study would not have been altered by considering kes in model
255
calculations (see section 4.1) and this approach was preferred to the arbitrary choice of 256
parameters derived for organisms other than C. riparius. 257
258
2.6 Statistics 259
Data were analyzed using Student’s t-test, analysis of variance (one-way ANOVA 260
followed by post-hoc Tukey’s HSD test) and linear regression. All data were checked for 261
normality and homogeneity of variance by the Shapiro-Wilk test and the Bartlett test, 262
12 respectively. If conditions for ANOVA were not fulfilled, the data were log-transformed and 263
reanalysed. For all statistical tests, the significance level was set at 0.05 and calculations were 264
performed using the software package R (v 2.9.0). 265 266 3. Results 267 3.1. Quality control 268
Figures of merit and overall accuracy of Cr analysis in aqueous matrices were analogous to 269
those reported in Vignati et al. (this issue). Percentage Cr recovery from LKSD-4 was about 270
120% when based on the concentrated HNO3/concentrated HCl extractable fraction (21±2 µg
271
g-1) and 75% when based on total Cr content determined by X-ray diffraction (33±6 µg g-1; 272
n=2 in both cases). For WQB3, measured Cr concentrations were 96±8 % (n=5) of the 273
indicative value of 119 µg g-1. Triplicate analyses of sediment subsamples from selected cages 274
agreed to 10% or better. Chromium recovery from TORT-2 (0.77±0.15 µg g-1) was 96±3 % 275
(n=3). Due to the insufficient biological material, no replicate analyses of exposed 276
chironomids were possible. However, the small standard deviation on the three replicates of 277
TORT-2 material suggests an acceptable precision in the digestion of the biological material. 278
279
3.2 Bioaccumulation under in situ and laboratory conditions 280
Chromium concentrations in sediments recovered inside the S-WISS1.1 units were 281
homogeneous among the cages and across the four days of exposure (325±35 µg g-1, n=11). 282
The Cr content of homogenised sediments from Maniowy used for the laboratory exposures 283
was uniform (150±14 µg g-1 d.w., n=12), albeit about half of that measured in the sediment 284
recovered from in situ cages. Chromium levels in sand used for control exposures were 285
1.2±0.5 µg g-1 (n=12) in the field and 0.8±0.1 µg g-1 (n=12) in the laboratory (Fig. S3). 286
13 Bioaccumulation kinetic patterns in chironomids exposed to Maniowy sediments were 287
similar for laboratory and in situ exposures, with a marked increase over the first day 288
followed by a plateau in accumulated Cr levels. Daily and overall variability were however 289
higher for organisms exposed in situ (Fig. 2). 290
291
Figure 2. Cr accumulation vs. time in Chironomus riparius larvae exposed to sand and sediment in experiments
292
performed in situ (Maniowy Bay, June 2007) and in the laboratory using sand and field collected sediment. In all
293
experiments, each point represents the measure of Cr internal concentration obtained for the pooled organisms
294
retrieved in each exposure system. Concentrations in chironomids were gut corrected according to Hare et al.
295
(1989).
296 297
14 At plateau (days 2–4), chironomids exposed in the laboratory to homogenised sediments 298
from Maniowy accumulated an average Cr concentration of 78±16 µg g-1 (n=12), comparable 299
to the concentration of 98±43 µg g-1 (n=11) measured in chironomids exposed in situ to 300
undisturbed field sediments using the S-WISS1.1 system. At the opposite, bioaccumulation 301
kinetic patterns in chironomids exposed to clean sand showed a marked difference between 302
the laboratory and in situ exposures. Indeed, no increase in Cr concentration was observed 303
during laboratory exposures with control chironomids accumulating less than 1 µg g-1 (Fig. 304
2). On the contrary, chironomids exposed in cages filled with clean sand but placed on the 305
reservoir bottom close to the S-WISS1.1 devices accumulated an average of 77±25 µg Cr g-1 306
(n=12). This value is comparable to the concentrations obtained for chironomids exposed to 307
the Maniowy sediments, whether in laboratory experiments or after in situ exposures (Fig. 2). 308
Results obtained by exposing 4th instar larvae in situ or in the laboratory also compared 309
favourably with those of 2nd instar larvae exposed for 7 days to homogenised sediments in the 310
laboratory (Fig. 3). Indeed, three days after the start of any type of exposure protocol using 311
young 4th instar larvae (see sections 2.2 and 2.3), all larvae were 9 days old after hatching 312
(Fig. S1). Thus, 4th instar larvae exposed over 3 days to sediments in situ or in the laboratory 313
were as old as 4th instar larvae remaining at the end of the 7-day bioaccumulation test in the 314
laboratory which was started with young 2nd instar larvae (Fig. S1). 315
For 3 days exposures of 4th instar larvae, Cr concentrations in organisms exposed to 316
sediment and sand (i.e., controls) were 128±33 µg g-1 vs. 101±21 µg g-1 for in situ 317
experiments and 77±5 µg g-1 vs. 0.42±0.07 µg g-1 for laboratory experiments (Fig. 3). A 318
statistically significant difference in Cr accumulation (Tukey HDS test on log-transformed 319
data, p<0.05) existed between controls and exposed chironomids only in laboratory 320
experiments. Despite the variability in the Cr content of sediment substrates (Fig. S3), Cr 321
accumulation was not significantly different between organisms caged in the field (control 322
15 and exposed) and organisms exposed to homogenised Maniowy sediments in the laboratory 323
(Tukey HDS test on log-transformed data, p>0.05). For 7 days experiments started using 2nd 324
instar larvae, measured Cr accumulation at day 7 was 66±8 µg g-1 and 0.67±0.17 µg g-1 in 325
organisms exposed to sediments and control sand, respectively. Chromium accumulation in 326
2nd instar larvae exposed to Maniowy sediment for 7 days was significantly lower than in 4th 327
instar larvae exposed for 3 days to undisturbed field sediments (Tukey HDS test on log-328
transformed data, p<0.05), but did not show significant differences with other experimental 329 conditions (Fig. 3). 330 331 332 333
Figure 3. Cr accumulation at day 3 in Chironomus riparius larvae exposed to sand and sediment in experiments
334
performed in situ (Maniowy Bay, June 2007) and in the laboratory using field collected material. The 4-day tests
335
were initiated with young fourth instar larvae, while the 7-day tests were initiated with young second instar
336
larvae. Error bars represent 1 standard deviation (n=3). Internal concentrations that do not share the same letter
16
are significantly different (ANOVA followed by post-hoc Tukey’s HSD test, p<0.05). The dotted line
338
symbolizes the level below which no effects were observed by considering the results obtained for growth rates
339
(see Fig. S2).
340 341
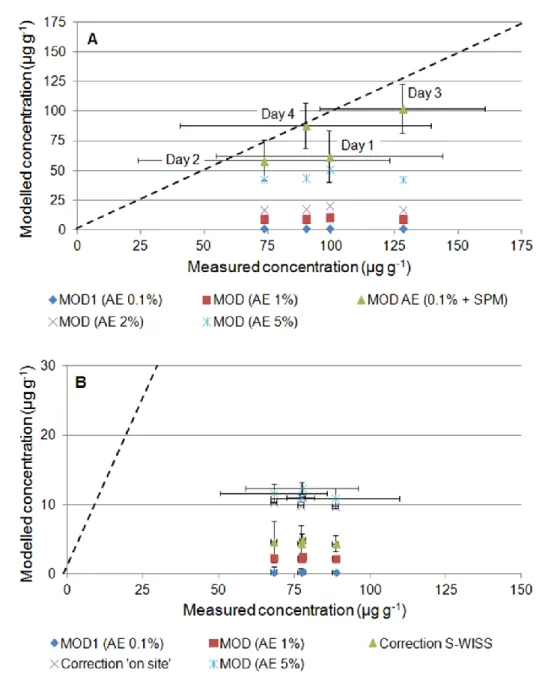
3.3. Modelling chromium bioaccumulation via sediment ingestion 342
The modelled Cr accumulation via sediment ingestion by C. riparius exposed to Maniowy 343
sediments did not exceed 1 µg g-1 for neither in situ nor laboratory exposures. These values 344
were 1% (or less) of measured ones and strongly underestimated the actual Cr burden in both 345
scenarios (Fig. 4a, 4b). Because the biomimetic approach used to derive the AE of 0.1% 346
employed in model calculation (see section 2.5) may overlook other factors resulting in higher 347
assimilation efficiencies (Vignati et al., this issue), additional model calculations were 348
performed using AE values of 1, 2 and 5%. These AEs were reported in studies on Cr uptake 349
by various organisms and from different substrates including sediments and algae (Baumann 350
and Fisher, 2011; Roditi and Fisher, 1999; Wang et al., 1997). Even for the maximum AE 351
value of 5%, modelled concentrations were 40–60% lower than the measured ones (Figure 4a, 352
b). 353
Chironomids exposed to clean sand in laboratory experiments did not show any 354
appreciable Cr bioaccumulation suggesting that neither the ingestion of sand substrate (in 355
field controls) nor the added Tetramin® food (all experimental conditions) contributed to the 356
observed Cr burdens. Measured Cr concentration in laboratory control chironomids actually 357
decreased from 0.9±0.5 µg g-1 at day 1 to 0.4±0.06 µg g-1 at day 4 (data not shown). At t=0, 358
control chironomids had a Cr content of about 2 µg g-1, which was diluted by the ingestion of 359
‘clean’ food and by growth. On the other hand, measured concentration in field control 360
organisms were comparable to those of organisms exposed to Maniowy sediments (Fig. 3). As 361
it will be discussed in detail in section 4.1, we surmise that accumulation from freshly 362
17 deposited SPM was responsible for the Cr burden measured in the field control chironomids 363
and also contributed the majority of accumulated Cr to organisms exposed in situ to 364
unperturbed sediments. 365
366
367
Figure 4. Comparison of measured vs. modelled Cr concentrations in Chironomus riparius exposed to
368
undisturbed Maniowy sediments in situ (S-WISS1.1 cages – panel A) and to homogenised Maniowy sediments
369
in the laboratory (panel B). All values are in µg g-1. MOD, modelled accumulation of Cr obtained using different
370
values for assimilation efficiency (AE) in formula 1; SPM, Cr accumulation in field control organisms (assumed
371
to originate from ingestion of freshly deposited Suspended Particulate Matter — see text for details); Correction
18
‘on site’ and ‘S-WISS’, modelled accumulation using formula 1 and corrected for changes in bioavailability due
373
to sediment manipulation according to Ferrari et al. (2014). The dashed lines show the theoretical 1:1
374
correspondence between modelled and measured concentrations.
375 376
3.4 Effects on chironomids 377
Survival of chironomids in laboratory controls was almost complete (19.6±0.7 individuals; 378
n=12) over the 4 days of exposure and only slightly reduced (18.1±2.2 individuals, n=12) for 379
exposure to Maniowy sediments in the laboratory. Average survival in field controls was 380
16.3±3.7 individuals (n=12); significantly higher than in organisms directly caged on 381
sediments in situ (9.8±2.7 individuals, n=11). In this last case, no temporal trend in survival 382
was observed. 383
The length of alive chironomids increased linearly and significantly (R2>0.84, p<0.0001) 384
over time during the 4-day exposure both in the laboratory and in the field (Fig S2). In the 385
laboratory, the growth rate of the chironomids exposed to sand was 0.1499±0.0054 cm d-1; not 386
significantly different from the growth rate of 0.1421±0.0096 cm d-1 for the chironomids 387
exposed to homogenised Maniowy sediments (ANOVA, p>0.05; Fig. S2). In the field, the 388
growth rate of the chironomids exposed to sand (0.1273±0.0065 cm d-1) was significantly 389
lower than the value obtained for control chironomids in the laboratory (ANOVA, p=0.016; 390
Fig. S2). Growth rate further and significantly decreased to 0.092±0.0114 cm d-1 when the 391
chironomids were exposed to the undisturbed sediments in situ using S-WISS1.1 (ANOVA, 392
p=0.011; Fig. S2). 393
Concerning the 7-day bioaccumulation test, no significant effect was observed between 394
controls and exposed chironomids. The lowest number of alive chironomids per beaker (n=3) 395
was 19 and 18 in controls and exposed organisms, respectively. The mean length at the end of 396
19 exposure period was 1.01 ± 0.02 cm in controls and 0.99±0.05 cm in chironomids exposed to 397
the homogenised Maniowy sediment (t-test, p>0.05). 398
399
4. Discussion
400
4.1. Importance of SPM as an additional exposure route to contaminants in the field 401
The comparable Cr body burden in chironomids exposed in situ to undisturbed field 402
sediments and to clean sand (Figs. 2 and 3) suggests the presence of an additional source of 403
Cr for the organisms exposed in the field. The lower accumulation of Cr in chironomids 404
exposed in the laboratory to homogenised sediments from Maniowy also supports the 405
hypothesis that one (or more) additional source of Cr exists in the field. A possible 406
contribution of Tetramin® to Cr bioaccumulation can be ruled out by the absence of Cr 407
accumulation in control laboratory chironomids. We surmise that freshly deposited SPM 408
entering the exposure cages can act as an important source of Cr to surface deposit feeders 409
exposed in the field at the site of Maniowy. Besides the strong Cr accumulation by control 410
chironomids exposed in situ, several observations collectively form a basis for evidence to 411
support this hypothesis as detailed in the next paragraphs. 412
The lower accumulation by laboratory-exposed chironomids likely reflects the lower Cr 413
concentration in homogenised sediments used for laboratory experiments compared with 414
undisturbed field sediments (Fig. S3). The differences between homogenised and undisturbed 415
(surface) sediments may be explained by the vertical decrease of Cr contamination in 416
Maniowy sediments (Vignati et al., this issue). However, Ferrari et al. (2014) showed that, for 417
sediments collected from the same site in Lake Geneva, Cr bioaccumulation was about 2- to 418
3-fold higher for chironomids exposed to homogenised sediments in the laboratory (sediment 419
Cr content 25–30 µg g-1) than to undisturbed field sediments using S-WISS1.1 type cages 420
(28–32 µg g-1 of Cr) or to homogenised sediments placed back in the field (27–32 µg g-1 of 421
20 Cr). In the study of Ferrari et al. (2014), temperature differences between laboratory (21 ºC) 422
and field (15 ºC) alone could explain the observed differences. Sediment manipulation is also 423
known to trigger a series of reactions that increase the bioavailability of sediment-bound 424
contaminants (Vandegehuchte et al., 2013); in disagreement with our observations. Overall, 425
these previous observations suggest that the higher accumulation of Cr in chironomids 426
exposed in the field to undisturbed Maniowy sediments requires a supplementary source of 427
bioavailable Cr. 428
As observed in previous research on metal accumulation by chironomids (Dabrin et al., 429
2012; De Jonge et al., 2010; Martin et al., 2008), uptake of aqueous Cr species from overlying 430
water and pore water is unlikely to be the main responsible for the observed bioaccumulation 431
patterns in chironomids. In laboratory experiments, homogenized Maniowy sediments were 432
covered with filtered water from Lake Geneva; which has a low Cr content (Edder et al., 433
2008; Kottelat, 2008) and should not contribute much to Cr accumulation. The occurrence of 434
higher Cr body burdens in field control chironomids compared with organisms exposed to 435
Maniowy sediments in the laboratory can therefore be considered indicative of Cr uptake 436
from the overlying waters of Maniowy. This pattern was actually observed after 3 and 4 days 437
of exposure (Figs. 2 and 3). However, differences in accumulated Cr concentrations were only 438
30% of the total body burdens, confirming the need for another source of Cr to explain the 439
observed bioaccumulation in field controls. Furthermore, field control chironomids were 440
exposed on a substrate of (initially) clean sand so that Cr uptake from pore water is unlikely to 441
have contributed markedly to the elemental burden of these organisms. 442
Similar conclusions can be obtained by examining the total filterable Cr concentrations 443
measured in overlying waters inside S-WISS1.1 cages (Table S1). These concentrations 444
showed some variability between days 1+2 (3.9±1.4 µg L-1; n=6) and 3+4 (35±29 µg L-1; 445
n=6), but Cr accumulation by chironomids was not directly proportional to filterable Cr 446
21 concentration inside the cages (Table S1). DGT measurements over 89 hours (slightly shorter 447
than the 96 hours of chironomid exposure for logistic reasons) did not show any marked 448
change in labile Cr in overlying or interstitial waters either (Fig. S4). The concentration of 449
Cr(VI) measured in overlying waters of cages recovered on days 3 and 4 (Table S1) was 450
0.59±0.321 µg L-1 (n=6, range: 0.076–1.04 µg L-1) and comparable to the levels measured in 451
pore waters recovered from sediment cores sampled in Maniowy (Vignati et al., this issue). 452
Otherwise stated, caging did not markedly change Cr(VI) concentrations (which could have 453
had consequences on Cr bioavailability) and DGT-labile Cr, a proxy for bioavailable trivalent 454
Cr, remained constant during chironomids’ exposure. Changes in pH, conductivity and 455
oxygen content within the S-WISS1.1 cages are also too limited (Ferrari et al., 2014) to result 456
in significant increases of Cr oxidation from field sediments. Considering the egestion rate of 457
Cr assimilated via the dietary pathway (i.e., the kes parameter in formula 1) would have further
458
reduced the modelled Cr body burden. Overall, Cr uptake from freshly deposited SPM 459
remains the hypothesis best supported by the available data to explain a) the observed Cr 460
accumulation in field controls and b) the higher Cr accumulation by chironomids exposed to 461
Maniowy sediment in situ compared with laboratory exposures to homogenised sediment. 462
463
4.2. A unifying framework for modelling, experimental results and field observations 464
The hypothesis that ingestion of freshly deposited SPM (section 4.1) represents a 465
significant route of Cr accumulation for chironomids exposed in situ allows to reconcile 466
modelling calculations and experimental results to a great extent. Summing accumulation via 467
SPM (i.e., the experimental values measured for field control cages) to the quantity of Cr 468
accumulated from sediment ingestion (using an AE of 0.1% as determined by the biomimetic 469
approach – see section 2.5) markedly improves the agreement between modelled and 470
measured bioaccumulation for organisms exposed to Maniowy sediments in situ (Fig. 4a). 471
22 With this procedure, modelled concentrations remain within 20% of measured ones for 2, 3 472
and 4 days of exposure, again supporting the hypothesis that SPM is a major route of 473
exposure in field conditions. The ± 20% differences are within the possible contribution of Cr 474
uptake via the aqueous route; as in indicated by the comparison between laboratory exposure 475
to Maniowy sediments and in situ control cages (see section 4.1). 476
On the other hand, a contribution of freshly deposited SPM to Cr accumulation cannot be 477
invoked to reduce the discrepancies between modelled and experimental Cr concentrations for 478
chironomids exposed to Maniowy sediments in the laboratory (Fig. 4b). Accumulation via 479
aqueous exposure, if any, would not lead to a better agreement between modelled and 480
experimental results either (see sections 3.3 and 4.1). It is however possible that sediment 481
manipulation during the setup of laboratory exposure may increase Cr bioavailability for 482
chironomids. In the case of the Vidy Bay (a polluted bay in Lake Geneva, 483
Switzerland/France), Ferrari et al. (2014) reported that Cr bioaccumulation by C. riparius in 484
the laboratory was about twice than in specimen of the same species exposed in the field (S-485
WISS1.1 cages). Chromium accumulation in the laboratory was even 4–5 times higher than in 486
organisms exposed on site in cages containing the same homogenised field sediments used in 487
the laboratory. However, including a correction factor of 2 (in situ vs. laboratory) or 4.5 (on 488
site vs. laboratory) into modelled bioaccumulation values for chironomids exposed to 489
Maniowy sediment in the laboratory does not improve the agreement between observed and 490
predicted results to any appreciable extent (Fig. 4b). 491
Another factor that may increase Cr bioavailability in laboratory exposure following 492
sediment manipulation is the association of Cr with Fe/Mn oxides in Maniowy sediments 493
(Vignati et al., this issue). However, even assuming a Cr assimilation efficiency of 5% for 494
chironomids exposed to Maniowy sediments in the laboratory, modelled results still remain 495
about 15% of the measured accumulation at day 4 (Fig. 4b). One last option is that the 496
23 development of an active Mn redox cycle at the sediment-water interface might have led to 497
the formation of highly bioavailable Cr(VI) via oxidation of Cr(III) in the laboratory exposure 498
beakers (Landrot et al., 2012). While the available experimental data do not allow to test this 499
hypothesis, it appears that chromium bioaccumulation in the laboratory occurred to a different 500
extent, and possibly via different routes, compared with real-field situations. Otherwise stated, 501
the use of homogenised sediment to test for contaminant bioavailability may change the 502
relative importance of the various exposure routes and lead to results not directly applicable in 503
the field (Ferrari et al., 2014; Simpson and Batley, 2007; Wang et al., 2004). 504
It is also instructive to examine how well Cr accumulation by caged specimen of C. 505
riparius can mimic Cr accumulation by indigenous chironomids. As already seen, 506
consideration of Cr uptake via ingestion of freshly deposit SPM is necessary to reconcile 507
DYMBAM calculations and experimentally measured accumulation for specimen of C. 508
riparius exposed in situ to Maniowy sediment (Fig. 4a). However, even after accounting for 509
the SPM route, the average accumulation of Cr by C. riparius inside S-WISS1.1 cages (98±23 510
µg g-1; arithmetic mean ± one standard deviation for 4 days of exposure, n=11) remains about 511
3 times lower than accumulation by indigenous chironomids recovered from Maniowy 512
sediments during the same period (315 µg g-1 for the pool of chironomids sampling in June 513
2007; see Vignati et al., this issue). This difference may originate from individual indigenous 514
chironomids weighing, on average, about 3.5 times as much as S-WISS1.1 exposed specimen 515
on day 4 (1.43 vs. 0.388 mg). Larger individuals would ingest larger sediment quantities to 516
meet their nutritional needs, while simultaneously accumulating more Cr from contaminated 517
sediments. Furthermore, ingestion rate is inversely related to the organic matter content of a 518
given sediment. Contrary to caged C. riparius, indigenous chironomids could not rely on 519
Tetramin® as an additional source of Cr-free carbon; which could again have led to higher 520
ingestion rates and, eventually, higher Cr body burdens. These considerations equally apply to 521
24 the ingestion of freshly deposited SPM and do not invalidate the hypothesis of SPM as the 522
main Cr source to chironomids. Even if not performed in the same experimental conditions, it 523
is interesting to note that Bervoets et al. (2004) found a very good agreement in Cr internal 524
concentrations between caged and resident larvae, especially in the most contaminated sites. 525
526
4.3. Effect of chromium on the growth of chironomids 527
Individuals of C. riparius exposed to homogenised Maniowy sediments in the laboratory 528
for 4 or 7 days did not exhibit higher mortality or reduced growth rate compared with control 529
chironomids (section 3.4 and Fig. S2), indicating that Maniowy sediments were not toxic in 530
standardized conditions. The absence of effects in laboratory exposures may be linked with 531
sediment homogenisation. The Cr content of Maniowy sediments rapidly decreases below 5–6 532
cm (Vignati et al., this issue) because the Czorsztyn reservoir was flooded in 1997 and a thin 533
layer of Cr-contaminated sediments overlies a relatively compact layer of former soil with 534
low Cr content. 535
On the other hand, exposure to undisturbed sediments in the field resulted in reduced 536
survival and growth rate compared with laboratory and field controls as well as with 537
homogenised Maniowy sediments tested in the laboratory (section 3.4 and Fig. S2). During 538
the in situ exposure period, water temperature in the field was around 21 ºC and hence similar 539
to the optimal temperature used for laboratory experiments. Moreover, chironomids have been 540
daily fed ad libitum in all laboratory and in situ tests, thus preventing the impact of limiting 541
food availability during in situ exposure. The differences between field controls and field 542
exposed chironomids are therefore indicative of some kind of adverse effect of Maniowy 543
sediments. Furthermore, the difference between field and laboratory controls also points to 544
adverse effect linked to the presence of freshly deposited SPM which appears as an important 545
route of exposure to Cr for chironomids during in situ experiments. 546
25 When considering the quantity of Cr accumulated by specimen of C. riparius in relation to 547
the growth results, it can be assumed that no effect on growth can be observed up to a total 548
concentration of 77 µg g-1 (Fig. 3 and Fig. S2). This concentration could correspond to a 549
Critical Body Residue (CBR). The CBR is the concentration of a chemical bioaccumulated in 550
an organism above which ecotoxicity effects appear (McCarty and MacKay, 1993). The 551
tentative CBR value of 77 µg g-1 agrees with the data of Méndez-Fernández et al. (2013) who 552
determined a CBR of approx. 34 µg g-1 for Tubifex tubifex in tests with natural sediments 553
spiked with K2Cr2O7. Upon entering living cells, Cr(VI) is rapidly converted to Cr(III) (Viti et
554
al., 2014), so that a comparison of CBR for the two redox forms of Cr remains meaningful. 555
Recent studies have demonstrated that metal body burdens in relative resistant 556
invertebrates such as chironomids can be used as predictors of ecological effects of metals on 557
aquatic ecosystems. Bervoets et al. (2016) have linked threshold body burdens of metals in 558
fourth instar larvae of indigenous Chironomus sp. to effects on resident macroinvertebrate 559
communities. Depending on the descriptor chosen for the structure of the macroinvertebrate 560
community, the threshold values ranged from 10 to 69 µg g-1 d.w. of Cr accumulated in 561
chironomids. It is therefore possible that Cr contamination at Maniowy adversely affects 562
sensitive taxa of macroinvertebrates. Furthermore, the tentative CBR value obtained for C. 563
riparius in the present study suggests that Cr levels above 77 µg g-1 d.w. can also affect 564
relatively pollution-tolerant organisms such as chironomids themselves. These findings are 565
not at odds with the thresholds proposed by Bervoets et al. (2016) because laboratory-reared 566
organisms are likely more sensitive than adapted local indigenous species. 567
However, the bioaccumulation results obtained in this study showed a large variability 568
(Fig. 2) which hampers a clear definition of the actual CBR for Cr in C. riparius. Other 569
studies also suggest that metals have toxic effects only when their uptake rate exceeds their 570
combined rates of efflux and detoxification (Casado-Martinez et al., 2010) or the fraction of 571
26 metabolically available metal increases (Rainbow, 2007). Knowledge of the subcellular fate 572
of metals is therefore required to better understand the physiological processes underlying 573
their bioaccumulation and toxicity. Such methods have been developed for larvae of 574
chironomids (Gimbert et al., 2016; Péry et al., 2008) and will have to be considered to further 575
clarify the metabolically available concentration of Cr that can affect the development of 576
chironomids at different stages in real-field situations. 577
578
5. Conclusions
579
Comparable levels of Cr accumulation by specimen of Chironomus riparius exposed to 580
undisturbed field sediments in situ and to clean sand on-site suggest that ingestion of freshly 581
deposited SPM can be the main route of Cr accumulation by surface deposit feeders in real 582
field conditions. This additional route of exposure is not accounted for in standardized 583
laboratory experiments or, as yet, by biodynamic bioaccumulation modelling, so that both 584
approaches will lead to an underestimation of Cr accumulation compared with field 585
conditions. Changes in the bioavailability of sediment-bound Cr also seem to occur during 586
sediment sampling and handling, with the correction of such experimental artefacts being far 587
from straightforward. While both laboratory and in situ experiments provide evidence for the 588
availability of Cr in aquatic system impacted by tannery wastewaters, in situ investigations 589
appear necessary to obtain an adequate understanding of Cr bioavailability under real 590
environmental conditions. 591
A tentative threshold of Cr accumulation for effects on the growth of C. riparius is 592
proposed at 77 µg g-1 d.w. Further studies using toxicokinetics approaches and subcellular 593
fractionation methods are however required to refine the actual concentration of Cr linked to 594
the biologically active sites and leading to adverse effects in these benthic organisms. 595
Extrapolation from the model organism C. riparius to other species of indigenous 596
27 chironomids also represents a future challenge to better link laboratory and in situ results with 597
real field situations. 598
599
Acknowledgements
600
This research was supported by the Swiss National Fund (grants 101844 and 200020-601
117942). The authors express their sincerest thanks to Michal Krzyszkowski and the direction 602
of the Niedzica Hydro-Electric Power Plant (Poland) for their precious cooperation. We are 603
indebted to Mr. Przemek Kramin and Mr. Tomasz Smereczynski for handling of S-WISS1.1 604
in situ exposure systems in the Czorsztyn reservoir. We also thank our colleagues Vincent 605
Chanudet, Régis Kottelat and Stephanie Jüstrich from the Institute F.-A. Forel for their help 606
during field work. 607
608 609
References
610
Aharchaou I, Py JS, Cambier S, Loizeau JL, Cornelis G, Rousselle P, Battaglia E, Vignati 611
DAL. 2018. Chromium hazard and risk assessment: New insights from a detailed 612
speciation study in a standard test medium. Environmental Toxicology and Chemistry. 613
37(4):983-992. 614
Baumann Z, Fisher NS. 2011. Modeling metal bioaccumulation in a deposit-feeding 615
polychaete from labile sediment fractions and from pore water. Science of The Total 616
Environment. 409(13):2607-2615. 617
Bencheikh-Latmani R, Obraztsova A, Mackey MR, Ellisman MH, Tebo BM. 2007. Toxicity 618
of Cr(III) to Shewanella sp. strain mr-4 during Cr(VI) reduction. Environ Sci Technol. 619
41:214-220. 620
28 Bervoets L, De Bruyn L, Van Ginneken L, Blust R. 2003. Accumulation of 137Cs by larvae of 621
the midge Chironomus riparius from sediment: effect of potassium. Environ Toxicol 622
Chem. 22(7):1589-1596. 623
Bervoets L, De Jonge M, Blust R. 2016. Identification of threshold body burdens of metals for 624
the protection of the aquatic ecological status using two benthic invertebrates. 625
Environmental Pollution. 210(Supplement C):76-84. 626
Bervoets L, Meragalli G, De Cooman W, Goddeeris B, Blust R. 2004. Caged midge larvae 627
(Chironomus riparius) for the assessment of metal bioaccumulation from sediment in 628
situ. Environ Toxicol Chem. 23:443-454. 629
Bobrowski A, Kapturski P, Zarębski J, Dominik J, Vignati DAL. 2012. Catalytic adsorptive 630
stripping voltammetric determination of chromium(VI) in overlying and interstitial 631
waters isolated from sediments contaminated by tannery waste. Analytical Letters. 632
45(5-6):495-507. 633
Burton Jr GA, Rosen G, Chadwick DB, Greenberg MS, Taulbee WK, Lotufo GR, Reible DD. 634
2012. A sediment ecotoxicity assessment platform for in situ measures of chemistry, 635
bioaccumulation and toxicity. Part 1: System description and proof of concept. 636
Environmental Pollution. 162:449-456. 637
Casado-Martinez CM, Smith BD, Luoma SN, Rainbow PS. 2010. Metal toxicity in a 638
sediment-dwelling polychaete: Threshold body concentrations or overwhelming 639
accumulation rates? Environmental Pollution. 158(10):3071-3076. 640
Chatterjee N, Luo Z. 2010. Cr-(III)-organic compounds treatment causes genotoxicity and 641
changes in DNA and protein level in Saccharomyces cerevisiae. Ecotoxicology. 642
19(4):593-603. 643
29 Crane M, Burton GA, Culp JM, Greenberg MS, Munkittrick KR, Ribeiro R, Salazar MH, St-644
Jean SF. 2007. Review of aquatic in situ approaches for stressor and effect diagnosis. 645
Integrated Environ Assess Manag. 3(2): 234-245. 646
Dabrin A, Durand CL, Garric J, Geffard O, Ferrari BJD, Coquery M. 2012. Coupling 647
geochemical and biological approaches to assess the availability of cadmium in 648
freshwater sediment. Science of The Total Environment. 424:308-315. 649
De Flora S, Bagnasco M, Serra D, Zanacchi P. 1990. Genotoxicity of chromium compounds. 650
A review. Mutation Research/Reviews in Genetic Toxicology. 238(2):99-172. 651
De Jonge M, Blust R, Bervoets L. 2010. The relation between acid volatile sulfides (avs) and 652
metal accumulation in aquatic invertebrates: Implications of feeding behavior and 653
ecology. Environmental Pollution. 158(5):1381-1391. 654
Dominik J, Vignati DAL, Koukal B, Pereira de Abreu M-H, Kottelat R, Szalinska E, Bas B, 655
Bobrowski A. 2007. Speciation and environmental fate of chromium in rivers 656
contaminated with tannery effluents. Engineerig Life Science. 7:155-169. 657
Edder P, Ortelli D, Klein A, Ramseier S. 2008. Metals and organic micropollutants in Geneva 658
Lake waters and sediments. Rapp. Comm. int. prot. eaux Léman contre pollut., 659
Campagne 2007, 57-84. 660
Fairbrother A, Wenstel R, Sappington K, Wood W. 2007. Framework for metals risk 661
assessment. Ecotoxicology and Environmental Safety. 68(2):145-227. 662
Ferrari BJD, Faburé J. 2017. Field assessment of reproduction-related traits of chironomids 663
using a newly developed emergence platoform (e-board). Ecotoxicology and 664
Environmental Safety. 137:186-193. 665
Ferrari BJD, Vignati DAL, Dominik J. 2014. Bioaccumulation kinetics and effects of 666
sediment-bound contaminants on chironomids in deep waters: New insights using a 667
low-disturbance in situ system. Environmental Technology. 35(4):456-469. 668
30 Gimbert F, Geffard A, Guédron S, Dominik J, Ferrari BJD. 2016. Mercury tissue residue 669
approach in Chironomus riparius: Involvement of toxicokinetics and comparison of 670
subcellular fractionation methods. Aquatic Toxicology. 171:1-8. 671
Hare L, Campbell PGC, Tessier A, Belzile N. 1989. Gut sediment in a burrowing mayfly 672
(Ephemeroptera, Hexagenia limbata): their contribution to animal trace element 673
burderns, their removal, and the efficacy of a correction for their presence. Can J Fish 674
Aquat Sci. 46:451-456. 675
Khwaja AR, Singh R, Tandon SN. 2001. Monitoring of Ganga water and sediments vis-à-vis 676
tannery pollution at Kanpur (India): A case study. Environmental Monitoring and 677
Assessment. 68(1):19-35. 678
Kottelat R. 2008. Caractérisation physico-chimique de microcosmes alimentés en continu et 679
leur utilisation dans l'étude des voies d'exposition de Cd et Cr (III) chez "Daphnia 680
magna". Terre et Environnement, Université de Genève; 73: 191 p. 681
Koukal B, Dominik J, Vignati D, Arpagaus P, Santiago S, Ouddane B, Benaabidate L. 2004. 682
Assessment of water quality and toxicity of polluted rivers Fez and Sebou in the 683
region of Fez (Morocco). Environ Poll. 131:163-172. 684
Kováčik J, Babula P, Hedbavny J, Kryštofová O, Provaznik I. 2015. Physiology and 685
methodology of chromium toxicity using alga Scenedesmus quadricauda as model 686
object. Chemosphere 120: 23-30. 687
Landrot G, Ginder-Vogel M, Livi K, Fitts JP, Sparks DL. 2012. Chromium(III) Oxidation by 688
Three Poorly-Crystalline Manganese(IV) Oxides. 1. Chromium(III)-Oxidizing 689
Capacity. Environmental Science & Technology 46: 11594-11600. 690
Leghouchi E, Laib E, Guerbet M. 2009. Evaluation of chromium contamination in water, 691
sediment and vegetation caused by the tannery of Jijel (Algeria): a case study. 692
Environmental Monitoring and Assessment 153: 111-117. 693
31 Lynch J. 1990. Provisional elemental composition values for eight new geochemical lake 694
sediment and stream sediment reference materials LKSD-1, LKSD-2, LKSD-3, 695
LKSD-4, STSD-1, STSD-2, STSD-3, STSD-4. Geostandards Newsletter 14: 153-167. 696
Martin S, Proulx I, Hare L. 2008. Explaining metal concentrations in sympatric chironomus 697
species. Limnology and Oceanography 53(2):411-419. 698
McCarty LS, MacKay D. Enhancing ecotoxicological modeling and assessment. 1993. 699
Environ. Sci. Technol. 27: 1719-1728. 700
Méndez-Fernández L, Martínez-Madrid M, Rodriguez P. 2013. Toxicity and critical body 701
residues of cd, cu and cr in the aquatic oligochaete tubifextubifex (müller) based on 702
lethal and sublethal effects. Ecotoxicology 22(10): 1445-1460. 703
Michailova P, Petrova N, Sella G, Bovero S, Ramella L, Regoli F, Zelano V. 2001. Genotoxic 704
effects of chromium onpolytene chromosomes of Chironomus riparius Meigen 1804 705
(Diptera, Chironomidae). Caryologia 54(1): 59-71. 706
Michailova P, Szarek-Gwiazda E, Kownacki A, Warchalowska-Sliwa E. 2011. Biodiversity 707
of chironomidae (Diptera) and genome responses to trace metals in the environment. 708
Pestydydy/Pesticides 1-4: 41-48. 709
Péry ARR, Geffard A, Conrad A, Mons R, Garric J. 2008. Assessing the risk of metal 710
mixtures in contaminated sediments on Chironomus riparius based on cytosolic 711
accumulation. Ecotoxicology and Environmental Safety 71: 869-873. 712
Péry ARR, Mons R, Flammarion P, Lagadic L, Garric J. 2002. A modeling approach to link 713
food availability, growth, emergence, and reproduction for the midge Chironomus 714
riparius. Environ. Toxicol. Chem. 21: 2507-2513. 715
Ponti B, Bettinetti R, Dossi C, Vignati DAL. 2014. How reliable are data for the ecotoxicity 716
of trivalent chromium to daphnia magna? Environmental Toxicology and Chemistry 717
33(10): 2280-2287. 718
32 Rainbow PS. 2007. Trace metal bioaccumulation: Models, metabolic availability and toxicity. 719
Environment International 33: 576-582. 720
Rasmussen JB. 1984. Comparison of gut contents and assimilation efficiency of fourth instar 721
larvae of two coexisting chironomids, Chironomus riparius Meigen and 722
Glyptotendipes paripes (Edwards). Can. J. Zoology 62: 1022-1026. 723
Roditi HA, Fisher NS. 1999. Rates and routes of trace elements uptake in zebra mussel. 724
Limnol. Oceanogr. 44: 1730-1749. 725
Simpson SL, Batley GE. 2007. Predicting metal toxicity in sediments: A critique of current 726
approaches. Integrated Environmental Assessment and Management 3: 18-31. 727
Szalinska E, Dominik J, Vignati DAL, Bobrowski A, Bas B. 2010. Seasonal transport pattern 728
of chromium(III and VI) in a stream receiving wastewater from tanneries. Applied 729
Geochemistry 25: 116-122. 730
Vandegehuchte MB, Nguyen LTH, De Laender F, Muyssen BTA, Janssen CR. 2013. Whole 731
sediment toxicity tests for metal risk assessments: on the importance of equilibration 732
and test design to increase ecological relevance. Environmental Toxicology and 733
Chemistry 32: 1048-1059. 734
Vignati DAL, Dominik J, Beye ML, Pettine M, Ferrari BJD. 2010. Chromium(VI) is more 735
toxic than chromium(III) to freshwater algae: A paradigm to revise? Ecotoxicology 736
and Environmental Safety 73: 743-749. 737
Vignati DAL, Ferrari BJD, Dominik J. 2007. Laboratory-to-field extrapolation in aquatic 738
sciences. Environ. Sci. Technol. 41: 1067-1073. 739
Vignati DAL, Ferrari BJD, Roulier JL, Coquery M, Szalinska E, Bobrowski A, Czaplicka A, 740
Dominik J. Chromium bioavailability in aquatic systems impacted by tannery 741
wastewaters. Part 1: understanding chromium accumulation by indigenous 742
chironomids. Science of The Total Environment ; this issue. 743
33 Viti C, Marchi E, Decorosi F, Giovannetti L. 2014. Molecular mechanisms of Cr(VI)
744
resistance in bacteria and fungi. FEMS Microbiology Reviews 38: 633-659. 745
Wang F, Goulet RR, Chapman PM. 2004. Testing sediment biological effects with the 746
freshwater amphipod Hyalella azteca: the gap between laboratory and nature. 747
Chemosphere 57: 1713-1724. 748
Wang W-X, Griscom SB, Fisher NS. 1997. Bioavailability of Cr(III) and Cr(VI) to marine 749
mussels from solute and particulate pathways. Environ. Sci. Technol. 31: 603-611. 750 751 752 753 754 755 756 757 758 759 760 761 762 763 764 765 766 767 768
34
Supporting information
769 770
Chromium bioavailability in aquatic systems impacted by tannery wastewaters. Part 2:
771
new insights from laboratory and in situ testing with Chironomus ripariusMeigen
772
(Diptera, Chrinomidae)
773 774
Ferrari B.J.D.a,b, Vignati D.AL.a,c, Roulier J.-L.d, Coquery M.d, Szalinska E.e, Bobrowski A.f, 775
Czaplicka A.g, Dominik, J.a,h 776
777
i) Department F.-A. Forel for Environmental and Aquatic Sciences, University of Geneva, 778
Uni Carl Vogt, 66 boulevard Carl-Vogt CH-1211 Geneva, Switzerland 779
780
j) Swiss Centre for Applied Ecotoxicology Eawag-EPFL (Centre Ecotox), EPFL-ENAC-781
IIE-GE, Station 2, 1015 Lausanne, Switzerland 782
783
k) Université de Lorraine, CNRS, LIEC, F-57000 Metz, France 784
785
l) Irstea, UR RiverLy, centre de Lyon-Villeurbanne, F-69625 Villeurbanne, France 786
787
m) Department of Environment Protection, Faculty of Geology, Geophysics and 788
Environmental Protection, AGH University of Science and Technology, 30 A. 789
Mickiewicza Av. , 30-059 Krakow, Poland. 790
791
n) Department of Building Materials Technology Faculty of Materials Science and Ceramics, 792
AGH University of Science and Technology, 30 A. Mickiewicza Av. , 30-059 Krakow, 793
Poland 794
795
o) Department of Water Supply, Sewerage and Environmental Monitoring, Cracow 796
University of Technology, 24 Warszawska ul., 31-155 Krakow, Poland 797
798
p) Institute of Marine Science - National Research Council (ISMAR-CNR) Arsenale - Tesa 799
104, Castello 2737/F, 30122 Venice, Italy 800
801
*Corresponding Author: benoit.ferrari@centreecotox.ch 802 803 804 805 806 807 808