PFC/JA-90-32
Direct Spectral Measurements of a Quasi-CW Free-Electron Laser Oscillator
Danly, B.G., Evangelides, S.G.", Chu, T.S., Temkin, R.J. Plasma Fusion Center
Massachusetts Institute of Technology Cambridge, MA 02139
Ramian, G., Hu, j.b
Quantum Institute, University of California Santa Barbara, CA 93106
August 1990
a Present Address: AT&T Bell Laboratories, Holmdel, NJ 07783 b Present Address: Cadence, Inc., Santa Clara, CA
Abstract
Mode competition in a far-infrared, free-electron laser operating in the quasi-CW regime has been investigated by means of direct spectral measurement with a heterodyne receiver system. About 30% of the spectra had a single longitudinal mode. The observed data compare reasonably well with theory. It is found that even in a regime of multimode operation the laser signals are only weakly modulated in time, as observed with a video detector. Such an observation is consitient with a phase locking of multiple modes, as predicted by theory.
One of the most important issues of free-electron laser (FEL) physics is the complex non-linear interaction between different resonator modes and the electron beam -6. This can be thought of as a competition between modes for the beam's energy. It exists primarily between longitudinal modes, but may involve transverse modes as well, and can result in complex time-frequency behavior3. The choice of FEL operating parameters has profound influence on such behavior which in turn affects the ultimate success in achieving goals such as highly-coherent, single-frequency operation or frequency tuning agility.
The issue of mode competition applies to a wide variety of free-electron generators of coherent radiation. In conventional gyrotrons, for example, competition between trans-verse modes of highly-overmoded closed resonators is a primary concern in obtaining high efficiency operation7. In quasioptical gyrotrons, mode competition between axial modes is
8 a significant problem
In this letter, we present results of the first direct spectral measurement of the output radiation from the FEL oscillator at the University of California, Santa Barbara (UCSB). This FEL is unique in employing a recirculating beam electrostatic accelerator operating in the micro-second pulse regime. The absence of a picosecond temporal micro-structure, characteristic of most FELs, means that the usual Fourier transform linewidth limitation of a few tenths of a percent does not apply. This opens the possibility of generating extremely coherent radiation for applications such as spectroscopy or isotope separation. Pertinent to the linewidth issue are the FEL's Fabry-Perot type resonator characteristics. For gain bandwidths greater than the free spectral range VFSR = c/2L, linewidth is a function of the number of modes lasing. For gain bandwidths less than VFSR, only a single mode lases and an upper limit on the linewidth is determined by the Airy function response, 1/{1+Fsin2 6/2}, where 6 = 4rL,/Au and F = 4V - 7/(1-V
1) 2, resulting
in Av = c/7L/27. For the UCSB resonator of length L, = 7.75 m and loss I ~ 10%,
VFSR = 19.3 MHz, and the linewidth of a single longitudinal mode is Av = 3.5 x 10⁵ Hz or
Av/v ~ 2 x 10⁻⁷. The actual single-mode linewidth may be even narrower since the lasing can be characterized as a stimulated emission process with line narrowing proportional to intensity9.
use of an overmoded waveguide as part of the resonator (hy/A ; 100). Despite the large number of transverse modes available in such a guide, only a small number of frequencies3
Vn,m =
2
#, 1i--(1-#2 ) (1).. 1
- (32b# em ()
satisfy the FEL synchronism condition, where em = 1 - (m + 1)/koz,, n and m = mode
indices, b = resonator height, Au = undulator period, ko = wavenumber, z, = Rayleigh length, and #. = vs/c = average axial electron velocity. Longitudinal modes, however, are more numerous, occurring at frequency intervals of 19.3 MHz. The FEL small-signal gain is of form
Ga. oc -- , ~(//2)) 27rN.(1 - (2)
where p is the FEL resonance detuning parameter, vo is the FEL resonance frequency, and
N. is the number of undulator periods. Since G,, is positive for 0 < 1A < 27r, there are
approximately 500 longitudinal modes that can exhibit gain. In practice, only modes near the highest portion of the curve have sufficient gain to lase. It has been observed that the FEL startup frequencies, at a given energy, fit a Gaussian curve with a fractional width of
a 0.05% FWHM. This includes about 75 longitudinal modes.
The UCSB FEL exhibits the additional complicating characteristic of a continuous negative slewing of beam energy of ~ 1 kV/ps caused by the discharge of its accelerator terminal voltage. As a result of this, rather than continuously shift between adjacent modes, the lasing establishes itself on one or more modes for ~ 1 - 3ps then, when the resonance condition has shifted so far that there is no longer gain to support lasing at those frequencies, jumps over about 100 modes to lase on a new frequency. For long pulses, the laser steps through a series of descending frequencies".
Initial interpretation of the UCSB FEL data as indicating single mode operation3 was based on inference from time domain measurements. One of the most striking features of the FEL's operation has been a radiation pulse whose amplitude is relatively free of modulation. This was thought to be consistent with lasing on a single mode with adjacent modes smaller than a few percent and with a very narrow linewidth whose coherence time was comparable to pulse length. Similar behavior was observed in a low frequency FEL
experiment at Hughes Research" where single mode operation was more readily confirmed at microwave frequencies (30 GHz). In the case of the UCSB machine, it subsequently be-came apparent that the loss of phase information by the square-law detection processes might undermine the validity of that interpretation. In particular, the appearance of am-plitude coherence in the time domain might be possible if more than one mode were lasing but with a specific phase relationship between modes. Numerical simulations4 suggest that this is possible with many modes simultaneously lasing.
The need for a direct frequency-domain spectral measurement at UCSB has long been recognized but conventional spectrum analyzers were inappropriate due to the microsecond time duration of lasing. The stochastic nature of FEL start-up resulted in a pulse-to-pulse frequency fluctuation which precluded spectral measurement by sampling techniques.
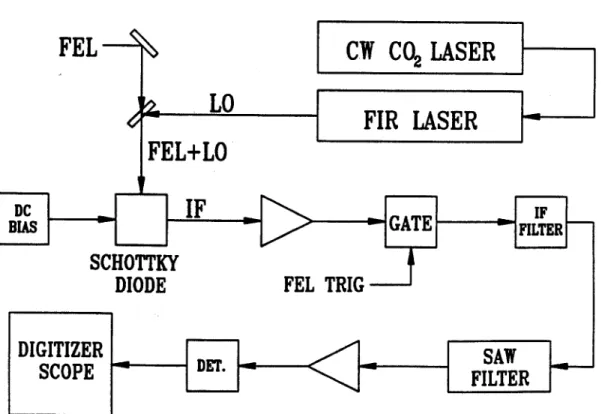
The spectrometer employed for these studies consisted of a heterodyne receiver and a surface-acoustic-wave (SAW) dispersive-delay-line filter developed at MIT. This system, shown in Fig. 1, permitted essentially instantaneous, direct single-pulse measurement of the spectrum. The heterodyne receiver consisted of a Schottky diode which mixed the radiation from the FEL with that from the local oscillator, a CW far-infrared methyl alcohol gas laser operated at 163 pm and pumped by the 10R38 CO2 line. The parameters of the FEL operation during this study are listed in Table 1.
The FEL was tuned to yield an intermediate frequency (IF) VIF from the mixer at approximately 1 GHz. For fundamental mixing, the local oscillator frequency, vLo, and the FEL frequency, VFEL are related to the IF frequency by VFEL = VLO ± VIF.
The IF signal was amplified and gated to a pulse of width r = 100 ns by a fast PIN diode switch. The surface-acoustic-wave dispersive filter, with a center frequency fo = 1 GHz and a bandwidth Af = 400 MHz, produced a frequency dependent time delay of
At = 8.3 pts - 0.02 ps/MHz (f - fo) The temporally dispersed output from the SAW filter represents the spectrum of the IF input signal provided the gated IF pulse width r satisfies the inequality !(TAf)'/ 2 ~ T/r
<
!(TLof), where T is the total SAW delay time. In this case, r = 100 ns, T = 8 ps, and Af = 400 MHz, satisfying the above inequality. After amplification, the IF signal is detected by a fast diode and recorded by a 100 MS/s digitizer. Corrections for the SAW device's frequency dependent attenuation and the detector diodenon-linearity are applied during data analysis.
The resolution of the SAW spectrometer was approximately 8 MHz. Consequently, individual longitudinal modes were easily resolved but the actual linewidth could not be determined. The bandwidth of the SAW spectrometer was sufficient to observe as many as 20 modes on a single pulse. However, as mentioned previously, the stochastic nature of the FEL startup and imperfect pulse to pulse beam energy regulation permitted lasing on any of about 75 modes described by a Gaussian distribution of FWHM ~ 0.05 %. Thus, the lasing frequency did not always fall within the spectrometer bandwidth.
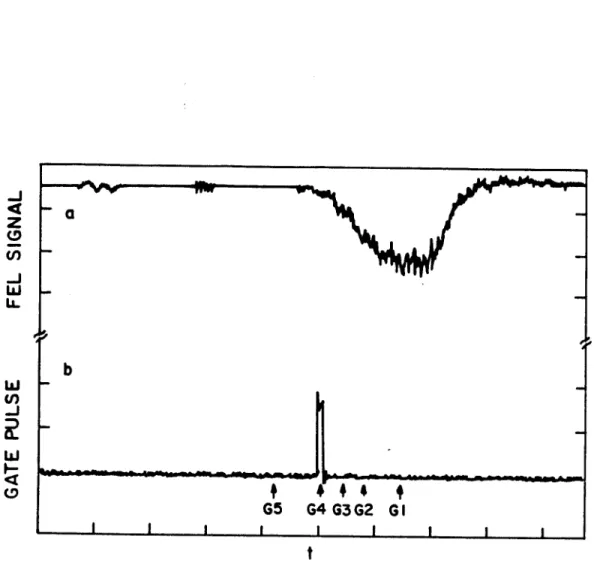
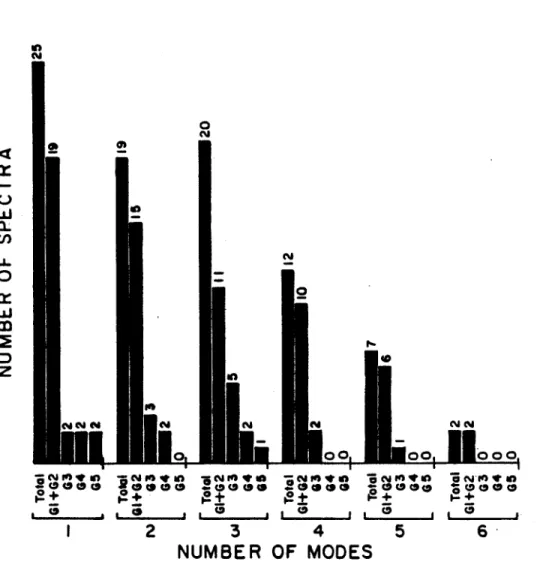
Approximately 90 spectra were taken during this study. Two typical spectra are shown in Fig. 2. Spectra were acquired at times t during the FEL pulse, as shown in Fig. 3, corresponding to time of saturation and four earlier times with At = t,"t - t = 0, 320 ns, 500 ns, 700 ns, and 1100 ns, where t,,t is the time of saturation of the optical pulse. The results of a statistical analysis of the spectra are shown in Fig. 4, a histogram of the number of spectra as a function of N for which there are N longitudinal modes excited with powers greater or equal to 50% of the power (F = 2) of the largest mode. By this criterion, approximately 29% of the spectra showed single mode lasing.
In attempting to interpret these results, two essential features stand out. First, the presence of strong mode competition is confirmed. A continuum of excited modes is never seen. Second, the excitation of the modes is highly stochastic. Every FEL pulse produced a dramatically different mode distribution. No clear patterns were discernible.
With respect to mode competition, a third order perturbation expansion of the FEL's radiation field was used by Kimel and Elias12 to show that strong coupling exists between
modes. In their terminology, similar to the classic Van der Pol coupled oscillator analysis, cross saturation terms between modes were found to be twice as strong as self saturation terms, leading to the prediction that one mode will grow to dominate by suppressing all others. However, this theory does not predict the time required to reach such an equilibrium when many modes are involved.
Antonson and Levush 4 6 have included large numbers of modes as well as the beam energy shift characteristics in numerical simulations that more closely approximate the actual FEL experiment. They estimate the time for the onset of coherence in a low-gain,
continuous beam FEL' to be rc ~ rd/E2
, where rd is the decay time for radiation in the empty cavity and the slippage parameter e = (L./Lr)(Vg/vz - 1). In this expression,
L, = N,,A. and v9 is the group velocity of the wave in the interaction region. For the
UCSB FEL, these values are rd ~ 200 ns and e ~ 3 x 10' respectively, yielding an estimated coherence onset time of r, ~ 15 ms, much longer than the electron beam pulse. This suggests equilibrium was not reached in this experiment, and the mode distribution was strongly influenced by startup conditions. Their statistical analysis of the probable distribution of FEL spectra6 assumes that there is no correlation between the noise driving
the complex mode amplitudes, and that each is modeled by a Langevin equation. They arrive at a probability PN(F) of observing one mode out of a group of N modes to be larger than all others by a factor of F given by PN(F) = F! /[(N + 1)(N + 2) ... (N + F - 1)].
For F = 2 and N = 20 modes, centered about a detuning13 6P
= Pinj - Pma, which is itself a random variable uniformly distributed over a range ±0.87, the probability of single mode spectra is 18%. The range of 6p corresponds to pulse to pulse energy fluctuations of ±0.04%. The discrepancy with theory is not large and could be explained by many factors including an overestimation of number of single mode shots due to the limited bandwidth of the spectrometer and assumptions about the actual startup conditions. The fraction of observed single-mode shots of course depends both on the criteria for single-mode operation
(F parameter), and on the threshold signal above which a peak is counted in the analysis.
An important observation is that the envelope of the FEL power as measured by the Schottky diode detector showed only a very small degree of modulation (Fig. 2a) despite the excitation of multiple longitudinal modes. This is a manifestation of the mode-locking effect and, to our knowledge, has not been previously observed in any oscillator experiment. Interpretation of a weakly modulated power envelope of the FEL output, as an indication of single-mode operation, is therefore not justified.
In conclusion, we have carried out a direct spectral measurement of the output of the UCSB FEL. Multimode and also predominantly single-mode spectra are observed with excitation of two or fewer modes occurring on more than half of the recorded spectra. Predictions of the probability distribution of spectra is in rough agreement with theoretical models.
We wish to acknowledge the following. UCSB: The sponsorship of ONR/URI contract N00014-86-K-0692 and SDI-MFEL contract N00014-86-K-0110. Also the valuable assis-tance of John Knox-Seith, Avner Amir, and Alan King. MIT: The sponsorship of DOE contracts DE-AC03-86SF16498 and DE-FG02-89ER14052. We acknowledge valuable dis-cussions with T. Antonson, B. Levush, and R.C. Davidson and thank T.C.L.G. Sollner of MIT Lincoln Laboratory for loan of the Schottky diode.
References
a Presently at AT&T Bell Laboratories, Holmdel, NJ 07783 b Presently at Cadence, Inc., Santa Clara, CA
' Y.L. Bogomolov et al., Opt. Comm. 36, 109 (1981)
2 A.P. Chetverikov, Sov. Phys. Tech. Phys. 26, 1452 (1981)
a L. Elias et al,.Phys. Rev. Lett. 57, 424 (1986)
4 T.M. Antonsen, Jr. and B. Levush, Phys. Rev. Lett. 62, 1488 (1989)
5 T.M. Antonsen, Jr. and B. Levush, Phys. Fluids B 5, 1097 (1989)
6 T.M. Antonsen, Jr. and B. Levush, Phys. Fluids B, In Press 7 K.E. Kreischer and R.J. Temkin, Phys. Rev. Lett. 59 547 (1987)
8 A. Bondeson et al, Int. J. Elect. 53, 547 (1986)
' A. Gover et al, Phys. Rev. A 35, (1987)
10 A. Amir et al, Appl. Phys. Lett. 47, 1251 (1985)
" R.J. Harvey and F.A. Dolezal, Appl. Phys. Lett. 53 1150 (1988)
12 I. Kimel and L. Elias, Phys. Rev. A 38, 2889 (1988)
13 The normalized detuning pi,, is defined by pinj = [(ku + k)vi,, - w]T, where k, and
k are the wiggler and radiation wavenumbers, via; is the axial beam velocity, and
Table 1
FEL parameters for spectral measurement
FEL Parameter Frequency - v,,
Beam Energy - E
Beam Current - Ib
Period - X.
No. of periods - Nper
Und. Length - L,, Res. Length - L, Pulse length - t, Value 1.83 THz 4.9 MeV 2.4 A 3.6 cm 160 5.76 m 7.14 m 1-2 ps
FEL
CW
C0
2LASER
4g
FELLO
FIR LASER
Bc dn GATE FILTER
SCHOTTKY
DIODE
FEL TRIG
DIGITIZER
FoLTEA
I I I I I I I 0 7 j 800 900 1000
NPY\
I I 1100 L.A 0a-z
1200 804 IF FREQUENCY MHz] 900 1000 1100 IF FREQUENCY [MHz]Fig. 2 Typical mode spectra showing (a) single mode lasing and (b) multimode operation
-b
I I I I I I
1200
P
-j
z
-b G5 G4G3G2 GI t1- 2 Cr.


