https://doi.org/10.5194/cp-14-1991-2018 © Author(s) 2018. This work is distributed under the Creative Commons Attribution 4.0 License.
Deglacial to postglacial history of Nares Strait, Northwest
Greenland: a marine perspective from Kane Basin
Eleanor Georgiadis1,2, Jacques Giraudeau1, Philippe Martinez1, Patrick Lajeunesse2, Guillaume St-Onge3, Sabine Schmidt1, and Guillaume Massé2
1Université de Bordeaux, CNRS, UMR 5805 EPOC, 33615 Pessac, France 2Université Laval, UMI 3376 TAKUVIK, Québec, G1V 0A6, Canada
3Université du Québec à Rimouski and GEOTOP Research Center, Institut des sciences de la mer de Rimouski (ISMER), Rimouski, G5L 3A1, Canada
Correspondence:Eleanor Georgiadis (eleanor.georgiadis@u-bordeaux.fr) Received: 26 June 2018 – Discussion started: 11 July 2018
Revised: 3 November 2018 – Accepted: 27 November 2018 – Published: 18 December 2018
Abstract. A radiocarbon-dated marine sediment core re-trieved in Kane Basin, central Nares Strait, was analysed to constrain the timing of the postglacial opening of this Arctic gateway and its Holocene evolution. This study is based on a set of sedimentological and geochemical prox-ies of changing sedimentary processes and sources that pro-vide new insight into the evolution of ice sheet configura-tion in Nares Strait. Proglacial marine sedimentaconfigura-tion at the core site initiated ca. 9.0 cal ka BP following the retreat of grounded ice. Varying contributions of sand and clasts sug-gest unstable sea ice conditions and glacial activity, which subsisted until ca. 7.5 cal ka BP under the combined influence of warm atmospheric temperatures and proglacial cooling in-duced by the nearby Innuitian (IIS) and Greenland (GIS) ice sheets. An interval rich in ice-rafted debris (IRD) is inter-preted as the collapse of the ice saddle in Kennedy Channel ca. 8.3 cal ka BP that marks the complete opening of Nares Strait and the initial connection between the Lincoln Sea and northernmost Baffin Bay. Delivery of sediment by icebergs was strengthened between ca. 8.3 and ca. 7.5 cal ka BP fol-lowing the collapse of the buttress of glacial ice in Kennedy Channel that triggered the acceleration of GIS and IIS fluxes toward Nares Strait. The destabilisation in glacial ice even-tually led to the rapid retreat of the GIS in eastern Kane Basin at about 8.1 cal ka BP as evidenced by a noticeable change in sediment geochemistry in our core. The gradual decrease in carbonate inputs to Kane Basin between ∼ 8.1 and ∼ 4.1 cal ka BP reflects the late deglaciation of Wash-ington Land. The shoaling of Kane Basin can be observed
in our record by the increased winnowing of lighter parti-cles as the glacio-isostatic rebound brought the seabed closer to subsurface currents. Reduced iceberg delivery from 7.5 to 1.9 cal ka BP inferred by our dataset may be linked to the re-treat of the bordering ice sheets on land that decreased their number of marine termini.
1 Introduction
The Holocene history of Nares Strait, Northwest Green-land, has remained somewhat cryptic despite investigations during the past 4 decades (e.g. Blake Jr., 1979; Kelly and Bennike, 1992; Mudie et al., 2004; Jennings et al., 2011.). Nares Strait is a key gateway for Arctic seawater and ice toward the Atlantic Ocean, contributing to up to half of the volume of water transported through the Canadian Arc-tic Archipelago (CAA), which provides fresh water to the Labrador Sea and influences deep water formation (Belkin et al., 1998; Münchow et al., 2006; McGeehan and Maslowski, 2012). Nares Strait supplies one of the most productive re-gions of the Arctic, the North Water Polynya (NOW), with nutrient-rich Pacific water (Jones et al., 2003; Jones and Eert, 2004) and maintains its very existence by trapping sea and calved glacial ice in ice arches in the north and south of the strait (Melling et al., 2001; Mundy and Barber, 2001).
Despite the importance of Nares Strait, intrinsic investi-gations into its late Pleistocene history, which is intimately linked with the dynamics of the bordering Innuitian (IIS) and Greenland (GIS) ice sheets, are relatively sparse and
much of the knowledge relies on land-based studies. Debate initially surrounded early studies into glacial configuration in the CAA with some authors concluding that the CAA channels were not blocked during the Last Glacial Maxi-mum (LGM) (Franklin Ice Complex theory; e.g. England, 1976), while others argued that the IIS coalesced with the bordering Greenland and Laurentide ice sheets (e.g. Blake Jr., 1970). The presence of erratic boulders originating from Greenland on Ellesmere Island (England, 1999), cosmogenic nuclide surface-exposure dating (Zreda et al., 1999), and radiocarbon dating on mollusc shells (e.g. Bennike et al., 1987; Blake Jr. et al., 1992; Kelly and Bennike, 1992) fi-nally settled the argument in favour of the latter narrative by supporting the coalescence of the IIS and GIS along Nares Strait between 19 and ca. 814C ka BP (∼ 22–8.2 cal ka BP, 1R =240). England (1999) reviewed all land-based evi-dence available at that time and proposed a complex deglacial history of Nares Strait, featuring the late break-up of glacial ice in central Nares Strait (i.e. Kennedy Channel). These land-based studies have been complemented by Jennings et al. (2011) and Mudie et al. (2004) investigations of marine sediment cores collected in Hall Basin, northernmost Nares Strait, which record a change in a number of environmental proxies ca. 8.314C ka BP (∼ 8.5 cal ka BP, 1R = 240). More recently, the geophysical mapping of submarine glacial land-forms by Jakobsson et al. (2018) provided additional insight regarding the retreat of Petermann Glacier in Hall Basin, and new surface-exposure dating on moraines in Washing-ton Land demonstrates that the Humboldt Glacier, eastern Kane Basin, abandoned a previous position of stability ca. 8.3±1.7 ka BP (Reusche et al., 2018). To date, little is known about the downstream consequences of the opening of the strait, despite the recovery of multiple marine archives in northernmost Baffin Bay (Blake Jr. et al., 1996; Levac et al., 2001; Knudsen et al., 2008; St-Onge and St-Onge, 2014). Several aspects of the evolution of northernmost Baffin Bay have been explored with regards to ice sheet retreat in the area (Blake Jr. et al., 1996), ice sheet dynamics (St-Onge and St-Onge, 2014), and changes in sea ice conditions and marine productivity during deglacial and postglacial times (Levac et al., 2001; Knudsen et al., 2008; St-Onge and St-Onge, 2014). Unfortunately, however, these archives do not cover a con-tinuous record of the Holocene and the sediments deposited around and before the opening of the strait were not recov-ered or are unable to provide any further information on the timing and consequences of the event.
Here we present sedimentological, geochemical, and geochronological data obtained from a 4.25 m long marine sediment core (AMD14-Kane2b) retrieved in Kane Basin, central Nares Strait. This core provides a continuous sedi-mentary record spanning the last 9.0 kyr, i.e. from the incep-tion of the Early Holocene retreat of the GIS and IIS in Nares Strait to modern times. Our set of sedimentological and geo-chemical records derived from this study presents the first offshore evidence of an ice-free environment in Kane Basin
in the Early Holocene and offers a unique opportunity to ex-plore the local dynamics of ice sheet retreat leading to the opening of the strait and the establishment of the modern oceanographic circulation pattern.
2 Regional settings
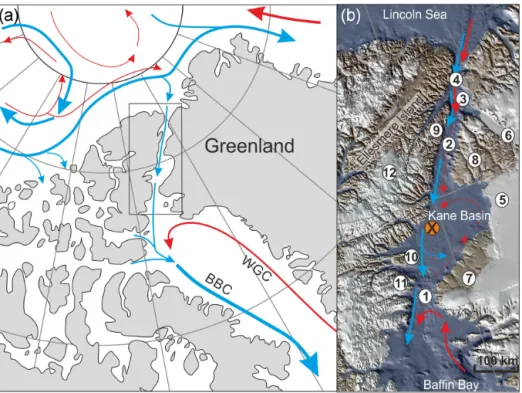
Nares Strait is a long (530 km) and narrow channel separating Northwest Greenland from Ellesmere Island, Arctic Canada, connecting the Arctic Ocean to the Atlantic Ocean in Baf-fin Bay (Fig. 1). Kane Basin is the central, wide (120 km large at its broadest point, totalling an area of approximately 27 000 km2), and shallow (220 m deep) basin within Nares Strait. It separates Smith Sound (600 m deep, 50 km wide) in the south of the strait from Kennedy Channel (340 m deep, 30 km wide) in the north. A smaller but deeper basin, Hall Basin (800 m deep), where the Petermann Glacier terminates, connects Kennedy Channel to the Robeson Channel (400 m deep, 21 km wide) in the northernmost sector of the strait.
The oceanographic circulation in Nares Strait consists of a generally southward-flowing current driven by the barotropic gradient between the Lincoln Sea and Baffin Bay (Kliem and Greenberg, 2003; Münchow et al., 2006), while the baro-clinic temperature balance generates strong, northerly winds that affect surface layers (Samelson and Barbour, 2008; Münchow et al., 2007; Rabe et al., 2012). The relative influ-ence of the barotropic vs. baroclinic factors that control the currents in Nares Strait is highly dependent on the presence of sea ice that inhibits wind stress when landfast (Rabe et al., 2012; Münchow, 2016). Long-term ADCP measurements of flow velocity record average speeds of 20–30 cm s−1 in Kennedy Channel (Rabe et al., 2012; Münchow et al., 2006) and 10–15 cm s−1in Smith Sound (Melling et al., 2001) with the highest velocities measured in the top 100 m of the wa-ter column. Strong currents peaking at 60 cm s−1have been measured instantaneously in Robeson Channel (Münchow et al., 2007). The speed of the flow decreases in the wider sec-tions of Nares Strait. A northward current has been shown to enter Kane Basin from northern Baffin Bay (Bailey, 1957; Muench, 1971; Melling et al., 2001; Münchow et al., 2007). Temperature and salinity isolines imply that an anticlockwise circulation takes place in the surface layers of Kane Basin, while the deeper southward flow of Arctic water is chan-nelled by bottom topography and concentrated in the basin’s western trough (Muench, 1971; Moynihan, 1972; Münchow et al., 2007).
Sea ice concentration in Nares Strait is usually over 80 % from September to June (Barber et al., 2001). The state of the ice varies between mobile (July to November) and fast ice (November to June). The unique morphology of the strait leads to the formation of ice arches in Nares Strait when sea ice becomes landfast in the winter. The ice arches are a salient feature in the local and regional oceanography of Nares Strait: they not only block sea ice from drifting
Figure 1.Schematic circulation in the Canadian and northern Greenland sectors of the Arctic Ocean (a) and within Nares Strait (b). The location of core AMD14-Kane2b is marked by a cross. Blue arrows represent Arctic water and red arrows predominantly Atlantic water. WGC: West Greenland Current, BBC: Baffin Bay Current. 1 – Smith Sound; 2 – Kennedy Channel; 3 – Hall Basin; 4 – Robeson Channel, 5 – Humboldt Glacier; 6 – Petermann Glacier; 7 – Inglefield Land; 8 – Washington Land; 9 – Judge Daly Promontory; 10 – Bache Peninsula; 11 – Johan Peninsula; 12 – Agassiz Ice Cap.
southward in the strait, sustaining the existence of the NOW Polynya (Barber et al., 2001), but they also control the ex-port of low-salinity Arctic water into Baffin Bay (Münchow, 2016). The main iceberg sources for the strait are Petermann Glacier in Hall Basin and Humboldt Glacier in Kane Basin, both outlets of the GIS.
The Greenland coast bordering Kane Basin is relatively flat. In Inglefield Land the Precambrian basement is ex-posed, displaying supracrustal crystalline rocks and meta-morphic rocks, essentially reported as aluminous metased-iments and gneisses or granitoid gneisses, with some ref-erences to quartzite (Fig. 2, Koch, 1933; Dawes, 1976; Dawes and Garde, 2004; Harrisonet al., 2006, and references therein). Dawes and Garde (2004) postulated that this Pre-cambrian basement also underlies the 100 km wide Hum-boldt Glacier, a claim that is supported by the dominance of crystalline material delivered in modern glacimarine sed-iments in front of the Humboldt Glacier (Fig. 2, Kravitz, 1976). To the north, the Precambrian basement in Washing-ton Land is overlaid by Cambrian, Ordovician, and Silurian dolomites, limestones, and evaporites (Koch, 1929a, b; Har-rison et al., 2006, and references therein). The Ellesmere shore of Kane Basin rises abruptly from sea level and is punc-tured by narrow fjords, penetrating inland for nearly 100 km (Kravitz, 1982). In southern Kane Basin, the same Pre-cambrian crystalline rocks outcrop to form the Ellesmere–
Inglefield Precambrian Belt. The central and northern sec-tors of Ellesmere Island’s coast mainly comprise Cambrian to Devonian carbonates and evaporates. Fluviodeltaic quartz sandstone, volcanistic sandstone, minor arkose, and some-times coal are found in the Paleogene Eureka Sound se-quence that occurs along the western coast of Kane Basin, on the Ellesmere Island flank of Kennedy Channel, and on Judge Daly Promontory (Christie, 1964, 1973; Kerr, 1967, 1968; Miall, 1982; Oakey and Damaske, 2004). Coal-bearing Pale-ogene clastics also occur along the coast of Bache Peninsula and in morainic deposits on Johan Peninsula in southwestern Kane Basin (Fig. 2, Kalkreuth et al., 1993).
Kravitz (1976) described modern sedimentation in Kane Basin according to three main provinces defined on the ba-sis of mineralogical and grain size characteristics. The first province covers the eastern, central, and southern part of the basin in which the predominant crystalline clay and silt sedi-ments are water-transported off Humboldt Glacier and Ingle-field Land. The second province, in the west of the basin, in-cludes a higher fraction of ice-transported materials, mostly carbonates with clastic debris occurring in the deeper trough. Northern Kane Basin makes up the third province in which water-transported, mostly carbonate sediments from Wash-ington Land are deposited in its northernmost part, while ice-transported crystalline particles are more common in the southern part of this province.
Figure 2.Geology of Northwest Greenland and Ellesmere Island along Nares Strait. Adapted from Harrison et al. (2011).
3 Material and methods
Sediment core AMD14-Kane2b was retrieved at 217 m of water depth in Kane Basin, Nares Strait (79◦31.1400N; 70◦53.2870W) during the 2014 ArcticNet expedition of the CCGS Amundsen. This core was collected with a wide-square section (25 cm × 25 cm) gravity corer (Calypso Square or “CASQ”) and immediately subsampled onboard using large U channels.
3.1 Sedimentological analyses
The description of the various lithofacies was based on the vi-sual description of the core and high-resolution images using a computed tomography (CT) scanner (Siemens SOMATOM Definition AS+ 128 at the Institut National de la Recherche Scientifique, Quebec, Canada). Changes in sediment density were estimated from variations in the CT numbers, which were processed according to Fortin et al. (2013). To com-plement CT analyses, a series of thin sections covering two intervals were sampled across major lithological changes to-ward the base of the core (425–405 and 373.5–323.5 cm) in order to visualise the internal structure and examine the na-ture of these facies. The thin sections were prepared accord-ing to Zaragosi et al. (2006). Grain size analyses were per-formed at intervals of 2 to 4 cm throughout the archive. A Malvern 2000 laser sizer was used to determine the relative contribution (expressed as % of particles) of clay and colloids (0.04–4 µm), silt (4–63 µm), and sand (63–2000 µm) within the < 2 mm fraction. The same samples were also subjected to wet sieving through 63, 125, and 800 µm meshes in
or-der to determine the weight fraction of sands and identifiable ice-rafted debris (IRD), expressed as % weight of the bulk dry sediment.
3.2 XRF core scanning
High-resolution (0.5 cm) X-ray fluorescence (XRF) scanning was conducted along the archive using an Avaatech XRF core scanner. The semi-quantitative elemental composition of the sediment was measured throughout the whole archive with the exception of two units, which contain large clasts. Mea-surements were acquired with generator settings of 10, 30, and 50 kV in order to detect elements in the range of Al to Ba. Elemental ratios or normalisation to the sum of all elements except Rh and Ag, whose counts are biased during data ac-quisition, were used to minimise the effects of grain size and water content on elemental counts (Tjallingii et al., 2007; Weltje and Tjallingii, 2008). XRF core-scanner-derived el-emental ratios have been used as a time-efficient method to assess down-core variations in grain size (e.g. Guyard et al., 2013; Mulder et al., 2013; Bahr et al., 2014) and/or sediment sources for detrital material in similar high-latitude locations (e.g. Møller et al., 2006; Bervid et al., 2017). The applica-bility of this approach in Kane Basin is tested in the present study by using Ti / K and Fe / Ca as proxies for grain size and sediment source, respectively. We also demonstrate a corre-lation between normalised K counts and clay content in core AMD14-Kane2b.
Figure 3.210PbXSand137Cs profiles in AMD14-Kane2b box core (circles).210PbXSdata points in the top part of AMD-Kane2b grav-ity core have been shifted to obtain the best correspondence of the plots, yielding a material loss of 4 cm at the top of the gravity core.
3.3 Chronology and radiocarbon dating in Nares Strait The chronology is based on a set of 18 radiocarbon ages ob-tained from mixed benthic foraminifera samples and uniden-tified mollusc shells. The core top is dated at −5 years BP (1955 CE) based on210Pb measurements and a comparison with the210Pb profile (Fig. 3) obtained from a box core col-lected at the same coring site.
Reservoir ages in Nares Strait are difficult to assess ow-ing to the scarcity of pre-bomb specimens in collections of marine shells from the area. Only three molluscs were dated in Nares Strait with 1R ranging between ∼ 180 and ∼320 years, comparing relatively well with molluscs from the western sector of northernmost Baffin Bay (1R of ∼ 140 and ∼ 270), while molluscs collected near Thule, North-west Greenland, yielded negative 1R (McNeely et al., 2006). Coulthard et al. (2010) proposed a regional 1R for the CAA of 335 years based on the McNeely et al. (2006) dataset of pre-bomb radiocarbon-dated molluscs and taking into ac-count the general oceanographic circulation in the CAA. However, unlike in other passages of the CAA, which present shallow sills at their southern extremities, younger Atlantic water from Baffin Bay enters Nares Strait – or at least Kane Basin – from the south (Bailey, 1957; Muench, 1971; Mün-chow et al., 2007). We thus choose to correct14C ages in this study with the average 1R of the three pre-bomb collected mollusc shells in Nares Strait, i.e. 240 ± 51 years, bearing in mind that reservoir ages are likely between 0 and 335 years and may have changed through time as a consequence of the major oceanic reorganisation in Nares Strait. Radiocar-bon dating in Nares Strait is further complicated by the
prox-imity of old carbonate rocks that are prone to introducing additional uncertainties in the14C ages yielded by deposit-feeding molluscs (England et al., 2013). The non-systematic discrepancies between ages yielded from deposit feeders and those from suspension-feeding molluscs – the so-called Port-landiaeffect (England et al., 2013) – cannot be corrected. However, this represents a greater challenge for land-bound studies that pinpoint the timing of the deglaciation of a given location based on the oldest mollusc found in that location. In contrast, when establishing the age model of sediment cores, the age vs. depth relationship reveals any outliers that can be identified as either (1) remobilised by ice rafting, slumping, or bioturbation or (2) potentially affected by the Portlandia effect. Hence, we deem the Portlandia effect to be of minor concern in the establishment of the age model in this study despite the possible inclusion of deposit feeders in our radio-carbon dataset. The14C ages were calibrated with the Ma-rine13 curve (Reimer et al., 2013) using Calib7.1 (Stuiver et al., 2018) with a marine reservoir age correction of 640 years (1R = 240±51). We computed an age–depth model for core AMD14-Kane2b based on radiocarbon-dated material using CLAM 2.2 (Blaauw, 2010) as a smooth spline with a smooth-ing level of 0.4 and assumsmooth-ing that a 20 cm long clast-rich de-posit (300–320 cm) was dede-posited near instantaneously at the scale of our chronology.
4 Results and interpretations
4.1 Age model and sedimentation rates in core AMD14-Kane2b
According to our chronology, core AMD14-Kane2b covers approximately the last 9.0 kyr (Fig. 4). The comparison of the210Pb profiles of core AMD14-Kane2b and the box core collected at the same location reveals the relatively good recovery of the topmost sediments in the CASQ core per-mitted by the large diameter of this corer (sediment loss of ∼4 cm; Fig. 3). Fourteen of the14C ages yielded consistent values along a smooth spline, while four outlying radiocar-bon ages were excluded from the age model. Only one mol-lusc fragment was dated (at 301.5 cm) and yielded an age of > 43 ka; it is thus clearly remobilised (Table 1). A whole mol-lusc shell at 238.5 cm yielded a radiocarbon age about 1 kyr older than expected and is the only specimen we suspect of being affected by the Portlandia effect. Two mixed benthic foraminifera samples yielded ages older than expected and most likely include older specimens.
Major changes in depositional environments, most partic-ularly during the time interval corresponding to the lower half of our sediment core, explain the wide range of sedi-mentation rates. High sedisedi-mentation rates are observed be-tween the base and ∼ 250 cm, where they decrease from ∼220 to 30 cm ka−1, and after which sedimentation rates in-crease to reach 50 cm ka−1at 120 cm before decreasing again to ∼ 20 cm ka−1at the top of the core.
Figure 4.Core AMD14-Kane2b age model (a) and sedimentation rates (b). The age model is a smooth spline computed using CLAM 2.2 with a smoothing level of 0.4 based on selected radiocarbon dates presented in Table 1. 1σ uncertainty is shown in grey.14C ages excluded from the age model (time reversals) are crossed out in red.
Table 1.AMS radiocarbon ages on selected carbonate material. Asterisks indicate data that were not used in the age model. MBF: mixed benthic foraminifera, MS: unidentified mollusc shell.
Laboratory code Dated Depth 14C age (a BP) Median 1σ 1R = 0 Median 1σ 1R = 240 material (cm) probability age (cal a BP) probability age (cal a BP)
(cal a BP) (cal a BP) 1R =0 1R =240 SacA-46000 MS 58.5 3150 ± 35 2932 2869–2984 2700 2673–2736 UGAMS-24304 MS 59 3125 ± 25 2900 2854–2941 2683 2655–2720 UGAMS-24305 MS 62 3010 ± 25 2775 2739–2802 2502 2428–2575 SacA-46003 MBF 122 6125 ± 45* 6555 6494–6617 6205 6259–6356 UCIAMS-173009 MS 139 4540 ± 20 4760 4764–4809 4427 4392–4453 UGAMS-24307 MS 186 5445 ± 25 5823 5780–5876 5572 5541–5602 UGAMS-24295 MS 207.5 6005 ± 25 6417 6382–6458 6005 6168–6240 UCIAMS-173006 MS 238.5 8175 ± 20* 8651 8595–8690 8389 8363–8411 SacA-46002 MBF 251.5 7250 ± 60 7714 7649–7780 7503 7451–7555 SacA-45999 MBF 273.5 7870 ± 50 8336 8290–8388 7870 8026–8147 Beta-467584 MBF 297.5 7980 ± 30 8433 8388–8469 8215 8167–8259 UGAMS-24294 MS fragment 301.5 43700 ± 225* Beta-467583 MBF 310.5 9380 ± 30* 10210 10180–10234 9907 9821–10001 Beta-467583 MBF 327.5 8160 ± 30 8633 8577–8685 8379 8347–8405 SacA-46001 MBF 333.5 8200 ± 60 8709 8587–8796 8422 8358–8482 UCIAMS-173007 MS 358.5 8450 ± 20 9050 9002–9080 8703 8637–8752 UCIAMS-173008 MS 362.5 8520 ± 20 9149 9094–9205 8840 8773–8908 UGAMS-24296 MS 407.5 8640 ± 30 9318 9272–9373 8998 8968–9021
4.2 Relationship between XRF data, grain size, and sediment sources
In modern sediments, the spatial variability of sediment geo-chemistry in Kane Basin is likely related to their provenance. Heavy crystalline minerals (e.g. garnet and orthopyroxene)
occur in the eastern province of the basin with provenance from the Humboldt Glacier and Inglefield Land, whereas car-bonates in its western sector are sourced from Ellesmere Is-land or from Washington Land in its northern sector (Fig. 2, Kravitz, 1976). The geochemical composition of modern
sediments varies likewise, with notably high concentrations of Fe and Zn in the eastern sector of Kane Basin (Kravitz, 1994). Although the exact chemical variability of the source geological units is not known at present, we consider the sedimentary rocks from eastern Kane Basin and northern Nares Strait likely to be rich in Ca, whereas higher concen-trations of Fe, Si, and K presumably characterise the crys-talline rocks of the Ellesmere–Inglefield Precambrian Belt. We propose the use of Fe / Ca in our study to follow the po-tential erosion of rocks from under the Humboldt Glacier and Inglefield Land (presumably Fe-rich) and from Ellesmere Is-land (presumably Ca-rich). We then infer the position of the GIS and IIS in relation to the core site and the geological units. It can be noted, however, that a direct link between the XRF-derived elemental composition of the sediment and the nearby geological units can be compromised by the ubiqui-tous nature of certain elements in crystalline and sedimentary rocks, along with the sensitivity of elemental signals to grain size when using XRF core scanning. The interpretations of our XRF dataset in terms of sediment sources warrant con-firmation by future research into the mineral associations in core AMD14-Kane2b (Caron et al., 2018). The inferred po-sition of the GIS margin in Kane Basin exposed hereafter, however, is unlikely to be affected by the outcome of the lat-ter study owing to our sedimentological and grain size studies that provide evidence for the distance of the ice margin to the coring site.
XRF counts in core AMD14-Kane2b are largely domi-nated by Ca and Fe, which are anticorrelated. Our records show a good correlation between normalised K counts and clay content in the < 2 mm fraction (laser diffraction grain size data) with a correlation factor of r2=0.57 that reaches r2=0.73 by removing nine outlying data points from the to-tal 150 samples analysed by laser diffraction (Fig. 6, Fig. S1 in the Supplement). Likewise, there is an excellent correla-tion between silt content and the Ti / K ratio from the XRF elemental composition data. The correlation factor between % silt and Ti / K is r2=0.35, but rises to r2=0.84 by re-moving nine outlying data points (seven of which are dif-ferent to those removed to improve the correlation between K counts and % clay, mainly from lithological units 3A and 3C presented hereafter). The similar trends of normalised K counts and the Fe / Ca ratio in units 2, 3, 4, and 5 suggest that the clay content and sediment source may be linked or respond to the same controlling factor.
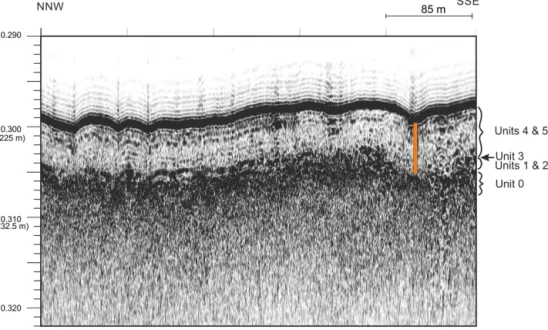
4.3 Lithological units and sedimentological processes The chirp 3.5 kHz sub-bottom profile obtained prior to core recovery is shown in Fig. 5. Given the good recovery of re-cent sediments at the top of core AMD14-Kane2b (Fig. 3), we place the top of core AMD14-Kane2b at the sediment– water interface on this profile. Assuming an acoustic ve-locity of 1500 m s−1, the base of the core reached a coarse unit (unit 0) shown to continue below the retrieved sediment
(Fig. 5), which is likely to have stopped the penetration of the CASQ corer. The high level of backscatter, discontinu-ous reflectors, and lack of internal coherence in unit 0 are all discriminant acoustic characteristics of diamicton, which contains high amounts of unsorted clasts in a clay to silt ma-trix (Davies et al., 1984). We interpret this diamicton as being either subglacial till or the first glacimarine sediments de-posited during the retreat of the marine-based ice sheet mar-gin.
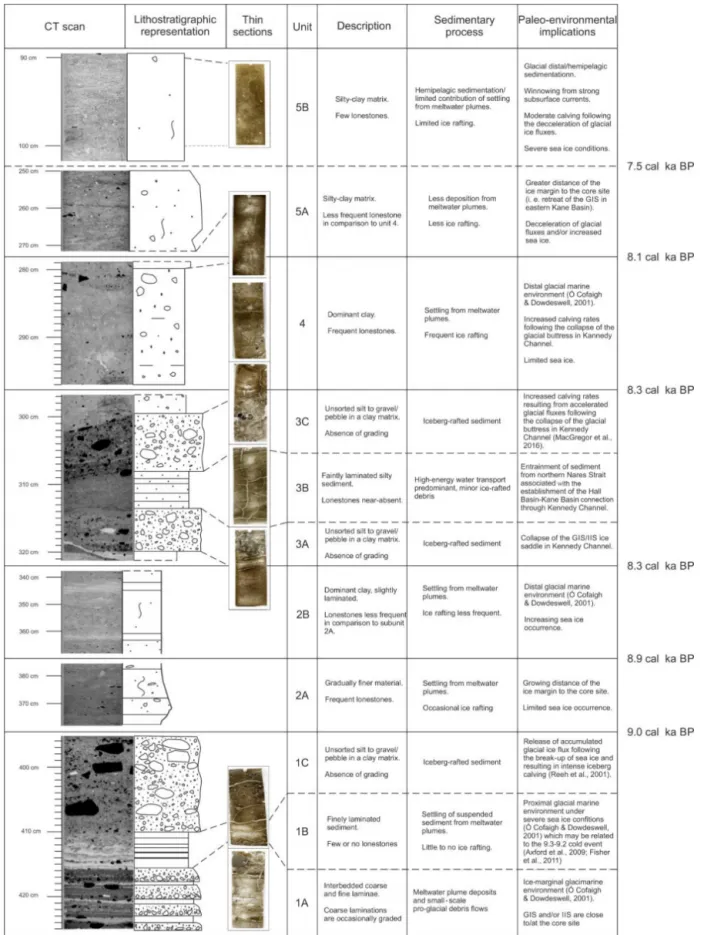
Based on CT scans and grain size records, five lithologi-cal units were defined for core AMD14-Kane2b, each corre-sponding to specific depositional environments (Fig. 6, Ta-ble 2). The sedimentological processes at play will be ex-amined here, while their environmental significance will be considered in the discussion section of this paper.
Unit 1 (425–394 cm, ca. 9.0 cal ka BP) encompasses three subunits of distinct lithological nature.
Subunit 1A (425–416 cm) consists of high-density, occa-sionally sorted coarse sediment in a clayey matrix, interbed-ded with thinner layers of lower-density silty clay (Table 2). The base of the coarser laminations shows erosional con-tact with the underlying finer beds (thin sections in Table 2). Grain size analysis reveal large amounts of sand (26 %–39 %) and silt (24 %–32 %) in the < 2 mm fraction in this interval. The relative weight of the 125–800 µm and > 800 µm frac-tions also contributes considerably to the overall weight of the sediment (18 % and 11 %, respectively).
These laminated deposits display all the characteris-tic of ice-proximal deposits (List, 1982; Ó Cofaigh and Dowdeswell, 2001). Unit 1A was most likely deposited at the ice sheet margin some ∼ 9.0 cal ka ago, according to a dated mollusc shell at the base of unit 1C and given the very high sedimentation rates in ice-proximal environments.
Subunit 1B (416–410 cm) displays a sharp decrease in sed-iment density with the replacement of sand by finer material (60 % clay in the < 2 mm fraction; Fig. 6, Table 2). While subunit 1B encompasses some clasts (CT scan in Table 2), the amount of sand and silt actually present in 1B may be lower than reflected by the laser diffraction and wet-sieving data, as the analysed samples likely included coarser material from the overlying and underlying subunits 1A and 1C. XRF data for subunit 1B show high Fe / Ca and Ti / Ca ratios and low Ca counts.
The finer grain size in this subunit is indicative of a change from an ice margin to an ice-proximal glacimarine environ-ment in which suspended matter settling from turbid meltwa-ter plumes is likely the main depositional process (Elverhøi et al., 1980; Syvitstki, 1991, Dowdeswell et al., 1998; Hogan et al., 2016), although the limited thickness (4 cm) of subunit 1B is rather unusual for this process. The geochemical grain size tracers Ti / K and K show poor correlation with the rel-atively low silt and high clay content in subunit B2. While K counts are low, Ti / K ratios are high, which may suggest a high-energy environment, supporting the previous hypothe-sis of an ice-marginal environment in which meltwater pulses
Figure 5.3.5 kHz chirp profile across the coring location. Core AMD14-Kane2b is represented by the orange box. Vertical scale in s (TWT) with depth conversion assuming 100 ms (TWT) = 75 m.
can transport relatively large particles. High Fe / Ca is evoca-tive of an eastern origin of the sediments in subunit 1B, im-plying that the GIS was close to the core site.
Subunit 1C (410–394 cm) interrupts the fine-grained sedi-mentation with a sharp increase in the occurrence of outsized clasts. The coarser fractions account for a significant part of the sediment (up to 18 % for both the > 800 and 800–125 µm fractions) within a dominantly clayey matrix. Sediment den-sity in subunit 1C increases to reach values similar to those observed in subunit 1A. However, unlike subunit 1A, subunit 1C is not laminated and clasts are larger (frequent gravel) and ungraded.
Given the high gravel content in subunit 1C, we consider the clasts to have been predominantly iceberg-rafted to the core location rather than sea-ice-rafted (Pfirman et al., 1989; Nürnberg et al., 1994). These large amounts of IRD among very poorly sorted material can be interpreted as (1) in-creased iceberg calving rates, (2) changes in the delivery of sediment by icebergs (increased melting of or dumping from icebergs), or (3) a severe decrease in the delivery of finer par-ticles that increases the apparent contribution of clasts to the sediment (Hogan et al., 2016, and references therein).
Unit 2 (394–320 cm, 9.0–8.3 cal ka BP) can be divided into two subunits based on grain size and density. The relative weight of the coarse fraction varies throughout unit 2 with a generally decreasing trend.
Subunit 2A (394–370 cm, 9.0–8.8 cal ka BP) is composed of poorly sorted, bioturbated sediment (∼ 55 % clay and ∼38 % silt in the < 2 mm fraction) with varying contribu-tions of coarser material (between ∼ 0 and 5 %) and occa-sional lonestones (Fig. 6, Table 2). Sediment density is fairly
high, but gradually decreases toward the top of subunit 2A. Ti / K decreases gradually in this subunit, mirroring the de-crease in density and opposing the inde-crease in K counts. The Fe / Ca ratio is low at the base of subunit 2A before increas-ing upward in this subunit.
The dominance of fine particles in subunit 2A with occa-sional clasts points to a delivery by meltwater plumes and iceberg rafting. The decreasing Ti / K and silt content along with increasing K counts and clay suggests a growing dis-tance of the ice margin from the core site since coarser silts and Ti-bearing minerals settle closer to the ice mar-gin, while clay particles tend to sink in more ice-distal loca-tions (Dowdeswell et al., 1998; Ó Cofaigh and Dowdeswell, 2001). Increasing Fe / Ca in subunit 2A may indicate a grow-ing contribution of Paleozoic carbonates on Ellesmere Island in western Kane Basin and/or Washington Land in northern Kane Basin (Fig. 2).
The sediments of subunit 2B (370–320 cm, 8.9– 8.3 cal ka BP) have a lower density and a lower sand and silt content than those of subunit 2A, while clay content reaches maximum values averaging 63 %. Scarce lonestones occur in this subunit and the sediment appears to be faintly laminated. Four biogenic carbonate samples, both mollusc and mixed benthic foraminifera samples, were dated in subunit 2B, and high sedimentation rates of ∼ 130 cm ka−1 decreasing upward to 90 cm ka−1were calculated from the age model (Table 1, Fig. 4). Subunit B2 is characterised by low Ti / K and high K and Fe / Ca.
These high sedimentation rates, substantial concentrations of clay, and the slightly laminated aspect of subunit 2B in-dicate that these sediments were mainly delivered by
melt-Figure 6.Sedimentological results and elemental signature of the detrital fraction of core AMD14-Kane2b. Laser diffraction grain size repartition (< 2 mm fraction) is shown as % sand, silt, and clay. Normalised Zr counts are not shown but their profile is similar to that of Ti.
water plumes in a more distal glacial setting (Ó Cofaigh and Dowdeswell, 2001). Relatively high Fe / Ca possibly reflects an increased contribution from eastern Kane Basin gneisses. Unit 3 (320–300 cm, 8.3 cal ka BP) stands out as a clast-rich interval. The high density of this unit is comparable to that of subunits 1A and 1C. CT scans and thin sections reveal the presence of a finer-grained horizon enclosed be-tween coarser material, dividing this interval into three sub-units (Table 2).
Subunit 3A (320–313 cm) corresponds to the lower clast-rich subunit. A significant portion of the bulk sediment is attributed to 800–125 µm sand (17 % wt) and > 800 µm sand (up to 7 % wt), while the clay matrix contributes to ∼ 53 % of the < 2 mm fraction. Ti / K ratios are high, whereas Fe / Ca ratios and K have significantly decreased compared to the underlying subunit 2B (Fig. 6).
The high clast content and absence of grading suggest that the sediments forming subunit 3A were ice-rafted and de-posited at the core location (Ó Cofaigh and Dowdeswell,
Table 2.Details of CT scans and thin sections for each lithologic unit of core AMD14-Kane2B and summarised descriptions and interpreta-tions. The paleo-environmental implications discussed in this study have been outlined here.
2001). The predominant carbonate (low Fe / Ca) material in this subunit likely originates from northern and/or western Kane Basin.
Faint laminations are visible on the CT scan images of subunit 3B (313–305 cm). The sediment of this subunit is composed essentially of clay and silt (47 % and 43 %, re-spectively) with a relatively low sand content (< 10 % in the < 2 mm fraction and each of the coarser fractions represents less than 3 % of the sediment weight). Ti / K ratios have slightly decreased relative to 3A, but remain high and dis-play a slightly increasing trend. K counts and Fe / Ca ra-tios remain low. Analysis of the sieved residues revealed the presence of benthic foraminifera in this subunit, which were picked and dated at ∼ 9.414C BP (9.9 cal ka BP with 1R =240; Table 1).
The poor sorting of sediments in subunit 3B could possi-bly indicate that they were ice-transported, but the near ab-sence of clasts (e.g. in contrast to the overlaying and under-lying subunits of interval 3) contradicts this hypothesis. The modest contribution of clay along with the relatively high silt content rather points to the transport and deposition of these sediments by a high-velocity current. The elemental signa-ture of this subunit (low Fe / Ca) denotes a probable north-ern and/or westnorth-ern Kane Basin origin. Concnorth-erning the old age yielded from the mixed benthic foraminifera picked in this subunit, the age model shows that these foraminifera were remobilised. It is possible that a small quantity of pre-Holocene foraminifera was mixed in with living fauna. This would imply that sediments predating the last glacia-tion (> 22 cal ka BP) were preserved under the extended GIS and IIS in Nares Strait and were eroded and transported to the core site during the deposition of subunit 3B. An alter-native explanation is that the sample is composed of post-glacial specimens of a similar age which were eroded from the seabed and transported to the site.
Subunit 3C (305–300 cm) contains large amounts of coarse material with an average of 44 % sand and only 32 % clay in the < 2 mm fraction. The sand in this subunit is coarser than in 3A with the 800–125 µm fraction contributing to ∼34 % of the total sediment, while up to a further 10 % of the sediment weight is accounted for by the > 800 µm frac-tion. Ti / K ratios (high) and K counts (low) are similar to subunit 3A, whereas Fe / Ca ratios are high in subunit 3C (Fig. 5).
The very high clast content of subunit 3C along with high Ti / K ratios and the absence of grading are indicative of iceberg rafting and deposition. The shell fragment that was dated in the topmost horizon of this subunit (> 4214C BP) was clearly remobilised, likely by ice rafting. The sedi-ment forming subunit 3C appears to originate from eastern Kane Basin (Fig. 2) given the high Fe / Ca ratio. The age model points to rapid sedimentation of unit 3 with an age of 8.22 cal ka BP on mixed benthic foraminifera picked from the horizon directly above unit 3, and an age of 8.38 cal ka BP
in a sample 7 cm below the base of unit 3 that extrapolates to ∼8.29 cal ka BP at 320 cm in the age model (Table 1, Fig. 4). Unit 4 (300–280 cm, 8.3–8.1 cal ka BP) has a similar den-sity and clay content (∼ 58 %) to subunit 2B. The contribu-tion of sand in these sediments, however, is higher than in subunit 2B with ∼ 6.5 % weight accounted for by > 125 µm sand and ∼ 14 % sand in the < 2 mm fraction. The elemental composition of unit 4 is also fairly similar to that of subunit 2B. Ti / K ratios are low, while K counts and Fe / Ca ratios are high (Fig. 6).
The high clay content of unit 4 suggests that delivery from meltwater plumes was the dominant sedimentary process at play during this time interval. The substantial amount of sand in this unit indicates that a significant proportion of the sedi-ment was also ice-rafted to the location. As previously men-tioned, the increase in ice-rafted debris can indicate (1) in-creased calving rates when originating from iceberg rafting, (2) changes in iceberg delivery of sediment (increased melt-ing or dumpmelt-ing of icebergs), or (3) a decrease in the deliv-ery of finer particles that increases the apparent contribu-tion of clasts to the sediment (Hogan et al., 2016, and refer-ences therein). The high sedimentation rates (∼ 90 cm ka−1 from the age model and ∼ 190 cm ka−1from the linear inter-polation between the dates at 297.5 cm (8.22 cal ka BP) and 273.5 cm (8.09 cal ka BP); Table 1, Fig. 4) support this narra-tive of delivery by meltwater and ice rafting that are typically responsible for the transport and deposition of large quanti-ties of sediment (Svendsen et al., 1992; Dowdeswell et al., 1998), while seemingly excluding the possibility of a signif-icant decrease in the delivery of finer particles. High Fe / Ca values suggest that a notable portion of the sediments origi-nates from the Precambrian gneisses of eastern Kane Basin, while the slightly decreasing trend displayed by this elemen-tal ratio could potentially be linked to a progressive increase in the contribution of carbonate-rich formations from north-ern and/or westnorth-ern Kane Basin in this interval.
Unit 5 (280–0 cm, 8.1–0 cal ka BP) clearly differs from un-derlying units with regard to the < 2 mm grain size fraction (Fig. 6). The clay content drops to steady, lower values (49 % on average) and the CT scans show a generally homogenous sediment with frequent traces of bioturbation. Changes in grain size divide unit 5 into two subunits.
The sediments in subunit 5A (280–250 cm, 8.1– 7.5 cal ka BP) contain a relatively high proportion of sand peaking at 12 % in the < 2 mm fraction, while the combined contribution of the coarser fractions averages at ∼5.5 % weight. Lonestones occur frequently and are visible in the CT scan images. K counts and Fe / Ca ratios drop sharply to lower values at the base of subunit 5A (Fig. 6). Ti / K is low, but increases very discreetly toward the top of this subunit.
The significant decrease in clay particles in subunit 5A compared to units 4 and 2B suggests that delivery from melt-water plumes was reduced in this interval, either in relation to a decrease in glacial melting rates or to a more ice-distal
setting. The sharp decrease in the Fe / Ca ratio between unit 4 and unit 5 is interpreted as a sudden reduction in the contri-bution of gneissic material in the sediments of core AMD14-Kane2b.
Subunit 5B (250–0 cm, 7.5–0 cal ka BP) is generally ho-mogenous with lonestones occurring sporadically through-out. The silt content increases gradually from ∼ 40 to ∼ 47 % toward the top of the core. The contribution of the coarser fractions to the total sediment weight is fairly stable from the base to ∼ 40 cm (1.9 cal ka BP), where the 63–125 µm and > 125 µm fractions account for ∼ 2 % and < 1 % of the to-tal sediment weight, respectively. The relative weight of the 63–125 µm sand fraction doubles to ∼ 4 % in the top 40 cm of the core (Fig. 5). Both Fe / Ca and Ti / K ratios increase gradually until ∼ 120 cm (∼ 4.1 cal ka BP) after which they remain relatively high until the core top.
A sample of mixed benthic foraminifera yielded a radio-carbon age some 2 kyr older than expected at 238.5 cm. This sample probably contains a mixture of coeval and remo-bilised foraminifera (either by bioturbation or by water–ice transport from another location).
The overall limited contribution of the coarser fractions to the sediment of subunit 5B in comparison to the un-derlying lithologic units indicates that ice delivery of sedi-ment was reduced during this interval. Furthermore, the rel-atively low amounts of clay imply that meltwater delivery was also weakened. The sediments of subunit 5B were likely primarily water-transported to the core site (Gilbert, 1983; Hein and Syvitski, 1992). The increase in silt and Ti / K to-ward the top of the core suggests winnowing by an increase in bottom current (Mulder et al., 2013; Bahr et al., 2014). Relatively low sedimentation rates (20–50 cm ka−1) corrob-orate the narrative that delivery from meltwater plumes was limited in favour of a more hemipelagic sedimentation regime, also supported by the visible bioturbation in this subunit. The increase in fine sand in the most recent sed-iment may be due to a resumption of ice rafting over the last 1.9 cal ka BP. The gradually increasing trend of Fe / Ca suggests that the contribution of carbonates from northern and/or western Kane Basin diminishes gradually between ∼270 cm (∼ 7.9 cal ka BP) in subunit 5A and ∼ 120 cm (∼ 4.1 cal ka BP) in subunit 5B after which it remains stable un-til the top of the core.
5 Discussion
Our study of core AMD14-Kane2b has enabled us to re-construct a succession of depositional environments in Kane Basin following the retreat of the formerly coalescent GIS and IIS in Nares Strait (Fig. 8). Here we discuss our recon-structions in light of other paleoceanographic and paleocli-matic studies to provide a broader view of the Holocene his-tory of Nares Strait (Figs. 6, 7, and 8, Table 2).
Previous studies have shown that the presence of er-ratic Greenland boulders on Ellesmere Island from Kennedy Channel to the northern entrance of Nares Strait attest to the coalescence of the IIS and GIS along the western side of northern Nares Strait during the Last Glacial Maximum (LGM) (e.g. England, 1999). The absence of such erratics along the western and southern coasts of Kane Basin implies that the confluence of the two ice sheets was further at sea in the southern half of the strait (England, 1999). Radiocar-bon dating on samples from raised beaches provides mini-mum ages for marine ingress in Nares Strait. These ages are older in the northern and southern extremities of the strait, while only younger ages are yielded by samples in north-ern Kane Basin and Kennedy Channel, implying that a cen-tral (grounded) ice saddle persevered longer in the shallower sector of the strait (England, 1999, and references therein; Bennike, 2002). In addition to providing minimum ages for ice sheet retreat, 14C dating on marine-derived material in raised beaches enables one to identify the former shoreline and assess the glacio-isostatic readjustment of the continen-tal crust. However, this approach can only provide minimum ages for (glacial ice-free) aquatic environments at a given place and time and does not necessarily correspond to the po-sition of the ice margin, which can be several kilometres in-land. Cosmogenic nuclide surface-exposure dating is an effi-cient method to temporally constrain inland ice sheet retreat. However, such investigations are scarce in Nares Strait: only two studies document the glacial retreat on Hans Island, off Greenland in Kennedy Channel (Zreda et al., 1999), and in Washington Land (Reusche et al., 2018). England’s (1999) paleogeographical maps of ice sheet retreat in Nares Strait based on radiocarbon-dated molluscs were revised in Fig. 8 in which offshore limits for the GIS and IIS are proposed based on our sedimentological and geochemical data from core AMD14-Kane2b. The continuous nature of our record also allows us to propose a more precise chronology of the deglaciation of central Nares Strait.
5.1 Ca. 9.0 cal ka BP: ice sheet retreat in Kane Basin Our archive demonstrates that marine sedimentation took place in Kane Basin as early as ∼ 9.0 cal ka BP. Grain size characteristics and sedimentary structures suggest that the laminated basal unit (1A) represents the topmost deposits in the ice-marginal environment shortly after ice sheet re-treat at the core site (Figs. 5 and 8b, Table 2). The settling of meltwater plume sediments in the proximal glacial ma-rine environment that followed (1B) is devoid of IRD and seems to have been interrupted by an iceberg-rafted inter-val (1C). The absence of molluscs predating 8.8 cal ka BP in Kane Basin (England, 1999) likely indicates that following the deglaciation of Smith Sound ca. 9.9 cal ka BP (Fig. 8a–c, England, 1999), ice sheet retreat in Kane Basin occurred off the current coast where melting was potentially enhanced by the increasing influence of warmer Atlantic water from the
Figure 7. Comparison of sieved grain size data from AMD14-Kane2b and paleoceanographic proxies from HLY03-05CG in Hall Basin (Jennings et al., 2011). Radiocarbon ages presented in Jennings et al. (2011) were calibrated with 1 = 240±51 (Table S4 in the Supplement) years and the age model for core HLY03-05CG is a linear interpolation between the calibrated ages.
West Greenland Current after 10.9 cal ka BP, 1R = 0 (Fun-der, 1990; Kelly et al., 1999; Knudsen et al., 2008). Based on the sedimentary properties of subunit 1A, we propose that ca. 9.0 cal ka BP, the GIS–IIS ice margin was located at the core site, completing the offshore area of England’s (1999) pale-ogeographical map for this period (Fig. 8b). The IRD-rich unit 1C, which appears to have been deposited by intense ice calving, could potentially mark the opening of Kennedy Channel. Our age of ∼ 9.0 cal ka BP for this unit agrees rel-atively well with the inferred age of an IRD-rich unit in a sediment core from Hall Basin that was interpreted as the opening of Kennedy Channel at ∼ 8.6 cal ka BP (1R = 240) (Jennings et al., 2011). Alternatively, unit 1C could have been deposited during a readvance of the IIS–GIS in Kane Basin in relation to a cold event. Laurentide ice sheet readvances have been documented through the dating of end and lateral moraines on Baffin Island aged between 9 and 8 cal ka BP (Andrews and Ives, 1978) and have been linked to colder pe-riods. A particularly cold event ca. 9.2–9.3 cal ka BP, which is reported in the regional literature from ice core (Vinther et al., 2006; Fisher et al., 2011) and lacustrine records (Ax-ford et al., 2009), may be the source of the calving event
in Kane Basin that led to the deposition of unit 1C. Reser-voir ages in Kane Basin are likely to have been reduced prior to the collapse of the IIS–GIS ice saddle in Kennedy Chan-nel and the arrival of poorly ventilated Arctic water. The age of unit 1 with 1R = 0 is 9.3 cal ka BP, which suggests to us that subunit 1C could well have been deposited during the 9.2–9.3 cal ka BP cold event.
5.2 9.0–8.3 cal ka BP: ice-proximal to ice-distal environment in Kane Basin
The increasingly finer particles that compose unit 2 suggest a growing distance between the core site and the ice mar-gin. The dominant sedimentary process at play is settling from meltwater plumes, which is typically responsible for high sedimentation rates, along with frequent delivery of IRD (Table 2). The Early Holocene was characterised by high at-mospheric temperatures during the Holocene Thermal Maxi-mum (HTM) occasioned by greater solar insolation (Bradley, 1990). The HTM has been defined for the eastern sector of the CAA as the period between 10.7 and 7.8 cal ka BP based on the Agassiz ice core record (Lecavalier et al., 2017). The high melting rates of the ice sheets during the HTM (Fisher
Figure 8.GIS and IIS retreat in Nares Strait. Adapted from England (1999) and including data from Bennike (2002) for Washington Land. Locations for core AMD14-Kane2b in Kane Basin and HLY03-05 (Jennings et al., 2011) in Hall Basin are marked by crosses. All mollusc ages from England (1999) were calibrated with 1R = 240 using Calib 7.1 (Stuiver et al., 2018) after first adding 410 years to the calibrated ages presented in England (1999) (Table S2 and Fig. S3 in the Supplement). The position of the GIS and IIS margins offshore in Kane Basin are deduced from our sedimentological and geochemical data, while their locations in Hall Basin are deduced from the data presented in Jennings et al. (2011) and Jakobsson et al. (2018).
et al., 2011) likely enhanced the delivery of particles by melt-water and contributed to the high sedimentation rates ob-served in our core. More distant glacial ice from the site is also in good agreement with the occurrence of molluscs dated between 8.8 and 8.4 cal ka BP on Ellesmere Island and Northwest Greenland (Fig. 8c, England, 1999). The elemen-tal signature of subunit 2B may suggest, however, that the GIS was still present in eastern Kane Basin and delivered material derived from the gneiss basement to the core site. The volcanic clastics on Ellesmere Island may have also tributed to Fe counts in our geochemical record, but we con-sider their input marginal given the limited surface of this geological unit compared to the gneiss and crystalline base-ment, which outcrops in much of Inglefield Land and
under-lays Humboldt Glacier (Dawes and Garde, 2004). Further-more, the IIS was a cold-base ice sheet (e.g. Tushingham, 1990; Dyke et al., 2002) and as such likely delivered over-all less sediment from meltwater than the warm-based GIS. The occurrence of IRD in unit 2 may imply that relatively open water conditions occurred during this interval, enabling icebergs to drift in Kane Basin, although this may simply be a consequence of high calving rates as the GIS and IIS re-treat. Reduced sea ice occurrence in Kane Basin during the Early Holocene would be in good agreement with low sea ice concentrations reported nearby in Lancaster Sound (from 10 to 6 cal ka BP, 1R = 290, Vare et al., 2009; from ∼ 10– 7.8 cal ka BP, R = 335, Pienkowski et al., 2012). However, while the decreasing trend of the coarse fraction in unit 2 may
indicate more stable sea ice conditions (or decreasing calv-ing rates) toward the end of the interval, fluctuations in the coarse fractions in our record may also suggest that sea ice conditions were variable. This is in line with both decreas-ing atmospheric temperatures towards the end of the HTM (Lecavalier et al., 2017) and the Knudsen et al. (2008) obser-vations of variable West Greenland Current influence and sea ice conditions between 9.5 and 8.2 cal ka BP in northernmost Baffin Bay.
5.3 8.3 cal ka BP: the opening of Kennedy Channel Unit 3 appears to be primarily iceberg-rafted, with an in-clusion of a finer, water-transported silty subunit (3B). A foraminifera-derived radiocarbon age obtained from subunit 3B (Table 1) suggests sediment remobilisation within this time interval. If we consider unit 3A to have been deposited by the passing over Kane Basin of glacial ice having broken up in Kennedy Channel, then a plausible origin for unit 3B could be the entrainment of sediment from northern Nares Strait associated with the discharge of large amounts of wa-ter as the connection was established. The absence of any molluscs in Kennedy Channel predating 8.1 cal ka BP fur-ther suggests that Kennedy Channel was still blocked until then, although this method can only provide minimum ages for ice sheet retreat (Fig. 8e–g). This proposed age for the opening of Kennedy Channel is only slightly younger than that proposed by Jennings et al. (2011), i.e. ∼ 8.6 cal ka BP (1R = 240, Fig. 7), based on the estimated age of an IRD event in Hall Basin, northern Nares Strait (core HLY03-05GC). Both ages can be reconciled assuming that bottom waters in Hall Basin were probably poorly ventilated be-fore the opening of the strait, inducing a higher reservoir age in the northern sector of Nares Strait. Furthermore, one might consider the possibility that the transitional IRD-rich unit in core HLY03-05GC that is interpreted by Jennings et al. (2011) as representing the opening of Kennedy Channel might in fact represent instabilities in the GIS–IIS prior to – and eventually leading to – the complete opening of the strait. If so, the transition from laminated to bioturbated mud in the Hall Basin sediment record which, according to X-radiography, CT scans, and the age model of core HLY03-05GC, occurred close to 8.5 cal ka BP, ie. ca. 100 years after the deposition of the IRD-rich unit (Jennings et al., 2011), might in fact represent the true opening of Nares Strait (i.e. change from a rather confined Hall Basin to a ventilated envi-ronment under the influence of a strong southward current). Finally, we assume that the collapse of glacial ice in Kennedy Channel was more likely to have been recorded as an IRD-rich interval south of the channel (i.e. Kane Basin) in the di-rection of the presumable southward flow, rather than to the north.
It has recently been demonstrated that the Humboldt Glacier retreated from a previous position of stability ca. 8.3 ± 1.7 ka BP based on surface-exposure dating of an
aban-doned lateral moraine in Washington Land (Reusche et al., 2018). This instability in the Humboldt Glacier may have been linked to the break-up of glacial ice in Kennedy Chan-nel. Furthermore, the onset of decreasing landfast sea ice on the northern coast of Ellesmere Island and northern Green-land after 8.2 cal ka BP (EngGreen-land et al., 2008; Funder et al., 2011) may have been associated with the flushing of ice through Nares Strait after the opening of Kennedy Chan-nel. The local temperature drop recorded in the Agassiz ice core (Lecavalier et al., 2017) and, as suggested by Reusche et al. (2018), in Baffin Bay lacustrine records (Axford et al., 2009) may have been associated with oceanographic and atmospheric reorganisation resulting from the opening of Kennedy Channel, as well as the “8.2 event”. Given the excellent correspondence between the aforementioned evi-dence, we consider subunits 3A and 3B to have been de-posited as the ice saddle in Kennedy Channel broke up. The high carbonate signal in the elemental data (Fig. 6) also sug-gests that the sediments from subunits 3A and 3B originated from northern Nares Strait (Fig. 2) rather than the Humboldt Glacier alone.
The dominant depositional process in subunit 3C is ice-berg rafting based on the abundance of clasts in this inter-val. The elemental composition of subunit 3C suggests that the sedimentary material likely originates from the GIS in eastern Kane Basin (Fig. 2). Investigations into the inter-nal stratigraphy of the GIS and their comparison to north Greenland ice cores have demonstrated that the collapse of the ice saddle in Kennedy Channel triggered the acceleration of glacial fluxes along Nares Strait (MacGregor et al., 2016). The destabilisation of the GIS following the collapse of the ice saddle may have provoked intense calving that led to the deposition of subunit 3C. In this regard, intense calving of the Humboldt Glacier as recently dated by Reusche et al. (2018) at 8.3 ± 1.7 ka BP might explain the observed elemental sig-nature of the top part of unit 3.
However, the Reusche et al. (2018) findings also offer an alternative scenario for the deposition of unit 3. Intense calving of the Humboldt Glacier may have occurred as it retreated in eastern Kane Basin and abandoned a lateral moraine in Washington Land ca. 8.3 ± 1.7 ka BP (Reusche et al., 2018). This alternative scenario alludes to the possi-bility that the opening of Kennedy Channel may rather have occurred ca. 9.0 cal ka BP (unit 1C). The elemental signature of subunit 3A and 3B does not, however, point to an eastern source and rather supports a northern–western origin of these sediments.
5.4 8.3–8.1 cal ka BP: increased iceberg delivery to Kane Basin
The abundance of iceberg-rafted debris has increased con-siderably in unit 4 compared to unit 2. This is possibly the result of the aforementioned acceleration of the GIS and IIS along Nares Strait following the collapse of the ice saddle in
Kennedy Channel (MacGregor et al., 2016), as well as the arrival of icebergs from new sources to Kane Basin situated in northern Nares Strait. The retreating GIS in eastern Kane Basin was likely a primary source of icebergs during this pe-riod. However, the high clay content in our record implies that the GIS was still relatively close to the core site and had not yet fully retreated in eastern Kane Basin, contributing to the high sedimentation rates recorded in this unit (Fig. 8e).
5.5 8.1–7.5 cal ka BP: rapid retreat of the GIS in Kane Basin
The abrupt decrease in clay content and sedimentation rates at 280 cm in our record implies that the ice margin abruptly retreated ca. 8.1 cal ka BP (Fig.6, Fig. 8f). The equal drop in Fe / Ca ratios suggests that it was probably the GIS that retreated rapidly in eastern Kane Basin. This abrupt retreat may have been initiated by the removal of the glacial but-tress in Kennedy Channel (unit 3). The subsequent decrease in the > 125 µm fraction may be associated with the onset of the deceleration of glacial fluxes along Nares Strait, as well as more distant glacial ice in eastern Kane Basin result-ing from the retreat of the GIS. The timresult-ing of the retreat of the GIS in eastern Kane Basin corresponds remarkably well with the aforementioned abandonment of a lateral moraine by the Humboldt Glacier (Reusche et al., 2018). The authors in this recent study warn that two samples may be contam-inated by previous exposure and that the age of abandon-ment of the moraine is likely to be younger than the pro-posed 8.3 ± 1.7 ka BP. Given the uncertainties in our radio-carbon dataset (analytical errors and 1R uncertainties) and in the Reusche et al. (2018) surface-exposure dataset, both our dating of the opening of Kennedy Channel and the retreat of Humboldt Glacier are within the uncertainty range of the dating of the abandonment of the moraine by the Humboldt Glacier. It is thus difficult to distinguish whether this event was linked to the deglaciation of Kennedy Channel at ∼ 8.3 cal ka BP or whether it was delayed until ∼ 8.1 cal ka BP after the cold “8.2 event” that may have brought a short pe-riod of stability to the GIS.
5.6 7.5–0 cal ka BP: deglaciation of Washington Land The low Fe / Ca ratios at the beginning of this interval are likely related to the erosion and delivery of material from Washington Land and a decrease in the delivery of crys-talline material by the GIS (Fig. 6). The progressive increase in Fe / Ca between 7.5 and 4.1 cal ka BP can be linked to the deglaciation of Washington Land. The oldest molluscs found on the southern coast of Washington Land are dated between 7.8 and 7.5 cal ka BP, while specimens found in morainic deposits imply that the extent of the GIS reached a minimum between 4 and 0.7 cal ka BP (Fig. 7, Bennike, 2002). The decrease in the coarser fractions in our core af-ter ca. 7.5 cal ka BP may be the result of reduced marine
termini of the GIS and hence less calving as the Green-land coast became deglaciated (Fig. 8g, Bennike, 2002). Increasing silt and Ti / K in our core suggest winnowing by stronger bottom water currents. We propose that as the glacio-isostatic rebound lifted the continental crust in Nares Strait, the seabed was progressively brought closer to the stronger subsurface currents. The isostatic rebound in Kane Basin has been estimated to be between 80 and 120 m (Eng-land, 1999, and references therein), which would have had considerable consequences on bottom water velocities. In-terestingly, increased sedimentation rates in Kane Basin be-tween ∼ 4.5 and 2.8 cal ka BP (Fig. 3) coincide with a period of atmospheric warming recorded in the Agassiz ice core (Lecavalier et al., 2017). These higher sedimentation rates may have been associated with increased delivery of sedi-ment by meltwater from the GIS and the residual ice caps on Ellesmere Island during a warmer period. The increase in the contribution of the coarse fraction in core AMD14-Kane2B over the last 1.9 kyr is suggestive of minimal seasonal sea ice and/or higher calving rates over the last 2 millennia in Kane Basin. This broadly coincides with low absolute di-atom abundances in northernmost Baffin Bay, attesting to poor productivity rates after 2.0 cal ka BP; 1R = 0 (Knud-sen et al., 2008). The “bridge dipole” between Kane Basin and northernmost Baffin Bay entails the following: when sea ice conditions in Kane Basin are strong, surface condi-tions to the south of Smith Sound are largely open with the NOW Polynya being productive and vice versa (Barber et al., 2001). This inverse relationship between sea ice condi-tions in Kane Basin and northernmost Baffin Bay has prob-ably been true for at least the past ca. 2 kyr. Recent insta-bilities in the ice arch in Kane Basin that have led to in-creased sea ice export towards northernmost Baffin Bay have been observed by satellite imagery and hence are only doc-umented for the past few decades. Together with the Knud-sen et al. (2008) study in northern Baffin Bay, our results suggest that these instabilities may have begun as early as ca. 2 cal ka BP. Late Holocene decreases in sea ice occur-rence, indicative of milder conditions, were also documented in other sectors of the CAA such as in Barrow Strait between 2.0 and 1.5 cal ka BP (Pienkowski et al., 2012) or in the adja-cent Lancaster Sound between 1.2 and 0.8 cal ka BP (Vare et al., 2009).
6 Conclusion
Our investigation of core AMD14-Kane2b has provided, for the first time, a paleo-environmental reconstruction in Kane Basin over the last ca. 9.0 kyr. The confrontation of our dataset with both land-based (England, 1999; Bennike, 2002, Reusche et al., 2018) and marine (Jennings et al., 2011) ev-idence offers several alternative paleo-environmental inter-pretations for our record. Of particular interest is the de-termination of which of the two IRD-rich units (unit 1c
∼9.0 cal ka BP or unit 3 ∼ 8.3 cal ka BP) in core AMD14-Kane2b might represent the opening of Kennedy Channel. We consider the evidence to be in favour of a later collapse of glacial ice in Kennedy Channel ca. 8.3 cal ka BP that may have been linked to instabilities in the Humboldt Glacier ca. 8.3–8.1 cal ka BP (Reusche et al., 2018). Our findings concerning the successive paleo-environments in this central sector of Nares Strait following ice sheet retreat can be sum-marised as follows.
While evolving from a short-lived ice-proximal deposi-tional environment at ∼ 9.0 cal ka BP to a rather secluded and narrow bay as the ice sheets retreated, compelling evi-dence indicates that Kane Basin was not connected to Hall Basin until the collapse of the GIS–IIS saddle in Kennedy Channel at ∼ 8.3 cal ka BP. The collapse of the glacial but-tress in Kennedy Channel may have triggered the acceler-ation of glacial fluxes toward Nares Strait, increasing calv-ing and iceberg-rafted debris in Kane Basin between 8.3 and 7.5 cal ka BP. Instabilities in the GIS eventually resulted in the rapid retreat of glacial ice from eastern Kane Basin at 8.1 cal ka BP. As the basin underwent shoaling induced by the glacio-isostatic rebound, the retreat of the GIS in Wash-ington Land gradually reduced inputs of carbonate materiel to Kane Basin. A possible deterioration in sea ice conditions and/or increased iceberg release appear to have taken place over the last ca. 2 kyr and correspond with lower sea ice oc-currence in other sectors of the CAA.
This archive provides a new viewpoint that has enabled us to propose a continuous timeline of the events related to the deglaciation of Kane Basin, which until now relied entirely on land-based studies. Our study suggests that the “bridge dipole” presented in Barber et al. (2001), in which warmer (colder) years exhibit more (less) sea ice in Smith Sound and less (more) ice in Nares Strait, may be extrap-olated over the last 2 millennia. Future investigations into the Holocene variability of sea ice conditions in Kane Basin may provide a more comprehensive view on its controlling effect on the NOW Polynya. High productivity rates in the NOW Polynya, however, are also fuelled by the throughflow of nutrient-rich Pacific water via Nares Strait, and further investigation into how oceanographic circulation responded to postglacial changes in Nares Strait will provide more in-sight into the Holocene evolution of this highly productive area of the Arctic. Other than emphasising the need for fur-ther research into local reservoir age corrections, our study is inclined to contribute to future work on the export of low-salinity Arctic water and Holocene variations of deep water formation (Hoogakker et al., 2014; Moffa-Sanchez and Hall, 2017).
Data availability. The data presented in this paper are available upon request (eleanor.georgiadis@u-bordeaux.fr).
Supplement. The supplement related to this article is available online at: https://doi.org/10.5194/cp-14-1991-2018-supplement.
Author contributions. EG, JG, and GM designed the research and carried out most of the analyses. GSO provided CT scan im-agery. SS performed 210Pb measurements. EG, JG, and GM pre-pared the paper with contributions from all authors. EG, JG, GM, PM, PL, SS, and GSO contributed to the interpretation of the re-sults.
Competing interests. The authors declare that they have no con-flict of interest.
Acknowledgements. Eleanor Georgiadis’ studentship is funded by both the Initiative d’Excellence (IdEx) programme of the University of Bordeaux and the Natural Science and Engineering Research Council of Canada (NSERC). We would like to thank Anne Jennings, Sofia Ribeiro, Audrey Limoges, and Karen Luise Knudsen for constructive conversations on the history of the North Water Polynya and Benoit Lecavalier for having shared with us the much appreciated Agassiz ice core temperature record. We also extend our gratitude to Sebastien Zaragosi and Bernard Martin, who prepared and helped interpret thin sections, and Isabelle Billy, Pascal Lebleu, Olivier Ther, and Caroline Guilmette for analytical support. This work is supported by the Fondation Total, the French Agence Nationale de la Recherche (GreenEdge project), the Network of Centres of Excellence ArcticNet, and the European Research Council (StG IceProxy). Finally, we wish to thank the CCGS Amundsen captain, officers, and crew for their support during the 2014 ArcticNet cruise.
Edited by: Ed Brook
Reviewed by: two anonymous referees
References
Andrews, J., T. and Ives, J. D.: “Cockburn” Nomenclature and the Late Quaternary History of the Eastern Canadian Arctic, Arctic Alpine Res., 10, 617–633, 1978.
Axford, Y., Briner, J. P., Miller, G. H., and Francis, D. R.: Paleoeco-logical evidence for abrupt cold reversals during peak Holocene warmth on Baffin Island, Arctic Canada, Quaternary Sci. Rev., 71, 142-149, 2009.
Bahr, A., Jimenez-Espejo, F. J., Kolasinac, N., Grunert, P., Hernández-Molina, F. J., Rohl, U., Voelker, A. H. L., Escutia, C., Stow, D. A. V., Hodell, D., and Alvarez-Zarikian, C. A.: Deciphering bottom current velocity and paleoclimate signals from contourite deposits in the Gulf of Cádiz during the last 140 kyr: An inorganic geochem-ical approach, Geochem. Geophy. Geosys., 15, 3145–3160, https://doi.org/10.1002/2014GC005356, 2014.
Bailey, W. B.: Oceanographic Features of the Canadian Archipelago, J. of the Fish. Res. Board Can., 14, 731–769, 1957.