Science Arts & Métiers (SAM)
is an open access repository that collects the work of Arts et Métiers Institute of
Technology researchers and makes it freely available over the web where possible.
This is an author-deposited version published in:
https://sam.ensam.eu
Handle ID: .
http://hdl.handle.net/10985/11378
To cite this version :
Samuel BIGOT, Jean-Philippe PERNOT, Gianluca D'URSO, Cristina MERLA, Jérémy
PEYROUTET, Anthony SURLERAUX - Estimating the exchanged energy distribution in
microEDM In: 9th International Conference on MicroManufacturing (ICOMM’14), Chine, 2014
-Proceedings of the 9th International Conference on MicroManufacturing - 2014
Any correspondence concerning this service should be sent to the repository
Administrator :
[email protected]
Estimating the exchanged energy distribution in micro-EDM
Samuel Bigot
1, Jean-Philippe Pernot
2,
Gianluca D’Urso
3, Cristina Merla
3, Jérémy Peyroutet
2, Anthony Surleraux
1,2 1Cardiff School of Engineering, Cardiff University, Cardiff, CF24 3AA, UK2 Arts et Métiers ParisTech, LSIS – UMR CNRS 7296, Aix-en-Provence, FR 3Dipartimento di Ingegneria, Università degli Studi di Bergamo, 24044 Dalmine (BG), IT
Abstract
This paper presents a new approach for the recording of the total quantity of energy exchanged during the micro Electro Discharge Machining (EDM) process. In particular, this approach allows for the estimation of the percentage of energy absorbed by the two electrodes (tool and workpiece) using a combination of theoretical models and experimental results, thanks to an advanced discharges measuring approach. The validity of several theoretical crater models was then assessed. Using this approach, the process was analysed for two electrode shapes and two sets of machining parameters. The preliminary results appears to fit those presented in the literature.
Keywords: micro-EDM, die sinking, energy measurement. 1. Introduction
Micro-EDM (Electro Discharge Machining) can be considered as one of the most promising non-conventional micro-machining techniques due to its ability to machine high aspect ratio micro holes as well as complex 3D shapes in any conductive material.
The technology behind EDM consist in two electrodes (also known as the tool and the workpiece) that are immerged in a dielectric fluid and submitted to an electrical current. As the distance between the electrodes diminishes, the voltage between them increases until the dielectric breaks down and a discharge takes place. The distance corresponding to that breakdown voltage is known as the machining or sparking gap.
The discharge consists of a plasma channel that forms between the two electrodes and transfers thermal energy to them. The heating of the metal leads to its vaporization and melting. After the discharge has taken place, a single or multiple craters are left on the electrodes’ surfaces. Due to the directional nature of the process (determined by the current polarity) the crater dimensions on the tool and the workpiece differ.
The formation of these craters is due to the collapse of the plasma channel after the spark that creates a depression. As such part of the melted material is extracted and evacuated by the dielectric and accounts for the presence of debris. However a non-negligible part of the melted material remains.
The process is influenced by numerous parameters such as the electrical parameters (voltage, current, frequency…), the dielectric’s characteristics or the material properties that will determine the machining performance in terms of surface roughness or material
removal rate.
A lot of attempts have been made in order to model the micro-EDM process. It is possible to affirm that the main elements considered in the majority of the models are the cathode, the anode and the plasma channel between them. An assumption regarding the energy distribution considers that part of the energy goes to the tool and workpiece while the rest is lost in the dielectric. Despite this assumption, a lack of information about the micro-EDM effective amount of energy transferred to the workpiece emerges from the literature. Several papers deal with the EDM energy distribution, but not much work has been performed referring to the micro scale process. Shao et al. determined the pulse energy distribution ratio in the micro-EDM erosion process. In other words, the distribution of the total energy of a pulse into each electrode and the inter-electrode gap was determined, based on the dimensions of the craters left on the tool and on the workpiece by the electric discharges. It was demonstrated that the average pulse energy distribution is 9.4% to the anode and 3.6% to the cathode [12]. Kunieda et al., based on an experimental campaign, estimated the percentage of material which is vaporized or melted during the machining process. This percentage was demonstrated to be different for the anode and for the cathode.
In [13] Obaciu et al. made a comparison between the machining of so called “common” materials, in other words homogeneous materials like steel, and heterogeneous materials like polycrystalline diamond. Regarding the energy measurement, it was possible to demonstrate that the energy density increases with the pulse on time although it is not possible to find the same trend for both materials. In [14] the energy distribution was determined from the temperature state of the material. A certain number of assumptions related to the types of thermal transfers were made. Relations
between process parameters (polarity, discharge duration, dielectric fluid and peak current) and energy distribution were investigated.
A few attempts have been made in order to measure the number of spark discharges and the amount of energy exchanged during the micro-EDM machining process [15-20]. For example, in [14] Bissacco et al., while investigating the micro-EDM milling process, estimated the amount of discharges in order to carry out a real time wear compensation method based on the discharge population characterization. Similarly, in [16] Mahardika et al. estimated the number of discharges occurring during the process and presented an innovative model for the estimation of the total energy exchanged during the machining. Regarding the amount of energy exchanged during the process, in [19, 20] the authors made an estimation of the amount of energy effectively absorbed by the electrodes. In [20] it is demonstrated that during the EDM process the amount of energy effectively absorbed by the workpiece is between 6.5 and 17.7% depending on the process parameters. A lack of information related to the exact amount of energy absorbed by the electrodes emerges from the literature.
The aim of this paper is to implement a new procedure and experimental set up aimed at assessing the total amount of energy occurring during micro-EDM and its percentage absorbed by the workpiece, by the tool and lost in the dielectric.
For this purpose the next section gives a review of existing theoretical EDM models with the aim of assessing their ability to predict volume removal in the scope of micro-scale EDM. The third section explains how sparks information were acquired and analysed in order to estimate the total amount of energy produced during the EDM experiments. Finally, the fourth section describes an experimental campaign which was performed to demonstrate how the energy distribution between workpiece, tool and dielectric could be estimated.
2. Theoretical EDM models
The majority of the models deals with a thermal approach to the material removal mechanism of the EDM process: these are based on partial differential equations in cylindrical coordinates describing the heat transfer between tool and workpiece. The thermal phenomenon is considered by the majority of the authors as the main one having an influence on the material removal mechanism: based on this assumption, the energy is transferred from the tool to the workpiece and it is partially dissipated into the dielectric fluid or into the plasma channel itself.
In [3-4] Di Bitonto et al. presented a cathode and an anode erosion model. The cathode model is based on the concept of fraction of energy effectively converted into removed material. In this case, the model was validated using the data available at the AGIE Company, which was collected in order to optimize the ton parameter. It is
demonstrated that the model tends to overestimate the removed volume of the crater and the removal rates as well. In [5, 6] the authors have modelled the EDM process considering two semi-infinite bodies, representing the workpiece and the electrode, separated by a certain gap crossed by a heat disc representing the plasma heating
phenomenon. The process is modelled by a partial differential equation with some boundary assumptions related to the workpiece insulation. It is demonstrated that the diameter of the plasma channel evolves during the process and in [5] it was demonstrated that the temperature during the machining time remains constant, equal to the boiling temperature of the electrode.
In several papers the authors have adopted a thermal approach to describe the micro-EDM erosion process and to predict the final geometry of the crater. Based on this approach a fixed amount of electrical energy is converted into thermal energy resulting in the melting and/or vaporizing of the material composing the workpiece. In [7] the thermal model is used to numerically calculate the profile of the craters left by the sparks. The heat conduction problem, based on a partial differential equation is here considered suitable for the modelling of the EDM process. In [8] the authors developed a numerical model for predicting the temperature distribution and the residual stresses resulting from a single spark discharges EDM process. It is here demonstrated that the thermal residual stresses left by the discharges on the surface of the workpiece material are of compression type. Also in this case, starting from the heat transfer equation, it was possible to obtain the temperature profiles for stainless steel AISI 316L.
In [9] the authors considered the effect of the residual stresses, suggesting that one of the most important factors in EDM machining is the electrostatic force occurring between the tool and the workpiece. It was demonstrated that the stresses caused by the electrical field are independent from the spark dimensions and durations. In [10] the authors based the analysis on the heat transfer equation which was solved numerically. Parametric studies were also carried out in order to investigate the influence of the process parameters on the material removal rate and crater depth. In particular, the effect of current, duty cycle, discharge duration and voltage was investigated. In [11] a finite elements model aimed at describing and predicting the temperature fields generated by a multiple discharges process within the workpiece was developed. The solution of the thermal problem led to the temperature distribution inside the workpiece from which it was possible to estimate the shape of the craters. In particular, the workpiece was discretized by hexahedral elements and for each element appropriate boundaries were defined. Once the temperature distribution was found, the criterion for the estimation of the crater volume was set: every part of the workpiece which reached a temperature higher than the equivalent temperature is supposed to be removed from the workpiece.
The proposed objective here is to determine whether or not those models developed for EDM apply on a micro-scale considering the proportion of energy that is actually delivered to the electrodes. Most of the models include a coefficient in their formulation of the heat flux to take into account the fact that energy is lost during the process notable through the dielectric fluid. However the used values seem high (40-50%) when considering the case of micro-EDM (<10%).
After the collection of all the physical models, a selection of the thermal ones was carried out. In particular two main models were selected (Di Bitonto et al. [3] and Beck et al. [20, 21) based on the heat transfer equation formulation. The initial heat transfer equation is reported in Eq. 1:
where T is the temperature (in kelvin), t the time (in seconds) and r the radial dimension of the crater (in meters).
The studied models provide a temperature distribution in the workpiece under different assumptions mainly concerning the heat flux that is the plasma channel forming between both electrodes. In order to assess the validity of said models on a micro-scale, a comparison between predicted and experimental crater shapes was done. As an example, Di Bitonto’s model [3] is summarised in Eq. 2:
T(r,t) = T0 + qr/Kt * erfc(r/(2√αt)) (2)
A very similar formulation of the thermal distributions was taken into account for Snoey’s and Beck’s models. Based on these thermal equations, it was possible to plot the thermal distribution into the workpiece allowing the collection of information about the temperatures reached during the machining.
Instead of using the coefficients provided by the various authors in their models, energy distributions values for micro-EDM available in Shao et al. were used. A value for ton was selected in accordance with
experimental data. All chosen model input values are presented in Table 1.
While the disparity between both models in terms of distribution shape and amplitude isn’t surprising due to the very different assumptions that were made in each case, it is noticeable that the maximum temperature reached in the material doesn’t attain the melting temperature, even less so the boiling one.
Good results were obtained previously in the case of macro-scale EDM for the prediction of crater dimensions by these models. In the case of micro-EDM, however, the models’ validity can be put into question here. A proposed solution to adapt said models to the micro-EDM context would be to apply a scaling coefficient to the temperature distribution. However, it is unlikely that a single value for that coefficient would be relevant to all materials and a wide-range of machining parameters.
Following this observation, theoretical crater models will not be used for the analysis of the following experimental campaign. Instead relations based on the specific heat of the involved materials will be used. Table 1
Input and initial assumptions of the thermal models
Input Description Value
Kt Thermal conductivity [J/s m K] 220 ρ Material density [Kg/m3] 2700 Cp Specific heat [J/KgK] 910 Ti Initial Temperature [K] 293 Tb Boiling Temperature[K] 2792 α Thermal diffusivity [m2/s] = Kt/ρCp 8.95 10-5
R0 [4] Radius of the insulated surface of the workpiece [m] = 50R
c 0.0041
Rc [4] Heat source radius at the cathode surface [m] = 2040*I0.43*t
on0.44 8.23 10 -5
Ew Percentage of energy absorbed by the tool [%] 3.6
ton Spark duration [µs] 5 Depth (m) Radius (m) T (K) 1572 293 1,6E-4 -1,6E-4 -1,6E-4 0E+0
Fig. 1. Temperature distribution in Beck's model
Depth (m) Radius (m) T (K) 655 353 1,6E-4 -1,6E-4 -1,6E-4 0E+0
Fig. 2. Temperature distribution in Di Bitonto’s model 3. Sparks information acquisition
3.1. Data collection automation
The gap voltage and current waveform were acquired during the experimental campaign using a Tektronix digital oscilloscope. In particular, the data was collected exploiting the oscilloscope interface on a Microsoft Windows® platform, which allowed the use of a computational software (Matlab®) to exploit the data.
A software toolbox was developed in order to have a semi-automatic recording of EDM single discharges. It automatically carried out the setting of the oscilloscope according to the machine parameters and launched a series of data acquisitions, which during each EDM test allowed for the recording of limited patches of discharges at regular times, as described below.
A VISA (Virtual Instrument Standard Architecture) object in Matlab® associated with the GPIB (General-Purpose Interface Bus) controller supported the communication with the oscilloscope. The input buffer size limited the amount and precision of discharges that could be recorded in each patch. It had to be large enough to contain enough discharge records while at the same time not too large in order to have a short enough data transfer time, allowing for enough patches of recording to be spread evenly throughout the erosion process. It was set to a value equal to 12,000,000 bytes, which was considered a good compromise between speed and quantity of information exchange. It allowed for the recording of 0.5 seconds of discharges every 20 seconds.
Each 0.5 seconds patch contained 10,000,000 points, which gave sufficient precision on the voltage and current waveforms recorded by the oscilloscope. Matlab® was then used to read and transfer the binblock data, which was saved into a “.mat” format file for further investigation.
3.2. Data analysis
Trying to analyse the ten millions points at the same time requested a segment of memory from the operating system (32-bits) that was larger than what was available. For this
reason, the matrix was divided into five sub-parts. The process limit of the operating system was 3GB.
A falling edge trigger was set in order to identify every single discharge occurring in each recorded patch. It was then possible to calculate the following parameters: breakdown voltage (Ugap); peak current (Ipeak); discharge
duration (Uw); spark width (Iw); time before spark (tb);
amount of energy (E).
By multiplying the breakdown voltage by the peak current and then integrating it during the spark duration (Iw), it was possible to estimate the amount of energy
produced by each spark. 4. Experimental campaign
The experimental campaign was executed on a Sarix SX200 micro-EDM machine with a tungsten carbide tool electrode. In particular, two different tool shapes were used, a triangular and a rectangular based parallelepipeds as described in Figure 3. Those shapes were realized by means of a wire-EDM machine (AGIE AgieCut Vertex) using a Ø100 μm wire. In Table 3 the physical and thermal properties of the material composing the tool are reported.
The triangle and square features were used individually in a die sinking machining process on an ultrafine grain aluminium workpiece, the material properties are reported in Table 4.
The die sinking process was performed on the z axis from the top surface of the workpiece down to a depth of 150 μm.
Fig. 3. Tungsten carbide tools Table 2
Dimensions of the tool features
Feature Base [μm] Height [μm]
Triangle 100 200
Rectangular 100 200
Table 3
Tungsten carbide physical and thermal data
Property Value
Melting temperature [K] 3096
Latent melting heat [J/Kg] 445000
Vaporization temperature [K] 6273
Latent heat of vaporization mol [KJ/mol] 824000
a.m.u. [Kg/mol] 0.196
Latent heat of vaporization [J/Kg] 4204082
Specific heat [J/KgK] 238
Density [Kg/m3] 15800
4.1. Process parameters
The tests were executed with two different parameters combinations, a first characterized by a lower energy index (Energy: 114; Voltage 60V; Peak Current: 20) and a second one characterized by a higher removal rate due to a higher energy index (Energy: 200; Voltage 90V; Peak Current: 50). Some other parameters were kept fixed during the machining: frequency (100 kHz), gain (80), gap (65), regulation (02-01), polarity (-), width (5 μs).
For each parameters combination, two repetitions were executed. The first one was aimed at assessing the total number of sparks occurring between the tool and the workpiece during the entire machining. The second one was executed in order to collect patches of discharges (current and voltage waveforms), as described in section 2, which can then be used to estimate the total amount of energy involved during the machining.
For the selection of the process parameters a hierarchical approach was adopted. It is well known from the literature that the machine parameters governing the erosion process are energy, peak current, voltage, frequency, width, gain, gap, polarity and regulation. In particular, for the voltage parameter, the maximum and minimum values are influenced by the energy level (represented by an index value on the machine). Similarly, the peak current parameter boundaries are set by the voltage and for the same reason the energy parameter itself is supposed to have an influence on the peak current parameter boundaries. Regarding the frequency, it is influenced by the peak current, and for the same reasons it is also influenced by the voltage and by the energy level, as well. Finally, the pulse on time is influenced by the energy level and by the frequency (and for the same reasons it is influenced by the peak current and the voltage as well). Based on these assumptions, three parameters (energy, current, voltage) were varied on two levels. The experimental campaign resulted in a total amount of eight tests.
Table 4
Aluminium physical and thermal data
Property Value
Melting temperature [K] 933
Latent melting heat [J/Kg] 321 000
Vaporization temperature [K] 2792
Latent heat of vaporization [J/Kg] 10 530 000
Specific heat [J/Kg K] 910
Density [Kg/m3] 2700
4.2. Experimental setup
After the selection of the process parameters the experimental set up was implemented. A 3R® clamping system was used to hold the workpiece in order to minimize the positioning misalignment. This system allows for a proper placement of the workpiece thank to a screw based system which can compensate the misalignment in two directions (Figure 4).
Fig. 4. Clamping system
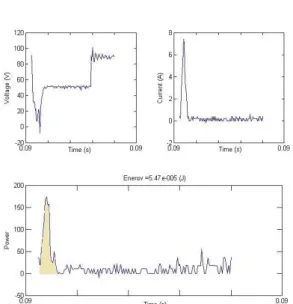
Fig.4. Current / voltage waveforms and energy calculation With this device, the alignment was performed on a “trial and error procedure” using a standard cylindrical micro-EDM tool (Ø290 µm). Since micro-EDM is an electrically based technology, it is possible to exploit the short circuit occurring when the tool and the workpiece are in contact to measure the misalignment.
The 150 μm deep die sinking process was then performed while recording peak current and voltage data as explained in Section 2. In Fig. a typical distribution of current and voltage is reported together with the power trend as a function of the time is reported.
4.3. Estimation of the amount of energy
After the execution of the experimental campaign it was possible to calculate the total amount of energy that occurred during the recorded patches of discharges.
As the total number of sparks occurring between tool and workpiece was also recorded, and assuming that nearly the same number of sparks occurred in the two repetitions mentioned in section 4.1, it was then possible to estimate the total amount of energy that occurred during the entire die sinking process. But this energy is distributed between the tool, the workpiece and the dielectric.
In order to evaluate the actual distribution of energy, it was decided to estimate the energy effectively lost into the tool and into the workpiece from the volume of material actually removed from the tool and from the workpiece. These volumes were measured using an optical coordinate measuring system, namely the Mitutoyo Quickvision Pro QVC20.
Fig. 5. Tungsten carbide tools after erosion
Regarding the tool, the volume removed was simply estimated by measuring the dimensions of the features (triangle and square features) before and after the machining. Figure 5 shows a profile of the triangular and rectangular tools after erosion.
For the workpiece, it was necessary to execute a transversal cut for each feature in order to collect reliable information about the depth of the features.
Based on the information related to the total volumes removed, it is possible to calculate the amount of energy necessary to remove that amount of material using the following theory.
In this experiment, the estimation of the energy (heat, Q) is based on the definition of specific heat, as reported in Eq. 3 and in Eq. 4:
Q=c∙m∙T (3)
Qlat=λ∙m (4)
where c is the specific heat, m is the mass of the material removed from the workpiece/electrode, λ is the latent heat of melting or evaporation and T is the temperature variation
between the starting and the final state. Starting from the volume (V) of the material removed from the workpiece/tool, it was possible to calculate the mass (m) of the material removed (knowing the workpiece material density), as reported in Eq. 5:
m=V∙ρ (5)
where ρ represents the density of the material expressed in Kg/m3.
Since the temperatures reached during the process are considerably higher than the melting temperature (see section 2), two main phenomena are supposed to take place during the material removal process, both the melting and the vaporization of the material. The following equations simplify the formulation of the problem: Eq. 6 relates to the heat necessary to increase the temperature of the material from
the room temperature to the melting temperature (Ei), Eq.
7 expresses the formula of the latent heat necessary to completely melt the material (El,fus), Eq. 8 describes the
heat necessary to increase the temperature of the workpiece from the melting to the vaporizing temperature (Ef) and Eq. 9 describes the latent heat of vaporization
(El,vap).
Ei=c*m*(Tamb-Tfus) (6)
E(l,fus)= λfus∙m (7)
Ef=c*m*(Tfus-Tevap) (8)
E(l,vap)= λevap∙m (9)
During the erosion process the material is not completely vaporized, because a part of the material is only melted and re-solidified into little particles (called debris) removed by the dielectric flushing. Related to the percentage of the material effectively melted and/or vaporized, Kunieda et al. [21], based on an experimental campaign, estimated a percentage of the vaporized material (represented by the index g) which was demonstrated to be different for the anode and for the cathode. In particular, for the anode g is supposed to vary between 0.57% and 4.78% while for the cathode it varies between 0.06% and 0.48%.
Moreover, a percentage of the melted material is re-solidified on the workpiece and for this reason is not properly removed from the workpiece by the dielectric flushing. This phenomenon has an effect on the volume characteristics of the crater and on the energy amount.
The melted material in fact, can be re-solidified on the workpiece surface because of the temperature decrease caused by the dielectric flushing.
For this reason this material needs to be re-melted and eventually to be re-vaporized in order to be removed by the following sparks. This aspect was then taken into account for the energy estimation procedure. Let r be the percentage of the melted material which is supposed to be re-solidified on the workpiece. For this reason, if the r parameter is equal to 1 all the melted material is considered to be re-solidified on the workpiece. On the contrary, for r = 0 the material is considered to be completely melted and removed from the workpiece surface.
The total amount of energy required to remove the material from the workpiece can be summarized as follows:
Etot=E1+El,fus+Ef+El,vap (10)
Table 6 reports the amounts of energy for the workpiece material removal.
Table 5
Estimation of the energy amount (tool/anode)
Property Triangular feature Rectangular feature
Average E per spark
[μJ] 5.40 47.7
Estimated total E [J] 2.57 8.66
Tool’s volume removed
[m3] 1.45 10-11 7.59 10-11
E to remove the volume [J]: min (0.57%) / max (4.7%)
0.261/
0.309 1.36/ 1.61 Percentage going to
the tool: min/max 10.1% 12.0% 15,7% 18.6% Table 6
Estimation of the energy amount (workpiece/cathode) Property feature Triangular feature Rectangular Average E per spark
[μJ] 5.40 47.7
Estimated total E [J] 2.57 8.66 Workpiece’s volume
removed [m3] 1.22 10-11 5.79 10-11
E to remove the volume [J]: min (0.06%) / max (0.48%)
0.0299/
0.0316 0.142/ 0.150 Percentage going to
the workpiece: min/max 1.16% 1.20% 1.63% 1.73%
As an example, the calculation for the material removed from the tool (triangular shape) is reported as follows. It is possible to assume that the material can be both melted and vaporized [22]. As seen before, the percentage of the material melted and vaporized is included between 0.57% and 4.78%. For the calculation it is assumed that the percentage of the vaporized material is equal to 0.57% (the lower boundary). For this reason the total volume of the material removed can be divided in two different contributions, the material effectively vaporized and the material only melted:
Vvap = Vtot * g = 8.27*10-14 m3 (11)
And for the volume only melted the equation is the following:
Vmel = Vtot * (1-g) = 1.44 * 10-11m3 (12)
Knowing the two amounts of volume it is possible to estimate the corresponding mass:
mvap = Vvap*ρ = 2.27 * 10-7 Kg (13)
Based on these calculations the four amount of energy involved during the process are reported below:
Ei = 0.153 J (15)
E(l,fus) = 0.102 J (16)
Ef = 0.001 J (17)
E(l,vap) = 0.005 J (18)
The total amount of energy necessary to remove the material from the triangular feature with the “gentler parameters combination is reported in Eq. 19:
Etot = Ei + E(l,fus) + Ef + E(l,vap) = 0.261 J (19)
Table 7
Summary of energy repartition
Energy repartition (in %) Triangular
feature Rectangular feature
Tool (anode) 11.09 17.15
Workpiece
(cathode) 1.19 1.69
Dielectric 87.72 81.16
In [12] Shao et al. suggest that the amount of energy effectively absorbed by the tool and by the workpiece is equal to respectively 9.4% and 3.6% of the total amount of energy involved during the process, with a standard deviation of respectively 1.8 and 1.1%. The present experimentation is consistent with those results.
5. Conclusions and future works
In this paper, a method has been developed for the efficient recording of micro-EDM pulse discharges and has been used in the determination of energy repartition between tool, workpiece and dielectric. Experimental results are in accordance with previous results available in the literature.
The validation of the presented acquisition method will enable the use of information related to energy repartition in the simulation of the micro-EDM process being developed by the author [23].
Acknowledgements
The reported research was partly funded by the Engineering and Physical Sciences Research Council (EPSRC) under the grant EP/J004901/1
References
[1] Y. H. Jeong, B. K. Min, “Geometry prediction of EDM-drilled holes and tool electrodes shapes of micro-EDM process using simulation”, Int. J. of Machine Tools & Manufacture 47 (2007) 1817-1826
[2] S. Das, M. Klotz, F. Klocke, “EDM simulation: finite
element-based calculation of deformation, microstructure and residual stresses”, Journal of Material processing technology, 2003
[3] D. D. Dibitonto, P. T. Eubank, M. R. Patel, M. A. Barrufet, “Theoretical models of the electrical discharge machining process. I. A simple cathode erosion model”, Journal of Applied Physics, 66 (1989), pp. 4095–4103
[4] D. D. Dibitonto, P. T. Eubank, M. R. Patel, M. A. Barrufet, R. Mukund, “Theoretical models of the electrical discharge machining process. II. The anode erosion model”, Journal of Applied Physics, 66 (1989), pp. 4095–4103
[5] P. C. Pandey, S. T. Jilani, “Plasma channel growth and the re-solidified layer in EDM”, Precision Engineering, 1986, vol 8 n2.
[6] S. T. Jilani, P. C. Pandey, “Analysis and modeling of EDM parameters”, Precision Engineering, 1982
[7] F. S. Van Dijck, W. L. Dutrè, “Heat conduction model for the calculation of the volume of molten metal in electric discharges”, Appl. Phys. Vol7, 1974
[8] N. B. Salah, F. Ghanem, K. B. Atig, “Thermal and mechanical numerical modeling of electric discharge machining process”, 2008
[9] A. Singh, A. Ghosh, “A thermo electric model of material removal during electric discharge machining”, 1999, Int. Journal of Machine Tools & Manufacture
[10] S. N. Joshi, S. S. Pande, “Thermo-physical modeling of die-sinking EDM process”, Journal of manufacturing processes, 2010
[11] B. Izquierdo, J.A. Sanchez, S. Plaza, I. Pombo, N. Ortega, “A numerical model of the EDM process considering the effect of multiple discharges”, International Journal of Machine Tools & Manufacture 49 (2009 )220–229
[12] B. Shao, K. P. Rajurkar, “Micro-EDM Pulse Energy Distribution Ratio Determination”, ICOMM 2013 No.20, Proceedings of the 8th International Conference on MicroManufacturing University of Victoria, Victoria, BC, Canada, March 25-28, 2013
[13] Energy consumptions evaluation at electro discharge machining of polycrystalline diamond, G. Obaciu, C. Pisarciuc, F. Klocke, M. Klotz, Nonconventional Technologies Review – no. 3/2010
[14] A. Okada, Y. Uno, I. Okajima, Energy Distrihution in Electrical Discharge Machining with Graphite Electrode, Memoirs of the Faculty of Engineering, Okayama University, Vol. 34, No. 1,2, pp.19-26, March 2000
[15] G. Bissacco, H.N. Hansen, G. Tristo, J. Valentincic, “Feasibility of wear compensation in micro EDM milling based on discharge counting and discharge population characterization”, CIRP Annals - Manufacturing Technology 60 (2011) 231–234
[16] M. Mahardika, K. Mitsui, “A new method for monitoring micro-electric discharge machining processes”, International Journal of Machine Tools & Manufacture 48 (2008) 446–458 [17] E. Aligiri, S.H. Yeo, P.C. Tan, “A new tool wear compensation method based on real-time estimation of material removal volume in micro-EDM”, Journal of Materials Processing Technology 210 (2010) 2292–2303
[18] C. Cogun, M. Savsar, “Statistical modelling of properties of discharge pulses in electric discharge machining”, Int. J. Math. Tools Manufact. Vol. 30, No. 3, pp.467-474, 1990 [19] H. Singh, “Experimental study of distribution of energy during EDM process for utilization in thermal models”, International Journal of Heat and Mass Transfer 55 (2012) 5053–5064
[20] H. Singh, D.K. Shukla, “Optimizing electric discharge machining parameters for tungsten-carbide utilizing thermo-mathematical modelling”, International Journal of Thermal Sciences 59 (2012) 161e175
[21] M. Zahiruddin, M. Kunieda, “Energy distribution ratio into micro-EDM electrodes”, 2010, Journal of Advanced Manufacturing Design, Systems and Manufacturing [22] T. Masuzawa, State of the Art of Micromachining, CIRP Annals - Manufacturing Technology, Volume 49, Issue 2, 2000, Pages 473–488
[23] S. Bigot, J-P. Pernot, A. Elkaseer, A. Surleraux, Micro-EDM numerical simulation and experimental validation, Proceedings of the 10th International
Conference on Multi-Material Micro Manufacture, 4M 2013, San Sebastian, Spain.