Publisher’s version / Version de l'éditeur:
Vous avez des questions? Nous pouvons vous aider. Pour communiquer directement avec un auteur, consultez la première page de la revue dans laquelle son article a été publié afin de trouver ses coordonnées. Si vous n’arrivez pas à les repérer, communiquez avec nous à PublicationsArchive-ArchivesPublications@nrc-cnrc.gc.ca.
Questions? Contact the NRC Publications Archive team at
PublicationsArchive-ArchivesPublications@nrc-cnrc.gc.ca. If you wish to email the authors directly, please see the first page of the publication for their contact information.
https://publications-cnrc.canada.ca/fra/droits
L’accès à ce site Web et l’utilisation de son contenu sont assujettis aux conditions présentées dans le site
LISEZ CES CONDITIONS ATTENTIVEMENT AVANT D’UTILISER CE SITE WEB. Canadian Acoustics, 18, Sept. 3, pp. 15-27, 1990-09-01
READ THESE TERMS AND CONDITIONS CAREFULLY BEFORE USING THIS WEBSITE.
https://nrc-publications.canada.ca/eng/copyright
NRC Publications Archive Record / Notice des Archives des publications du CNRC :
https://nrc-publications.canada.ca/eng/view/object/?id=652850d0-33bb-41df-9e97-60089682a64a https://publications-cnrc.canada.ca/fra/voir/objet/?id=652850d0-33bb-41df-9e97-60089682a64a
NRC Publications Archive
Archives des publications du CNRC
This publication could be one of several versions: author’s original, accepted manuscript or the publisher’s version. / La version de cette publication peut être l’une des suivantes : la version prépublication de l’auteur, la version acceptée du manuscrit ou la version de l’éditeur.
Access and use of this website and the material on it are subject to the Terms and Conditions set forth at Evaluation of measurement limits of transducer mountings in the ground
Ser
TH1 National Research Conseil national
N21d
1+1
Council Canada de recherche5 Canadano. 1668
c.2 Institute for lnstitut de
.RLOG Research in recherche en
_---
- Construction constructionEvaluation of Measurement Limits of
Transducer Mountings in the Ground
by M.O. Al-Hunaidi and J.H. RainerReprinted from Canadian Acoustics Vol. 18, No. 3, 1990 p. 15-27
(IRC Paper No. 1668)
NRCC 32336
EVALUATION OF MEASUREMENT LIMITS OF TRANSDUCER
MOUNTINGS IN THE GROUND
M.O. Al-Hunaidi and J.H. Rainer Ins ti tute for Research in Construction National Research Council of Canada
Ottawa, Ontario
KIA
OR6ABSTRACT
The distortion of ground vibration measurements by different methods for mounting transducers in the ground is investigated experimentally. The following mountings are considered: ti) Tapered stake having cruciform cross- section; (ii) Wood plate attached to the ground with threaded thin rods; and (iii) Embedded aluminum box of density equivalent to that of soil. The frequency range over which acceptable measurements of ground vibrations can be made is determined for each of these mountings using frequency response tests. These tests are performed by lightly impacting the mounting with a small instrumented hammer. The impact force and the response of the mounting were recorded and analyzed on a two-channel frequency analyzer. Tests were performed at two sites: stiff clay and fine loose sand. Results show that the frequency limit for acceptable accuracy was about 200 Hz for the plate and stake mountings, whereas that for the embedded box mounting was about 120 Hz. The plate and stake mountings were found more convenient to use than the embedded box mounting.
RESUME
Les auteurs etudient exp6rimentalement la distorsion des mesures de vibrations du sol effectuees h l'aide de differentes methodes de montage de transducteurs dans le sol. 11s examinent les dispositifs de montage suivants : (i) un piquet de section cruciforme; (ii) une plaque de bois fix& au sol au moyen de minces tiges filetees; (iii) un coffret d'aluminium enterre et ayant une densite equivalente h celle du sol. Pour chacun de ces montages, on dc?termine, au moyen d'essais de reponse de frequence, la bande de fr6quences dans laquelle des mesures acceptables des vibrations du sol peuvent etre effectuees. Ces essais consistent A
.frapper legerement le montage avec un petit marteau dot4 d'un dispositif de mesure. La force d'impact et la reponse du montage ont et6 enregistrees et analysees A l'aide d'un analyseur de frequences A deux canaux. Les essais ont 6t6 realises sur un terrain d'argile dense et sur un terrain de sable fin meuble. Les resultats montrent que pour obtenir une prkision acceptable la limite de frbquence doit &re d'environ 200 H z dans le cas des montages avec plaque et piquet, et d'environ 120 Hz dans le montage ii coffret enterr6. Les deux premiers
1
INTRODUCTION
The measurement of ground-borne vibrations from sources such as railway and highway traffic, mining, tunnelling and blasting is important for investigating the effects of these vibrations on nearby buildings and their contents. It is necessary to ensure that these measurements be undistorted and accurate. In this respect, the complexity and difficulty of proper transducer attachment to the ground is a major obstacle. Measurement transducers, which are generally very small in size, are mounted on larger objects, e.g. a stake or a plate, to provide sufficient coupling to the ground. Contrary to expectations, however, proper coupling to the ground may not always be achieved; kinematic and inertial effects also occur due to the geometry and mass of the mounting device, respectively. Consequently the measurement system supported by the ground will form a resonant system that may be incapable of faithfully transmitting the free field motion.
At present, no standard methods for mounting transducers on the ground are known to the authors. In fact, a variety of methods exist. These methods are generally designed to minimize measurement errors within a frequency range of interest. However, due to the wide variety of soil types and the different characteristics of the mounting system in varying vibration modes, it is difficult to advocate a particular mounting design that would be applicable under all conditions. In addition, the lack of documented experimental evidence makes it impossible to evaluate available mounting designs and to clearly establish the superiority of any particular type.
The objective of this paper is to present a comparative assessment of the performance of different methods of mounting transducers in the ground and to determine the frequency range over which accurate measurement of the ground motion can be expected. Some of the transducer mounting methods reviewed below are believed to be appropriate for a wide range of conditions. Hence they are selected for further investigation and testing according to unified procedures. The following mounting methods were investigated:
-
aluminum stake with a cruciform section [I]-
wooden plate attached to the ground with thin threaded rods [2]-
aluminum box, of effective density equivalent to that of soil, embedded in the ground [3]2
REVIEW OF TRANSDUCER MOUNTING METHODS
Mounting methods can be in general classified into the following categories: (i) Surface plate mountings, (ii) Stake mountings, (iii) Embedded box mountings, and (iv) compensations methods.
Surface plate mountings
The surface plate mountings may be coupled to the ground by any of the following ways:
-
Simply resting on the ground surface, slightly pushed into the ground, or set in the ground such that its top is flush with ground surface [4].-
Attaching the plate to the soil in an embedment of plaster of Paris [5].-
Attaching the plate to the soil by driving thin rods through the corners ofthe plate [2].
The vibration characteristics of a plate resting on the ground can be determined analytically employing a mass-dashpot-spring analog to model the mount (e.g. see [6,7,81). Results should be treated with caution especially when the analytical assumptions are not well founded, e.g. poor coupling. Analytical results, however, can serve as guidelines for proper mounting design. As an example of poor agreement between analytical and experimental results, Gutowski et al. [4] reported a vertical resonance frequency of 90 Hz in the field for an aluminum disk, 15.25 cm in diameter and 2.5 cm in height, which was set 1.25 cm into soil. Analytical solutions indicate much higher resonance frequency (well above 200 Hz). The low value obtained in the field is probably due to poor coupling between the plate and the supporting soil.
Verhas [5] reported a resonance frequency of 468 Hz for an aluminum plate, 205x205~10
mm?
in an embedment of plaster of Paris. Obviously, the embedment ensured intimate coupling with soil. The resonance frequency of this system is well above the frequency range of interest of ground vibrations. Attaching the plate to soil by driving thin rods through its comers seems to provide good coupling. For a 90 x 90 x 12.5 mm plywood plate and 75 mm and 50 mm long spiral nails as rods through the corners and in the interior, respectively, Barman and Coulter [2] report a vertical resonance frequency of 600 Hz for soft soils and much higher values for stiff soils.Stake Mountings
In this method, the transducer is attached to one end of a steel or aluminum stake that is simply driven into the ground. The stake is usually 150 to 200 mm long. A small plate may be welded to the top end of the stake to which the transducer is attached.
Field tests performed with this mounting method indicate satisfactory performance for measurements of vibrations in the vertical direction but poor
performance with horizontal vibrations [I] [3]. Nolle [I] tested several cross-sectional designs.
Johnson [3] tested the performance of stakes driven horizontally into the sides of a hole in order to measure the motion in the horizontal plane. No evidence of resonance was found in the measured vibrations generated by a hammer impact on the ground surface. However, it is pointed out that this method is useful only in cohesive soils in which the sides of the hole are firm enough for driving a stake into them.
Embedded Box Mountings
In order to eliminate the inertial interaction between the transducer mounting and the supporting soil, the concept of attaching the transducers inside a box and then burying it in the ground
seems
a reasonable approach. The dimensions of the box are selected such that the average density of the box, including the transducers, matches the density of the soil. The box is placed in a shallow hole in the ground and then backfilled with soil. The soil around the box is tamped to ensure good coupling. The size of the box is kept small in comparison with the shortest wavelength of interest in ground vibrations in order to minimize kinematic interaction effects.Johnson [3] reported satisfactory performance of this mounting device. The box used was 160 x 160 x 12.5 mrn made of 12.5 mm thick aluminum and buried in a 230 mm deep hole. No resonance was observed due to an excitation generated by a hammer impact on the ground surface. The disadvantage of this mounting method is the amount of soil disturbance caused by the installation of the box [2] [9]. In addition, if the backfill must be watered to achieve good compaction, the moisture may interfere with the transducer cabling especially if piezoelectric accelerometers are used [9].
Cornpensat ion Methods
An alternative to optimum transducer mounting design is to physically compensate for errors caused by the dynamic interaction between the mount and the supporting soil. Prange [lo] presents a mechanism to compensate for the inertia effects of surface mountings in the vertical direction. The principle of the proposed mechanism is to satisfy the condition of zero dynamic contact pressure between the measurement system and the ground, i.e. preserve the free field condition. The proposed system consists of two parts held together by springs. An auxiliary vibrator (an electrodynamic system) is attached to the moving part of the assembly. The vibrator generates an internal force in such a manner that the condition of stationary center of gravity of the complete assembly is achieved, implying a condition of zero
contact pressure. A special electronic circuit is designed to control the power supply to the auxiliary vibrator. Obviously this is a complicated system and the extension of the compensation mechanism to other modes of vibrations seems to be a formidable task.
3
TESTING
METHOD
In order to assess the performance of a mounting system, a frequency response test is performed. The mounting system is excited by either of the following two methods:
applying an impact to the mounting separately in the horizontal and vertical directions with a small instrumented hammer (e.g. PCB model 086A03) as shown
in
Figure 1, [5];coupling an electrodynamic shaker (e.g. model No. 89940 by Goodman Vibrators Ltd.) to the mounting as shown in Figure 2, [1,2].
The applied force and the acceleration response of the system are recorded on a two channel frequency analyzer. Fourier transforms of the force and acceleration are then computed and the results displayed in one of two forms: acceleration divided by force (i.e. acceleration frequency response); or, after double integration, displacement divided by force (i.e. displacement frequency response).
The criterion used to evaluate the frequency range over which the mounting provides satisfactory transmission of ground vibrations can be based on the frequency response characteristics of the mounting in terms of displacement or acceleration. Considering the displacement response curve, the accurate frequency range would be that over which the displacement response is nearly constant (or flat), as illustrated in Figure 3a. A constant displacement
frequency
response implies negligible inertial effects of the mounting. The part of the displacement response curve which is constant corresponds to a part of the acceleration response curve which is parabolic (Figure3b).
Expressing the acceleration amplitude in decibels (dB), the acceleration response function is then equal to
where Do is the constant displacement amplitude, and w is the frequency. Hence, by examining the acceleration response curve of the system, the frequency range over which accurate measurements can be expected is that over which the response curve is sloping at 40 dB/decade, as shown in Figure 3c. The frequency at which the frequency response curve deviates by +3 dB from the 40 dB/decade slope is taken as the limit of
Figure 1 Instrumented small hammer
acceptable measurements. This criterion is * :; *; J
the same as that used in reference [I]. 0
L
:
Alternatively, the corresponding frequency 4 limit using the linear displacement curve(Figure 3a) is that at which the frequency
.
response curve deviates from the constant ,.,
-
#
displacement part by +41% or -29%. t . a Fsucn~rQI3 nm.o+
Tests carried out in a laboratory soil a.oeea-
box and in the field indicate that virtually the same frequency response of the mounting system can be obtained by exciting the system with either of the two
methods: a light tap applied with a small
'"
#+a m.Oohammer instrumented with a force t*.aaa
-
mtransducer; or an electrodynamic shaker z
-
W coupled to the mounting via a force1
:
3 . transducer. This is illustrated in Figure 4,
g
-
which shows the acceleration frequency1
:
response of the embedded box mounting.,.,,,
obtained by the two different excitation a a a lDmD 3.0. aa
Figure 3 Typical frequency response
methods. It can be seen that the two function of a mounting
response curves are in good agreement. The
hammer was subsequently used in all tests reported in this paper since it was found more convenient to use in a field environment than the electrodynamic exciter.
Initially, laboratory tests were performed to determine the frequency response of the mountings for different soil types under controlled laboratory conditions. For this purpose a 65x82~50 cm (deep) box filled with soil was used. A few tests were performed with loose sand and with a mixture of clay and sand. Soon it was found, however, that the frequency response functions from these tests have several resonance frequencies. These resonance frequencies are believed to be caused by the limited size of the soil box rather than the mounting/soil system. In order to eliminate the box effect, a larger box would be needed to allow wave energy radiating away from the mounting long enough time to dissipate before it arrives at the boundaries of the box. The effort involved in preparing a larger box was considered unwarranted, and therefore laboratory tests were abandoned in favour of tests carried out at two outdoor sites. The soil type at the first site was stiff clay and at the second site fine loose sand.
Figure 4 Comparison between response functions using different excitation rnethods
Employing the frequency response function of a mounting device is sufficient for establishing an acceptable measurement range. Ideally however, employing the so called transmissibility function is more appropriate since it is a direct indication of distortions caused by the mounting system. The transmissibility function of a mounting system is the ratio of the motion recorded using the mounting system to the
free field motion. The transmissibility function defined as such is probably impossible to determine experimentally. Alternatively, it
can
be defined as the ratio of the force transmitted by the mounting system to the ground (reaction force) to the force applied with the impact hammer to the mounting. The the reaction force can be calculated analytically by employing the equilibrium equation of the mounting system. Obviously, this requires further data manipulation and calculations which might render the process impractical for field application. Work in this area is currently under progress.4
DESIGN AND INSTALLATION OF MOUNTINGS
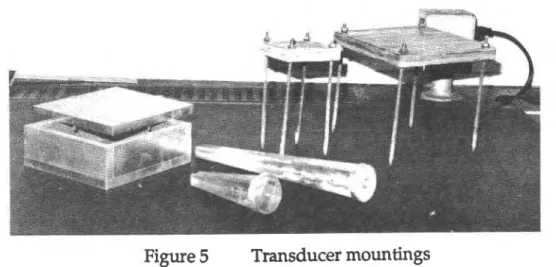
Frequency response tests using a light hammer impact were performed in the field for the following three types of transducer mountings (shown in Figure 5):
(a) A stake made of a 10
mm
(thickness) x 50 mm (diameter) top plate and tapered 4 mm thick plates welded to form a cruciform section. Two different lengths were tested: 150 mm and 300mm
long, both made of aluminum, with tapering ratios of 10:l and 20:1, and weights 175 g and 300 g, respectively. This design of the stake has a high surface area to mass ratio and hence is believed to provide good coupling with the soil and minimal inertia effects.(b)
A plate made of 19mm
thick plywood. It is attached to the ground with four 5 mm diameter 150 mm long threaded thin rods driven into soil through holes in the corners of the plate. Proper coupling to the ground isensured by hand-tightening nuts attached to the top end of the rods. Two plate sizes were tested: 175
mm
x 175mm
and 90mm
x 90mm.
The weights of the large and small plates (including the rods) are 440 g and 210g,
respectively.(c) A box type mounting constructed of 12.5 mm thick aluminum and with dimensions 165 mm x 165 m m x 70 mm high and weighing 2880 g. The effective density of the box is equal to 1.6 t/m3 (approximately equivalent to that of soil). The box is embedded in the soil, flush with the ground surface. The soil around the sides of the box is tamped down firmly to ensure proper coupling.
A 38~38x38 mm solid aluminum block (150 g) was attached to the wood plates and to the top end of the stake mountings. Accelerometers were then attached to this block by two-sided tape. Only one accelerometer was attached during a test, either in the vertical or in the horizontal directions. For the embedded box, transducers were directly attached to the inside walls of the box by two-sided tape.
To install the mountings, grass roots and top soil were carefully excavated to a depth of 150 mm. The bottom of the excavation was kept flat and undisturbed.
Figure 5 Transducer mountings
5
INSTRUMENTATION
Measurements were made using piezoelectric accelerometers (PCB model 308BlO) with a sensitivity of 0.1 V/g (volts/acceleration due to gravity). The weight of the accelerometer is 78 g. The impact was applied with a small hammer (PCB model 086A03) of mass 135 g, fitted with a plastic tip. The hammer is instrumented with a force transducer (PCB model 208A03) having a sensitivity of 10 mV/lbf (milli volts
/
pound-force). The signals were recorded and analyzed on a two channel narrow-band frequency analyzer (Hewlett-Packard model HP5423A).
6 EXPERIMENTAL RESULTS OF FREQUENCY RESPONSE TESTS
The frequency range over which reliable measurements can be expected is determined by inspecting the logarithmic acceleration frequency response of the mounting system. Typical acceleration frequency response curves for the vertical and horizontal directions for the various mountings are shown in Figure 6. In these figures it can be observed that the frequency response curves deviate substantially from the ideal 40 dB/decade line at low frequencies. This deviation can be attributed either to background noise or to noise in the instrumentation system. This noise becomes significant since the acceleration levels of the true signal in the low frequency range are very small. The peak which appears at 60 Hz in the response of the embedded box is apparently due to an electrical interference. The upper frequency limits for the f3 dB acceptable measurement range are summarized in Table 1. From the results presented in this table, the following observations can be made:
-
The maximum frequency for acceptable measurements for the horizontal direction of motion is lower than that for the vertical direction forall
types of mountings except for the embedded box.-
As expected, the maximum frequencies for acceptable measurements forsite 2 are lower than those of site 1 since the soil of site 2 has a lower modulus of rigidity than that of site 1. However, in the case of the short stake, the difference in maximum acceptable frequencies between sites 1 and 2 is not very significant. This could be an indication that the tapered cruciform design of the stake that has a high surface area to mass ratio provides good coupling with the soil, regardless of its type, and minimal inertia effects.
-
The embedded box has the lowest limit for acceptable measurements (122Hz). This, however, may still be considered sufficient for some applications such as road and railway traffic-induced ground vibrations. It should be noted that the results in Table 1 are applicable for sites with soil properties similar to those of sites 1 and 2. Sites with lower modulus of rigidity should be expected to have lower limits for acceptable measurements. The acceptable frequency range would also decrease as the mass of the mounting and its elements increases. When doubt arises as to the reliability of a mounting system for a specific
150 mp stake g
.
S t i f f c1.y $0." Embedded Box 5.
S t i f f c l a y Vertical s I#. r ~ ~IOSI t w Y . W 115x115 am2 P l a t e 3.
S t i f f c l a y : Horizontal t 5 ' :-
! .-
175x115 m2 P l a t e.
Pine nand Vert i c a l \.- rr.qLuoSI 1.1) Y . I "-
150 m stake ; ' S t i f f 01.1 , ~ o r i c o n t a l Embedded Box 3 . S t i f f c l a y Horizontal ." ," I I-
rc.qu.ncy I I ~ I YI *..I 150 m Stake 40 &/decade . Embedded Box ! Pine nand.
' Horizontalsite, a frequency response test should be performed at the site in order to establish the frequency limit for acceptable measurements. This test, when performed with the hammer impact method, is quick and simple to carry out in the field.
Table 1 Upper frequency limits (Hz) of the acceptable measurement range (& 3 dB tolerance)
Soil Type Direction 175 x 175 mm 90 x 90 mm 300 mm 150 mm Embedded Wood Plate Wood Plate long long Box
With Rods With Rods Stake Stake
Stiff clay Vedcal 350 720 482 322
415
Horizontal 278
-
322 401Loose sand Vertical 255 330 759 442 122
Horizontal 235
I
209 443 311 2087
CONCLUSIONS
The frequency response characteristics of the tested mounting designs show that adequate accuracy of ground vibration measurements can be achieved for the soils of sites 1 and 2, stiff clay and fine loose sand, respectively. However, when these mountings are attached to weaker soils, it should be expected that the frequency limit of acceptable measurements will be lower than that of the test sites in this study. If the reliability of a mounting system for a specific soil is suspect, a frequency response test should be performed at the site in question to verify the acceptable measurement range.
Tests performed in this study indicate that lightly impacting the transducer mounting with a small hammer provides a reliable, quick, and simple method for obtaining the frequency response characteristics of a mounting design. Present capabilities of field instrumentation and analysis including implementation of I33
functions
in
portable equipment provide the opportunity to easily perform and analyse frequency response tests in the field.Both the plate attached to soil with threaded rods and the aluminum stakes with a cruciform cross-section have acceptable measurement for frequencies up to about 200 Hz, and were found simple and convenient to use. The box type mounting, however, was not found convenient due to difficulties during its installation, e.g. improper leveling and inadequate compacting. In addition it has a smaller frequency limit for acceptable measurements (about 120 Hz) than the plates and aluminum stakes.
ACKNOWLEDGEMENTS
This work was partially supported by a contract from the Ontario Ministry of the Environment. The authors are grateful to Messrs.
R
Glazer, P. Daly, and L. Fronteddu for their help with the experiments. The council of Dr. H. Baker regarding soil box trials is gratefully appreciated.REFERENCES
[I] Nolle, H., "High fre uency ground vibration measurements", The Shock and Vibration Bulletin, B
&
etin 48, Part 4,95-103,1978.[2] Barman, M., and Coulter, J.E., "An im roved transducer mount for ground vibration measurements", Acoustics and oise Control in Canada, voL 9,40-52,
1980.
i;
E31 Johnson, C.F., "Coupling small vibration gages to soil", Earthquake Notes, voL 33,40-47,1962.
[4] Gutowski, T.G., Wittig, L.E., and Dym, C.L., "Some as ects of the ground
P
vibration problem", Noise Control Engineering, vol. 10,94 00,1978.
[5] Verhas, H.P., "Measurement and anal sis of train-induced ground vibrations", Noise Control Engineering, vol. 13,2&, 1979.
[61 Moore, P.J., 'Measurement of vertical ound vibrations", Roc. of the ASCE In
Situ186 Specialty Confr., (edited by
ST.
Clemence), Blacksburg, Va., 840-852,1986.
[a
Ornata, S., "Ground couplings and measurement frequency ranges of vibrationtransducers", J. Acoustical Society of America, vol. 73,2187-2192,1983.
[8] Omata, S., and Morita, S., "Horizontal resonant frequencies of vibration pickup on soil surface", J. Acoustical Society of America, voL 66,965-975,1979.
[9] Nelson, J.T., and Saurenman, H.J., State-of-the-art review: Prediction and
Control of groundborne noise and vibration from rail transit
trains,
U.S. Dept. of Transportation, Report No. UMTA-MA-06-0049-83-3, 1983.[lo] Range, B., "Inertia compensation of vibration transducers", Proc. 9th Int'l Confr. Soil Mech. Found. Engg., Tokyo, Japan, vol. 2,337-3451977.
This paper is being distributed in reprint form by the Institute for Research in Construction. A list of building practice and research publications available from the Institute may be obtained by writing to Publications Section, Institute for Research in Construction,
National Research Council of Canada, Ottawa, .
Ontario, KIA 0R6.
Ce document est distribuk sous forme de tir6-a-part par
1'Institut de recherche en construction. On peut obtenir une liste des publications de 1'Institut portant sur les techniques ou les recherches en mati&re de bitiment en bcrivant A la Section des publications, Institut de recherche en construction, Conseil national de recherches du Canada, Ottawa (Ontario), KIA 0R6.