Clinical Trend Discovery and Analysis of Taiwanese
Health Insurance Claims Data
by
Divya P. Pillai
S.B., Massachusetts Institute of Technology (2015)
Submitted to the
Department of Electrical Engineering and Computer Science
in partial fulfillment of the requirements for the degree of
Master of Engineering in Computer Science and Molecular Biology
at the
MASSACHUSETTS INSTITUTE OF TECHNOLOGY
June 2016
c
○
Massachusetts Institute of Technology 2016. All rights reserved.
Author . . . .
Department of Electrical Engineering and Computer Science
May 20, 2016
Certified by. . . .
Peter Szolovits
Professor of Computer Science and Engineering
Thesis Supervisor
Accepted by . . . .
Christopher J. Terman
Chairman, Masters of Engineering Thesis Committee
Clinical Trend Discovery and Analysis of Taiwanese Health
Insurance Claims Data
by
Divya P. Pillai
Submitted to the Department of Electrical Engineering and Computer Science on May 20, 2016, in partial fulfillment of the requirements for the degree of
Master of Engineering in Computer Science and Molecular Biology
Abstract
Data-driven analysis can improve our understanding of medicine, and data from elec-tronic health records and labs has been used successfully in predictive tasks. Less advanced analysis has been done on health insurance claims data, which can be rich and more structured but large in scale. Taiwan has had nationalized health insurance for twenty years; its National Health Research Institute Database (NHIRD) contains records of insurance claims, including medications, prescriptions, and treatment costs for both inpatient and outpatient visits, spanning sixteen years and a million patients. The NHIRD enables longitudinal studies of a patient’s medical progression as well as aggregation and generalization to population-level insights. We conducted prelim-inary exploration of data trends in aggregate, such as diagnosis code frequency and average treatment cost over time. An infrastructure to perform large-scale queries and handle results was required to effectively use the NHIRD for research applications. After indexing database tables to improve query performance, we created a pipeline in Python to connect to and query the database, analyze data for hypothesis discov-ery and hypothesis testing, convert Taiwanese codes to international standards, and produce plots and graphs. This pipeline was used to examine drug side effects and comorbidities observed across a population, accounting for demographic variables. We also studied patient-specific longitudinal matrices of medical events, which were highly sparse. We attempted quantitative imputation methods to densify these ma-trices, but because the data was binary (indicating the presence of an event at a given time), categorical, and irregular, advanced imputation offered limited benefit. Nev-ertheless, we discovered interesting patterns in cohorts of diabetes patients treated with various classes of drugs. This information can be exploited in computational phenotyping and other learning methods, and combined with other data sources it could increase accuracy of clinical predictive tasks.
Thesis Supervisor: Peter Szolovits
Acknowledgments
Sincerest of thanks to my advisor Peter Szolovits, who supported my Masters with a research assistantship. Pete gave me immensely helpful guidance and has been hugely accomodating, giving me flexibility and freedom to work independently while always being available to help no matter how late the hour I emailed. I could not have had a better research supervisor and don’t know how to thank him enough.
Thanks to the contacts at Taiwan-NKCU that supported my grant and those that have helped me understand the Taiwanese dataset, including Yun Liu.
Thanks as well to the MEDG group, especially Marzyeh Ghassemi and Tristan Naumann, that has been so welcoming to me. Their genuine excitement for the work they do (evidenced by their hilarious reading group discussions) is really inspiring.
Thanks to my class and research experiences that have provided context for under-standing healthcare systems. In particular, my senior year UROP at MGH with Dr. Arvind Ravi, a fantastic mentor himself, gave me invaluable experience to prepare me for this project and introduced me to Pete in the first place. The Sloan Healthcare Certificate program offered classes that went deeper into understanding healthcare in the U.S. as compared with other countries, giving me a basis with which to compare Taiwan.
Thanks to my academic advisor Martha Gray for guiding me these past five years, helping connect me with incredible opportunities, and coming to support me at my concerts.
Last but far from least, thanks to my dearest family: my mom, my dad, and my sister, for their love and support the past 22 years, even when the opportunities take me far from home.
The research reported in this thesis was supported by Quanta Computer Inc. through the Qmulus project in collaboration with MIT CSAIL.
Contents
1 Introduction 11
1.1 Overview . . . 11
1.1.1 Data analysis in healthcare . . . 11
1.1.2 Taiwanese health insurance . . . 12
1.1.3 Database . . . 13
1.2 Previous work with NHIRD . . . 14
1.3 Goals . . . 14
2 Background 17 2.1 Diagnosis . . . 17
2.1.1 Inpatient vs. Outpatient settings . . . 17
2.1.2 International codes: ICD-9 . . . 18
2.1.3 Diagnosis code systems in Taiwan . . . 18
2.1.4 Disease phenotype aggregation . . . 19
2.2 Medications . . . 20
2.2.1 ATC codes . . . 21
2.2.2 Mapping Taiwanese codes . . . 21
3 Database Exploration 23 3.1 Diagnosis Frequency . . . 23
3.1.1 Outpatient . . . 25
3.1.2 Inpatient . . . 28
4 Pipeline 33
4.1 Database preprocessing (PostgreSQL) . . . 33
4.2 Querying pipeline (Python) . . . 34
4.3 Further analyses (Python, MATLAB) . . . 35
5 Medication Side Effects 37 5.1 Known side effect: rofecoxib and MI . . . 37
5.1.1 Rofecoxib codes and dosage frequency . . . 38
5.1.2 Myocardial infarctions . . . 39
5.1.3 Rofecoxib vs. Naproxen . . . 41
5.2 Demographics adjustment . . . 41
5.3 Type 2 Diabetes . . . 42
5.3.1 Classes of diabetes drugs . . . 42
5.3.2 Thiazolinedione side effects . . . 44
6 Individual Patient Medical History 47 6.1 Matrix Representation . . . 48
6.2 Data Imputation . . . 49
6.2.1 Standard methods . . . 49
6.2.2 Advanced methods in literature . . . 50
7 Conclusion 53 7.1 Results . . . 53
7.2 Future Work . . . 54
7.3 Summary . . . 55
List of Figures
3-1 Top 15 most coded outpatient diagnoses, 2000-2012 . . . 24
3-2 Top 15 ICD-9 (HCC) groups, Outpatient diagnoses 2000-2012 . . . . 26
3-3 Top 15 PheWAS codes, Outpatient diagnoses 2000-2012 . . . 27
3-4 PheWAS categories, outpatient diagnoses 2000-2012 . . . 28
3-5 Top 15 most coded inpatient diagnoses, 2000-2012 . . . 29
3-6 Top 15 most expensive outpatient billing codes on average, 2000-2012 30 4-1 Pipeline . . . 34
5-1 Rofecoxib outpatient prescription frequency . . . 39
5-2 Myocardial infarction incidence . . . 40
5-3 Myocardial infarction distribution by age, stacked by gender . . . 40
5-4 Myocardial infarction medications . . . 41
5-5 Diabetes over time . . . 43
5-6 Diabetes age of onset . . . 43
5-7 Diagnoses after thiazolinedione prescription: (left) rosiglitazone, or (right) pioglitazone. Codes in the legends are described in appendix A.3. 45 6-1 Schematic to make matrix . . . 48
List of Tables
1.1 Database Table Sizes . . . 13
3.1 Top 15 outpatient diagnoses, 2000-2012 . . . 24
3.2 ICD-9 top 15 code groups, outpatient diagnoses 2000-2012 . . . 26
3.3 PheWAS top 15 code groups, outpatient diagnoses 2000-2012 . . . 27
3.4 Top 15 inpatient diagnoses, 2000-2012 . . . 29
3.5 Top 15 expensive outpatient billing codes, 2000-2012 . . . 31
5.1 MI risk Vioxx vs. Naproxen . . . 42
6.1 Method accuracy . . . 50
A.1 Database table statistics . . . 58
A.2 Diabetes drugs and ATC codes . . . 59
Chapter 1
Introduction
This chapter will explain the challenges associated with this specific dataset as well as healthcare systems in general, while providing a foundation for the problems we attempted to address with this data in later chapters. Chapter 2 provides a back-ground on medical terminology, the Taiwanese system, and international standards. Chapter 3 outlines findings from our initial data exploration to better understand the database and population-level trends. Chapter 4 describes the processes to perform more systematic analysis: the adjusting and indexing of the database, and the de-velopment of a pipeline coded primarily in Python. Chapter 5 describes results from one of the primary applications of the pipeline: to detect potential side effects of prescription drugs and determine their relative risks. Chapter 6 focuses on analyses specific to the individual patient, including attempts at missing value imputation on matrix representations of a patient’s medical history. Finally, chapter 7 summarizes these results and highlights potential avenues for further research.
1.1 Overview
1.1.1 Data analysis in healthcare
Countries around the world are increasingly instituting healthcare reform, moving towards more comprehensive, even universal, coverage. Coupled with this shift is the
introduction of electronic documentation requirements, which aim to bring healthcare technology up to par with other industries by centralizing clinical information and facilitating reimbursement. These requirements result in a large accumulation of data from electronic health records (EHRs) used in clinical practice, quantitative lab results, and insurance claims for reimbursement. Whether intended for clinical or billing purposes, this data can be immensely useful in answering questions relating to population health, disease progression, or an individual patient’s medical trajectory. Data in EHRs can include a mix of structured and unstructured fields, with much of the informative content inside the free-text of a physician’s notes. In contrast, claims data is far more structured, adhering to strict requirements to be processed for reimbursement purposes. A patient’s diagnosis, prescriptions, and ordered procedures are all represented by standardized alphanumeric codes, with other relevant informa-tion like the time of encounter and patient identificainforma-tion number well-documented. This structure gives claims data the advantage of clarity and ease of processing com-pared to other data sources.
Yet, claims data is not often analyzed on its own or as the primary data source for clinical questions. Since its purpose is administrative, there may be distrust as to its comprehensiveness for clinical questions. And in countries where reimbursement for health-related costs can be done by a mix of public and private agencies, with numerous insurance companies, it may be nearly impossible to have a single compre-hensive data source containing all the claims for a set of individuals. This concern is remedied in countries like Taiwan, which has had single-payer nationalized health insurance for about twenty years.
1.1.2 Taiwanese health insurance
Taiwan implemented a nationalized health insurance program in 1995, as a single-payer system covering medical costs with a low co-pay. Currently over 99.9% of its 23.4 million citizens are enrolled in the program. Taiwan’s National Health Research Institute Database (NHIRD) maintained and stored records of insurance claims, in-cluding medications, prescriptions, and treatment costs for both inpatient and
out-Table 1.1: Database out-Table Sizes
Table Outpatient Inpatient
Visits 67 GB 1 GB
(diagnoses) 222 million rows 1.6 million rows
Orders 136 GB 12 GB
(prescriptions, procedures, labs) 977 million rows 82.8 million rows
patient visits, spanning sixteen years (1996-2012) [1].
Our lab currently has access to an anonymized subset of data from both inpa-tient admissions and outpainpa-tient visits, covering 1 million unique painpa-tients. Although the data is deidentified (stripped of sensitive identifying information such as name and medical record number), there are unique patient identifiers to link records that belong to the same patient across different tables. Thus, we can track a patient’s medical progression over time in longitudinal studies, and the large data size permits generalization to population-level insights.
1.1.3 Database
The high volume of the NHIRD could allow for more comprehensive analyses than were possible with previous medical databases. Yet, the same feature that would make analysis rewarding also poses a computational challenge. The PostgreSQL database sits on a remote server with limited RAM. The initial data queries triggered on the remote server can be slow to return a large number of results, but the data cannot be moved elsewhere until it is analyzed, incurring an additional IO cost between the remote server and our computers. In such a large database, potential cohort sizes could be prohibitively large, so queries should be designed appropriately and efficiently, limiting the cohort size as necessary and appropriate.
While we were not allowed to modify the original database, we were allowed to copy tables from the original database into a separate working database on the remote server. There, we could create custom tables and indices to speed up queries. We created indices on columns used most commonly in our queries, and while they took
up additional GB of disk space, they sped up results immensely.
The most relevant columns in the NHIRD, such as diagnostic and procedure codes, are structured fields, making analysis simpler than it would be, for example, on free text notes.
1.2 Previous work with NHIRD
The NHIRD has previously been used to answer several questions with a variety of focuses: some studies relate to the treatment of an individual disease [2], while others look at broader patterns in treatment cost [4], physician practices [3, 5], or even the accuracy of the database itself [6]. While these studies have been informative and useful as models for future research, few of the clinically-focused studies use analysis more advanced than adjusted odds ratios, and they rarely go beyond a single disease phenotype.
Peter Szolovits and previous UROP student Neil Gurram used R scripting to connect to a sample database and perform some initial analyses on subsets of this data. However, as Python had similar functionality in database connection and analysis, and the full database required different parameters, I started from scratch and wrote most of my code in Python.
1.3 Goals
1. Exploratory analysis
To better understand the data we were working with, we searched for large-scale aggregate trends across the population. While the NHIRD has been analyzed before to answer several specific questions, an understanding of the database as a whole, such as general size of the data tables (as shown in 1.1) or com-monly observed diagnoses, was previously lacking. This exploration confirmed the comprehensiveness of the Taiwanese dataset to answer a broad range of clinically relevant questions. It also helped us better understand steps to take
to standardize our analysis procedure.
2. Pipeline development for generalized analysis
As discussed further in 4.2, we wrote code in Python for most of the analysis, organizing roughly into modules grouped by function. Some statistical methods, especially those from other sources, were implemented in MATLAB.
3. New clinical discoveries
We used this pipeline to answer clinical questions both on broader scales related to drug side effects and disease management, as well as on the level of a specific patient.
Chapter 2
Background
This chapter will explain some of the terminology and concepts required for healthcare analysis, as they relate to the Taiwanese system and international standards.
2.1 Diagnosis
Physicians determine the patient’s likely disease state with a diagnosis, represented by a standardized diagnosis code in structured EHR fields and claims data.
2.1.1 Inpatient vs. Outpatient settings
Our database tables are separated by inpatient and outpatient settings. The term "inpatient" implies that the patient is formally admitted to a hospital facility on a doctor’s order, with a corresponding admission date and a discharge date when the patient leaves the hospital. The majority of inpatient admissions come through the emergency room. "Outpatient" services are broader, encompassing visits to clinics, initial emergency department services, and rehabilitation services. Outpatient care is also referred to as ambulatory care. In practice outpatient visits far outnumber inpatient admissions; this applies to the Taiwanese database as well, as outpatient tables are far larger than inpatient tables (1.1.3).
2.1.2 International codes: ICD-9
The International Statistical Classification of Diseases, 9th revision, clinical modifi-cation (ICD-9-CM) is used in the U.S. as well as other countries. The ICD-9 codes are standard: they are generally three digits (sometimes prefaced with a letter) cor-responding to a general diagnosis, and more specific details about the diagnosis have codes that differ in the digits after the decimal point.
Codes that are numerically close often correspond to related diagnoses. Top-level groups combine diagnoses that fall into similar categories: for example, codes 240–279 refer to "endocrine, nutritional and metabolic diseases, and immunity disorders." A following group will be slightly more specific, ex. codes 249–259 code for diseases of "other endocrine glands" (not the thyroid). The primary 3-digit code for diabetes mellitus (DM) is 250. The first digit after the decimal point introduces more speci-ficity, ex. 250.0 is diabetes without mention of complication, while 250.1 is diabetes with ketoacidosis. Diabetes mellitus has two types which are different in mechanism and treatment. While type 1 is often early-onset and characterized by an inability of the pancreatic beta cells to produce insulin (thus being treatable with insulin in-jections), type 2 can occur later in life and is characterized by a resistance to insulin (often requiring combinations of antidiabetic drugs to increase cellular uptake of in-sulin). To accomodate this difference, the ICD-9 codes for diabetes can have a second digit after the decimal point, with any of the complications specified by the first digit. 250.x0 codes for diabetes mellitus type 2, 250.x1 codes for type 1, 250.x2 codes for type 2 uncontrolled, and 250.x3 codes for type 1 uncontrolled.
Currently many countries are undergoing a transition to the newest revision, ICD-10, which introduces many more highly specific codes. However, in the time period studied in our database, ICD-9 was still the standard.
2.1.3 Diagnosis code systems in Taiwan
Prior to 2000, Taiwan was using its own A-code system, a different and more gen-eral diagnosis coding system. In 2000, Taiwan officially implemented a transition to
ICD-9-CM. The use of ICD-9 codes in the NHIRD makes it comparable with other databases that use the same coding system, further facilitating analysis and interpre-tation of results.
However, some A-codes linger in the dataset even after 2000. This is in part because practitioners of Traditional Chinese Medicine (TCM) were slow to convert to ICD-9, as many TCM treatments could not be coded for in the newer systems. Since ICD-9 codes and A-codes are mixed in the same column in the database, dis-tinguishing between the two systems requires preprocessing and knowledge of both coding systems. Even the ICD-9 codes that were used in the Taiwanese dataset differ slightly from the international standard, as they lack decimal points and use leading zeros for lower codes. Data cleaning was needed to verify the validity of the ICD-9 codes missing decimal points and ignore codes that were "junk data," not correspond-ing to any code equivalent in either the modified ICD-9 or the A-code system. After conducting this data cleaning, we found that while A-codes are common from 1996-1999, the most common codes post-2000 were ICD-9, and starting in 2006 no A codes could be found at all.
We note that the ICD-9 codes available in our database primarily pertain to billing for insurance purposes, and they may not necessarily reflect the patient’s true medical state. Past studies on the NHIRD have shown varying levels of diagnostic coding accuracy for a single disease, but the codes are still reasonably useful in large-scale analysis.
2.1.4 Disease phenotype aggregation
It can be useful to group similar or related diagnoses together. Fewer features will make computation faster, and less redundancy in the features will make analysis more meaningful, accounting for variation between different billing codes that represent the same phenotype. The ICD-9 top-level section groups as described earlier can be used for such aggregation. But even those introduce ambiguity and redundancy: codes for different types of diabetes with each complication fall under the same 3-digit code, yet the complications have their own codes in different sections. There could be multiple
ways to code the same diagnosis, yet it is just as easy to lose information representing different diseases if the codes are aggregated by their ICD-9 category alone.
Another attempt at aggregating related ICD-9 diagnoses and mapping them to their corresponding disease is a Vanderbilt project called PheWAS (Phenome-wide association studies). There are 1645 PheWAS case groups (diseases) that are similar to the ICD-9 code groupings, but they "have been revised based on statistical co-occurrence, code frequency, and human review" [7]. For example, there are different ICD-9 codes for type II diabetes based on whether it is controlled or uncontrolled, but PheWAS maps both types to the same code: "250.2: Type 2 diabetes." All the diabetes codes and more fall under PheWAS group 3: "endocrine/metabolic" disorders (there are about 18 such groups). This is similar to the ICD-9 grouping for endocrine/ metabolic/ other disorders, codes 240-279, but it is not limited to these codes, nor does it include all the codes in that group. PheWAS group 3 also includes ICD-9 codes like V85.45, a code for BMI 70 or above in an adult, as it corresponds to "Morbid obesity" (like ICD-9 code 278 for obesity). But PheWAS group 3 does not include the ICD-9 code "256.31: Premature menopause": this is considered more similar to ICD-9 code 627 for menopausal and postmenopausal disorders, so it is grouped under PheWAS group 11, "genitourinary" disorders. The PheWAS mapping may prove to be helpful in aggregating disease codes, especially in larger-scale analysis.
2.2 Medications
A physician can choose to order procedures, prescription medications, and lab results. For this thesis, we focused on the orders for prescription medications. Taiwan used its own coding system with 28664 unique codes for prescription medications, but many of these codes can be different preparations of the same active ingredient, differing in manufacturer or dosage.
2.2.1 ATC codes
The WHO Collaborating Centre for Drug Statistics Methodology maintains a stable list of drug preparations classified according to the Anatomical Therapeutic Chemical (ATC) classification system. The following example of the classification of diabetes drug metformin, code A10BA02, is taken directly from the WHO ATC website [8].
ATC codes are 7 characters long. The first character is a letter corresponding to the first-level anatomical main group: here "A" represents the group for drugs treat-ing the "alimentary tract and metabolism." The followtreat-ing two characters represent the second-level therapeutic subgroup (treatment for a specific disease): here "A10" represents the subgroup for drugs used in diabetes. The following letter forms the third-level pharmacological subgroup: "A10B" is the class of blood glucose-lowering drugs, excluding insulins. The next letter forms the fourth-level chemical subgroup: "A10BA" refers to all biguanides. The final two numbers indicate the specific chem-ical substance: "A10BA02" represents the drug metformin.
2.2.2 Mapping Taiwanese codes
There is a many-to-one mapping between the Taiwanese drug codes and the inter-national ATC codes. Each unique prescription in the Taiwanese database can be mapped to a single unique ATC code representing the functional ingredient. How-ever, one ATC code can refer to many possible Taiwanese prescription codes. For metformin, ATC code A10BA02, there are 151 different Taiwanese prescription codes, including "A034549100: MEGLUMINE TABLETS 500MG (METFORMIN) S.S.P." and "A047594100: ILIMIN FILM COATED TABLETS 850MG S.D." Some may dif-fer in dose; some have difdif-ferent preparations or coatings, and others difdif-fer solely in manufacturer or brand name.
We were provided mappings between the Taiwanese codes and international ATC codes in csv and text files. We converted this into a Python dictionary, with Taiwanese codes as the key and ATC codes as the value. In total the 28664 Taiwanese codes map to 1770 unique ATC codes.
Chapter 3
Database Exploration
The overall sizes of inpatient and outpatient data for visits (diagnoses) and orders (including prescriptions) were listed in 1.1; more detail on the specific database tables partitioned by years is available in table A.1. Our analysis focused on the first four tables listed in that appendix. Birthdate and gender were normally documented in the records of the visit tables, but when they were missing, we could refer to the last table of demographic information (id). This contained the birthdate (month and year), gender, and regional district of each individual. Previous research has looked at variations in care across regions in Taiwan, such as differences between rural and urban settings; we examined it briefly but focused mostly on age and gender as demographic variables.
3.1 Diagnosis Frequency
Though there are 14428 possible ICD-9 codes, many of them are never or rarely ob-served in the NHIRD. 1067 ICD-9 codes never appear in either inpatient or outpatient visits. 61 codes account for the top 50% of billed codes, and 863 codes account for the top 90%. Certain illnesses may be more common than others, and these may vary between inpatient and outpatient visits. Understanding these differences could give us clues as to diseases to focus on in later specific analysis of the Taiwanese population.
Figure 3-1: Top 15 most coded outpatient diagnoses, 2000-2012
Table 3.1: Top 15 outpatient diagnoses, 2000-2012
Diagnosis (ICD9-CM) Frequency 465.9: Acute upper respiratory infections of unspecified site 18446463 466: Acute bronchitis 7249447 401.9: Unspecified essential hypertension 7125307
521: Dental caries 6831468
460: Acute nasopharyngitis [common cold] 6421725 461.9: Acute sinusitis, unspecified 5259519 463: Acute tonsillitis 4393754 250.00: Diabetes mellitus without mention of complication, 4076726 type II or unspecified type, not stated as uncontrolled
462: Acute pharyngitis 3249391 477.9: Allergic rhinitis, cause unspecified 2913866 692.9: Contact dermatitis and other eczema, unspecified cause 2837567 558.9: Other and unspecified noninfectious gastroenteritis 2713511 and colitis
786.2: Cough 2593550
784: Headache 2588796
3.1.1 Outpatient
In figure 3-1 and table 3.1 I explored diagnosis code frequency in the outpatient diagnosis tables, focusing on the top fifteen ICD-9 codes observed in 2000-2012. This counts each visit, not each patient diagnosed: a patient visiting multiple times in a year will increase the count of that diagnosis for each visit.
8 of the top 15 codes correspond to diseases of the respiratory system (460-519), 7 of them acute respiratory infections (460-466). This suggests that certain disease groups will account for most of the outpatient visit codes. It will be interesting to see how the ICD-9 groups compare with other aggregation such as PheWAS, especially since the 13th billing code, "786.2: Cough," does not fall in the same ICD-9 code group but could be a symptom of respiratory disease.
Aggregation (outpatient diagnosis codes)
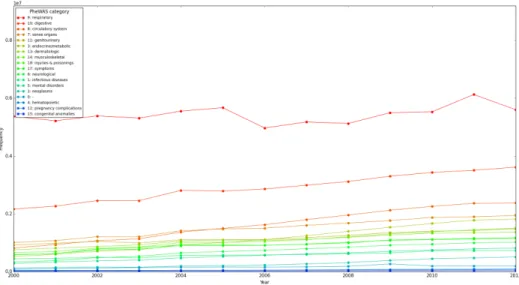
The initial level of PheWAS code grouping (3-3) is very similar to that of the original ICD-9 diagnosis codes, but by aggregating similar diagnoses, the PheWAS captures even more related codes, heightening the already large prevalence of respiratory in-fections. The original ICD-9 codes can be aggregated at a slightly higher level in ICD-9 code groups (Hierarchical Condition Codes or HCCs, 3-2), where it is still clear that respiratory illnesses dominate other outpatient diagnoses. One major issue with this aggregation is the presence of ambiguous groups like "780-789: Symptoms": this group includes symptoms of many different organ systems that may have no functional relation to each other. The PheWAS codes are more specific, not grouping all respiratory diseases at this level, but less ambiguous, as symptoms are grouped with a corresponding disease. PheWAS codes themselves can be aggregated into 18 categories at the highest, least specific level. While respiratory illness remains high throughout the years, categories like digestive system illness are not far behind.
Figure 3-2: Top 15 ICD-9 (HCC) groups, Outpatient diagnoses 2000-2012
Code Range Frequency
460-466: Acute respiratory infections 54393463
780-789: Symptoms 19954595
520-529: Diseases of oral cavity, salivary glands, and jaws 17628063 360-379: Disorders of the eye and adnexa 13800144 401-405: Hypertensive disease 11404753 530-537: Diseases of esophagus, stomach, and duodenum 10683380 720-724: Dorsopathies 7399809 249-259: Diseases of other endocrine glands 6842291 690-698: Other inflammatory conditions of skin and 6777811 subcutaneous tissue
710-719: Arthropathies and related disorders 6721825 470-478: Other diseases of the upper respiratory tract 6647497 725-729: Rheumatism, excluding the back 6630685 270-279: Other metabolic and immunity disorders 6529154 300-316: Neurotic, personality, and other nonpsychotic 5480604 mental disorders
617-629: Other disorders of female genital tract 5049707 Table 3.2: ICD-9 top 15 code groups, outpatient diagnoses 2000-2012
Figure 3-3: Top 15 PheWAS codes, Outpatient diagnoses 2000-2012
PheWAS code Frequency
465: Acute upper respiratory infections of multiple or 28713713 unspecified sites
483: Acute bronchitis and bronchiolitis 8634657 401.1: Essential hypertension 8399722 521.1: Dental caries 6831587 464: Acute sinusitis 5886825 250.2: Diabetes mellitus type 2 4937451 474.1: Acute tonsilitis 4424112 939: Atopic/contact dermatitis due to other or unspecified 4366584 465.4: Acute laryngitis and tracheitis 3486007 564: Functional digestive disorders 3307620 476: Allergic rhinitis 3283876 465.2: Acute pharyngitis 3274851
760: Back pain 2792472
558: Noninfectious gastroenteritis 2740514 401.21: Hypertensive heart disease 2722687
Figure 3-4: PheWAS categories, outpatient diagnoses 2000-2012
3.1.2 Inpatient
Inpatient admissions might be expected to include more emergency services and in-tense, acute care but less chronic diseases than in outpatient visits. Similar analysis was done for inpatient records in table 3.5 and figure 3-5. There are far fewer inpa-tient admissions than outpainpa-tient visits overall. The most common inpainpa-tient diagnosis, "401.9: Essential hypertension, unspecified," is also the third most frequent outpa-tient billing code: it grows over the years in both settings, but its growth appears far more drastic in the inpatient settings, where its frequency jumps 7-fold in the twelve-year period. Otherwise, inpatient diagnoses seem very different from outpatient ones: the rest of the top 15 codes do not overlap. There may be different common code groups in the inpatient setting observed when aggregating billing codes, or consid-ering comorbidities. For example, codes 650 and V27 both relate to pregnancy: the former, related to pregnancy complications, was the most common inpatient billing code in the year 2000 but decreased afterwards, stabilizing just under its original frequency.
Figure 3-5: Top 15 most coded inpatient diagnoses, 2000-2012
Table 3.4: Top 15 inpatient diagnoses, 2000-2012
Diagnosis (ICD9-CM) Frequency
401.9: Essential hypertension, unspecified 103026 650: Other current conditions classifiable elsewhere in the mother 73065 but complicating pregnancy
599.0: Urinary tract infection, site not specified 56631 486: Pneumonia, organism unspecified 53829 V58.1: Encounter for chemotherapy 42903 558.9: Other and unspecified noninfectious gastroenteritis and 32028 colitis
485: Bronchopneumonia, organism unspecified 31469 414.01: Coronary atherosclerosis of native coronary artery 24733 592.1: Calculus of ureter 22734 272.4: Other and unspecified hyperlipidemia 22697 402.90: Unspecified hypertensive heart disease without congestive 22059 heart failure
518.81: Acute respiratory failure 20916 V27: Outcome of delivery single liveborn 20569 285.9: Anemia, unspecified 20408 428: Congestive heart failure 19831
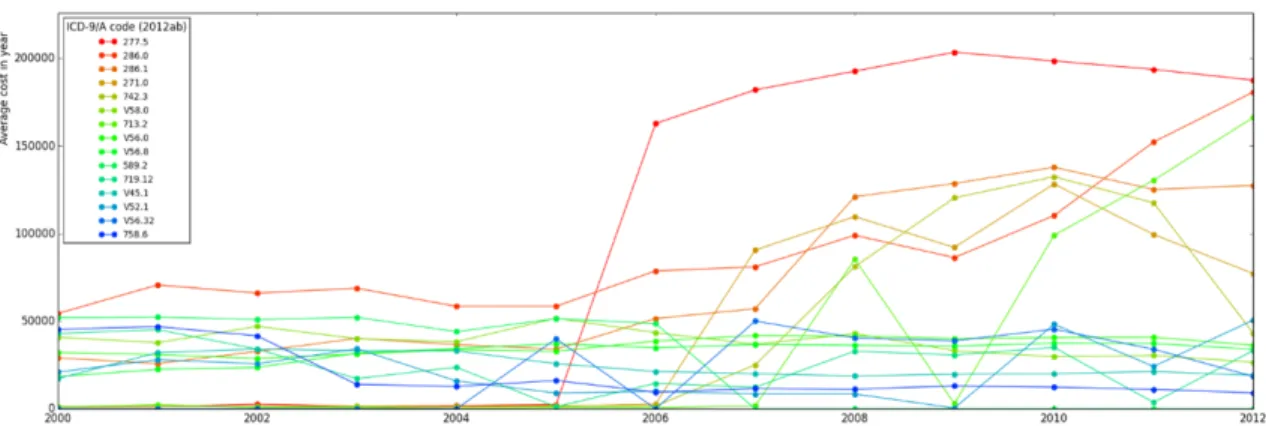
Figure 3-6: Top 15 most expensive outpatient billing codes on average, 2000-2012
3.2 Expenses
The diagnosis codes are primarily intended for billing purposes; thus there is concern that, in cases where billing codes are somewhat ambiguous for a given disease phe-notype, physicians could choose codes that will qualify for higher reimbursements. Taiwan has experimented with various policies surrounding reimbursement, aiming for approximately even levels for equivalent treatment. Since we have data on treat-ment costs and the amount reimbursed (in Taiwan new dollars- NT$), it would be informative to see which codes account for the highest costs, and whether those ap-pear unusually frequently. Since outpatient visits far outweigh inpatient admissions, we focused on outpatient diagnoses and their average cost (figure 3-6). The most frequently billed code group is not the most reimbursed: codes in the 460-519 group for respiratory illness do not appear in the list in table 3.4.
Supplementary codes (prefaced with the letter "V"), especially codes for "persons encountering health services for specific procedures and aftercare" (V50-59), were disproportionately represented. For this group, the specific description of each indi-vidual code is more informative (see table 3.4). Other high-cost codes fall into the categories of blood diseases (280-289) and metabolic and immunity disorders (270-279): the high-cost codes themselves seem rare in the NHIRD, though they belong to some of the more frequently observed code categories. There was not much of a correlation between billing frequency and reimbursement, but future analyses would need to account for multiple codes in the same visit, procedures, medications, and
Table 3.5: Top 15 expensive outpatient billing codes, 2000-2012 Diagnosis (ICD9-CM) Average Cost (NT$) 277.5: Mucopolysaccharidosis 1332479.68 286.0: Congenital factor VIII disorder 1165922.80 286.1: Congenital factor IX disorder 947910.18 271.0: Glycogenosis 607634.86 742.3: Congenital hydrocephalus 530229.14 V58.0: Encounter for radiotherapy 498878.08 713.2: Arthropathy associated with 492414.79 hematological disorders
V56.0: Encounter for extracorporeal dialysis 469869.77 V56.8: Encounter for other dialysis 420543.32 589.2: * invalid ICD-9 code. 351768.05 589 = small kidney of unknown cause
719.12: Hemarthrosis, upper arm 326904.76 V45.1: Postsurgical renal dialysis status 315804.87 V52.1: Fitting and adjustment of artificial leg 284250.40 V56.32: Encounter for adequacy testing for 267355.11 peritoneal dialysis
Chapter 4
Pipeline
An infrastructure was required to enable more systematic analysis. A rough schematic is shown in 4-1.
4.1 Database preprocessing (PostgreSQL)
As mentioned in section 1.1.3, we made some modifications to working copies of database tables to speed up queries. The orders tables did not contain the unique ID of the patient who was prescribed the drug, but the record in this table could be cross-referenced with the corresponding patient visit in the visits tables based on six columns. We joined the orders and visits tables on these fields with queries like:
SELECT (id, id_sex, id_birthday, drug_amt, icd9cm_code, ... ) INTO dddo96_03 FROM dd1996_2003
LEFT OUTER JOIN do USING
(fee_ym, appl_type, hosp_id, case_type, seq_no, appl_date);
We created indices on both the original and combined tables. Indices on the outpa-tient tables took up a large amount of disk space. Indices on the single outpaoutpa-tient orders tables (oo) were 42GB, 30GB, and <1GB for the different partitions, compa-rable to the size of the original tables themselves. Indices on this table joined with records from the visits tables were of similar sizes. Yet, queries in the new database
Figure 4-1: Pipeline
with these indices took anywhere from 1/3 to 1/10 of the time that it took on the orig-inal unmodified database. The inpatient tables were small enough such that queries could run relatively quickly without indices. In both inpatient and outpatient set-tings, the tables we created combining diagnosis and prescription information sped up our overall analysis significantly.
4.2 Querying pipeline (Python)
We attempted to separate code for related tasks into Python modules, for future reusability. The ref module contained our reference lookup dictionaries for things
like Taiwanese prescription code to ATC code matching, or diagnosis phenotype ag-gregation (both mentioned in chapter 2). Files in the db module handled database connection, storing connection parameters as well as table/ column names for inpa-tient and outpainpa-tient visits and orders tables. Rather than typing out multiple SQL select statements in Postgres and waiting for each query to finish, or running a bash script of SQL queries and attempting to parse the output, we directly triggered de-sired queries from Python using the psycopg2 module. In the queries module we wrote functions to handle common queries for selecting medical events for a given patient; medical events across all patients matching characteristics like time, diagnoses, or prescriptions; obtaining the demographic information for a patient; and more. Files in the explore module were used to perform analyses like those detailed in chapter 3. Finally, functions for plotting graphs of results, heavily relying on the matplotlib package, are in the plot module.
4.3 Further analyses (Python, MATLAB)
In the data imputation attempts discussed in chapter 6, we tested methods developed by other researchers. Many of their toolboxes were written in MATLAB, so our use of those toolboxes was also done in MATLAB. The output csv files could then be read in Python to evaluate accuracy of the original imputation method.
Chapter 5
Medication Side Effects
A potential application of this claims data is the early detection of side effects. We started by looking at examples of known side effects confirmed by clinical trial. In particular, we looked at rofecoxib (Vioxx), a drug for pain relief manufactured by Merck, widely used until it was recalled in 2004. We examined relative risk as did the VIGOR trial, but also comparing age and gender. We applied this procedure and other methods for detecting potential side effects in classes of diabetes drugs.
5.1 Known side effect: rofecoxib and MI
Rofecoxib was a NSAID (nonsteroidal anti-inflammatory drug) used to treat acute pain: as a selective COX-2 inhibitor, it could target the enzyme isoform COX-2 re-sponsible for pain and inflammation but avoid the isoform COX-1 needed to protect the stomach lining. Thus, it was hoped to have lower gastrointestinal side effects than other pain relief drugs. Merck conducted the VIGOR (Vioxx Gastrointestinal Outcomes Research) clinical trial to confirm Vioxx’s superior gastrointestinal out-comes compared to a standard pain relief drug, naproxen (Aleve), used as a control. However, the same VIGOR trial found a higher risk of myocardial infarction (MI, heart attack) associated with rofecoxib than the control naproxen. [10]
5.1.1 Rofecoxib codes and dosage frequency
Merck was maligned for mishandling the results and hiding evidence prior to the recall, yet the trial itself focused on an older population with rheumatoid arthritis taking the highest allowed therapeutic dose of rofecoxib (50 mg). It is not immediately clear from the clinical trial alone whether the observed side effect would apply to other demographics. The Taiwanese population is more homogeneous in some dimensions than the American one, and the NHIRD is fairly comprehensive during the time frame. Thus, the NHIRD would serve as an interesting case study for this side effect.
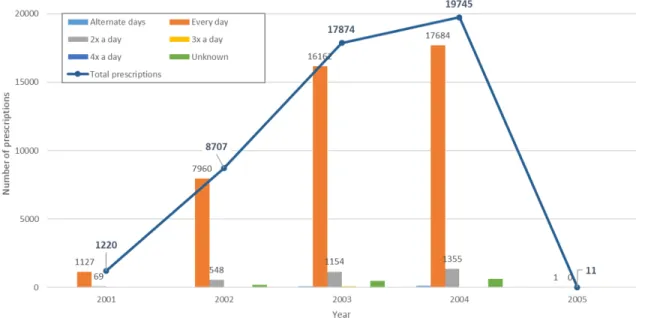
The ATC code for rofecoxib is M01AH02. Two Taiwanese prescription codes map to this ATC code: B023113100 ("VIOXX TAB. 25MG") and B023490100 ("VIOXX TABLETS 50MG"). The first code for rofecoxib (25 mg tablets) is only prescribed from 2001-2005. However, the second of these prescription codes, for the dose at 50 mg, is never used in the database. The lack of the 50 mg dose of Vioxx in the dataset makes it difficult to compare directly to the VIGOR trial where subjects took the maximum 50 mg dose daily. Still, if patients took the 25 mg tablets twice daily, it would be equivalent to the daily 50 mg dose and roughly comparable. There is drug dosage frequency information embedded in the database, where doctors prescribe with abbreviations like "QD" for every day, "BID" for twice a day, and others.
Figure 5-1 shows the count of outpatient prescriptions of rofecoxib in the database for each year it was prescribed from 2001 to 2005, along with information on dosage frequency for abbreviations that we could translate (the ones we could not disam-biguate, or ones that coded for variable, "as-needed" dosages, are listed as "Un-known"). The vast majority (42934/47557 or about 90%) of all prescriptions are prescribed to be taken once a day. A remaining 6.6% (3126) are coded to be taken twice a day. 201 are for every alternate day, 147 are to be taken 3x or 4x a day, and 1350 are "unknown" or of variable dosage.
Figure 5-1: Rofecoxib outpatient prescription frequency
5.1.2 Myocardial infarctions
Although myocardial infarction (heart attack) is considered an acute event likely to be treated in an inpatient setting, many heart attacks may go undetected at the time, and some may be recorded later in an outpatient setting. Thus, we consider both inpatient and outpatient occurrence of myocardial infarction.
The total number of patients that had experienced myocardial infarction (ICD-9 code 410.* with any precision after the decimal point) was relatively low in the Taiwanese database. 5871 unique patients experienced a heart attack in the inpatient records. 6660 patients were diagnosed as having had a heart attack in their outpatient records, but there is some overlap between the inpatients and outpatients: the total number of unique patients with heart attacks anywhere in their history is 9293. Figure 5-2 shows the number of new patients with heart attacks in each year. Figure 5-3 also displays each patient’s first instance of a heart attack, grouped by age, and stacked by gender: more males had heart attacks than females in the population, and females seem to have their first heart attack at a slightly older age than do males.
Figure 5-2: Myocardial infarction incidence
Figure 5-4: Myocardial infarction medications
5.1.3 Rofecoxib vs. Naproxen
While we compared rofecoxib to naproxen like the VIGOR trial, we did not limit our analysis to patients with rheumatoid arthritis in a certain age range, or rofecoxib users on a 50 mg daily dose. We did exclude any patients that had myocardial infarction before taking either drug, as well as patients prescribed both drugs.
Figure 5-4 shows age and gender distributions for users of each drug, with or with-out a subsequent heart attack. Table 5.1 shows relative risks of myocardial infarction after being prescribed each drug, calculated as (Number of patients prescribed a drug and afterwards experiencing myocardial infarction) divided by (Total number of pa-tients prescribed the drug).
5.2 Demographics adjustment
The risk table 5.1 makes the relative increased risk of myocardial infarction unclear: while the difference is high for all users, it is smaller in the age 40-59 group and almost
Table 5.1: MI risk Vioxx vs. Naproxen
MI/(MI + No MI) Rofecoxib Naproxen Overall MI All Users 4.62 % 0.86 % 0.93 % Ages 40-59 3.10 % 1.30 % Total 3154 Ages 60-79 4.72 % 4.11 % Total 4294 Male 6.17 % 1.17 % 1.24 % Female 3.73 % 0.61 % 0.63 %
disappears in the age 60-79 group. More work needs to be done to control for these demographic variables, as well as other aspects of patient history.
5.3 Type 2 Diabetes
Type 2 diabetes (T2DM) is a growing public health issue worldwide, especially in Taiwan. While T2DM can be associated with complications that require treatment in an inpatient setting, as a chronic disease it is often diagnosed and treated in outpatient visits. Figure 5-5 shows the number of new outpatients diagnosed with diabetes per year, from 1996 to 2012, totaling 138,720 patients. Figure 5-6 shows the distribution of the age of onset. T2DM is an adult onset disease, and the distribution is centered around ages 50-55.
5.3.1 Classes of diabetes drugs
While Type 1 Diabetes is defined by a lack of insulin production and can be treated with insulin injections, Type 2 is characterized by insulin resistance and requires oral drugs to treat. Major drugs used to treat T2DM include metformin, sulfonylureas, alpha-glucosidase inhibitors, thiazolidinediones, glinides, and DPP-4 inhibitors. There are 567 Taiwanese codes for these blood glucose-lowering drugs (ATC codes starting with "A10B"). Some drug classes have many corresponding Taiwanese codes; less common or newer drugs like DPP-4 inhibitors have fewer Taiwanese codes, some-times none for the corresponding ATC code. The actual numbers are shown in A.2.
Figure 5-5: Diabetes over time
The usage of these various types of treatment in Taiwan was studied in 2012 [9]. That study found that metformin and sulfonylurea-based treatments have accounted for the majority of prescriptions. However, other oral drug categories (glinides, alpha-glucosidase inhibitors) grew in prescription usage throughout the 2000s. DPP-4 in-hibitors are not substantially represented in the dataset before 2009, perhaps because it was not reimbursed until 2009. Prescriptions for thiazolinediones grew until a peak in 2004, and then started to decrease as data pointed to risk of serious side effects such as congestive heart failure (CHF) for rosiglitazone. These trends applied both for the drugs in monotherapy and as part of a combination therapy.
5.3.2 Thiazolinedione side effects
Though research has pointed to serious potential side effects associated with thiazo-linediones, in particular rosiglitazone, the drug has not been officially recalled from the market [11]. We attempted to investigate potential side effects of the drug in our data by looking at potential comorbidities.
From a set of 230 diabetic patients prescribed rosiglitazone, we focused on the most common ICD-9 codes (at the three-digit level) for the following 24 months after their prescription, considering each month as a bin. It was hoped that this would limit the number of variables in our dataset and the sparsity to a more manageable number, while also eliminating more spurious trends and focusing on the associations more likely to be truly associated with diabetes. We aggregated this over the population of patients, and repeated the procedure for patients prescribed pioglitazone. We excluded patients taking both drugs, but we did not have time to exclude those on other classes of diabetes drugs.
Figure 5-7 and appendix table A.3 showed a rather similar profile for users of both drugs. Users of both drugs have the same top 8 most frequent diagnoses, including (unsurprisingly) code 250: Diabetes mellitus, but also various other expected comor-bidities like 272: Disorders of lipoid metabolism and 401: Essential hypertension. Others are observed in such a low percent of cases that it is dangerous to draw any conclusions from these numbers alone.
Figure 5-7: Diagnoses after thiazolinedione prescription: (left) rosiglitazone, or (right) pioglitazone. Codes in the legends are described in appendix A.3.
Individual patient matrices from this cohort were also used for analysis in the following chapter.
Chapter 6
Individual Patient Medical History
So far, data exploration and analysis has been done primarily in aggregate, looking at patient medical history on a population scale. Analysis on the individual patient level could help generate more meaningful clinical results. There are different possible ways to study change in a patient’s disease state over time. Lasko proposes treating the data as streams of events, using MCMC methods to model parameters [12]. On the other hand, many clinical phenotyping methods require conversion of patient medical history to a matrix [13].
ICD-9 and ATC codes do not tell the full story, but they can be signs of a clinically meaningful patient phenotype. A clinical phenotype can be defined by a combination of diagnoses and medications that may co-occur in a patient or group of patients; each feature’s presence may have a different contribution to the overall clinical phe-notype. As in the construction of PheWAS [7], these phenotypes can be determined using unsupervised methods and then refined with existing medical knowledge, but the resulting phenotypes should be interpretable. With a matrix of patient medical history, methods involving matrix factorization can identify distinct and clinically relevant phenotypes.
Figure 6-1: Schematic to make matrix
6.1 Matrix Representation
A patient’s medical history of discrete events can be converted into a longitudinal matrix as in figure 6-1. The variables are medical events measured across the dimen-sion of time; binary data indicate whether the event was observed at a given time. If medical events are rows and times are columns, the value at row 𝑖 and column 𝑗 in such a matrix will be 1 if the event 𝑖 is observed at time 𝑗, and 0 otherwise.
A longitudinal patient matrix constructed this way is often sparse and noisy in practice, with more possible variables and timesteps than observed events. There are many possible medical events: 14428 ICD-9 codes and over 28 thousand Taiwanese prescription codes (see chapter 2). Yet only a few events can be coded on a given visit (in the NHIRD, a maximum of 3 diagnosis codes are present in each record for outpatient visits, and 4 codes for inpatient admissions). Data may be missing due to irregular patient visits, and billing codes may be an incomplete representation of the patient’s medical state. Thus, the presence of a 0 in the matrix is not the same as a negative result: more precisely, it may be missing data. In the case of diagnoses, data could be missing in dates between visits, because the patient’s state between visits is not known, or even in a visit’s record, if the physician does not encode all applicable diagnosis codes in the billing process. Treating all these values as 0s could cause inaccurate results in predictive tasks. It is possible to simply ignore missing values, deleting all instances that have them, but this could remove far too much of our data, losing valuable information and introducing bias.
6.2 Data Imputation
Rather than ignoring missing data, we can replace it with imputed values. We tested methods designed to impute continuous data, but the original data in our binary matrices could only take on a value of 0 or 1. The imputed values could be any value-most were decimals between 0 and 1, but some were outside those bounds. We did not round the values during imputation, but when it came time to compare accuracy to the original binary values, we treated an imputed value as a 0 if it was less than 0.5, and as a 1 if it was greater than or equal to 0.5. Alternate analysis could compare to the original imputed value directly, without rounding, for a measure of uncertainty. Another possible way to repeat this analysis would be to use larger time bins and add the events in a time window, such that the values could be bigger than 1, perhaps making continuous imputation methods more valuable.
The methods could impute on simple, predictable patterns when full time points were removed, so we tested them on more representatively complex patterns, but still on relatively dense patient matrices, with some percent of the values removed at random.
6.2.1 Standard methods
Single imputation methods consider each variable on its own. They can replace each missing value with a single value, such as the mean of the entire row, or a function of neighboring values (k-Nearest Neighbor based). We include the following simple control methods.
∙ AVG: row average - average value of observed feature over time
∙ LOCF: Last observation carry forward
Table 6.1: Method accuracy
% Missing Values AVG LOCF NOCB FLk-NN 10 % 77.5 % 72.4 % 82.5 % 70.0 % 25 % 78.1 % 82.2 % 80.2 % 85.4 % 50 % 80.0 % 83.7 % 78.4 % 78.9 % 75 % 82.6 % 77.1 % 78.1 % 69.8 % 90 % 79.0 % 76.4 % 75.6 % 67.5 %
6.2.2 Advanced methods in literature
Multiple imputation methods consider how different variables are related. Some meth-ods in the literature use sophisticated models and machine learning techniques, but they can be computationally expensive, infeasible for our large data size. We isolated a few recently published methods that claimed to work on large datasets. For in-stance, FLk-NN (Fourier-lagged correlation/ k-Nearest Neighbors) extends k-Nearest Neighbors and a Fourier transform to allow for missing data imputation even when all of the data at a time point is missing, and it was found to work well for up to half the data missing [14]. Though it was tested on synthetic medical data, it was not tested for datasets as sparse as ours, nor on binary data.
One might expect the methods to be less accurate on more sparse matrices. How-ever, that is not uniformly the case, as seen in table 6.1. Accuracy only steadily decreases for the NOCB method; other methods’ accuracies increase before they de-crease, and FLk-NN’s accuracy peaks at 85.4% accuracy with 25% sparsity. After that, it decreases fairly sharply. At extreme levels of sparsity (75% and 90%), where FLk-NN was not tested, its performance drops off sharply below even the most basic methods, whereas the simpler imputation methods perform fairly well. One issue is that in sparse binary matrices, the values are likely to be zero most of the time, which could lead to artificially high performance of simple methods that are biased towards zero.
The theory behind FLk-NN relies on variables being highly correlated, but those correlations being seen after a time lag. While time lags may apply with ICD-9 codes,
the time between our visits is not as granular as that observed in the continuous data tested by FLk-NN, so the lagged correlation analysis may be less valuable. Advanced imputation methods like FLk-NN may be unnecessary for binary data, but perhaps they will be more useful with more dense or aggregated variables.
Chapter 7
Conclusion
A major caveat in interpreting results from any retrospective, observational study is the oft-quoted "correlation is not causation." With such broad-scale multiple hy-pothesis testing, it is easy to find spurious correlations, and very difficult to control for alternate contributing factors. Nevertheless, results from these studies could have immense value in identifying potential research questions for future clinical trials. When powered by large and comprehensive data, these analyses can still inform clin-ical practice in meaningful ways.
7.1 Results
We accomplished our initial goals of broadly exploring the database and developing an infrastructure for further analysis. We were able to perform some specific analyses on drug side effects, looking at certain demographic variables such as age and gender. While we could weakly confirm rofecoxib’s increased risk of myocardial infarction, it is not clear if the effects would be observed in all age groups. We were also able to test imputation methods on individual patient matrices and found that advanced methods were of limited use compared to baseline single imputation methods in highly sparse matrices, though generalization of these results may be limited.
7.2 Future Work
Far more work could be done in any one of the areas discussed in this thesis. More sophisticated models could be used to account for demographic variables and past patient medical history.
While we created lookup dictionaries to perform conversions between database area codes and higher-level district groupings in Taiwan, more research could be done on geographic effects. We have not yet delved into non-prescription orders such as procedures, for which there are also international coding systems.
Some of the methods discussed and tested in this thesis were not originally de-signed for claims data, and the binary, discrete nature may break theoretical assump-tions behind those individual methods. In the case of imputation methods, there is likely not a "one-size-fits-all" approach, and while advanced methods like FLk-NN could be helpful for many analyses, in our cases simpler imputation methods will work just as well, sometimes better. Perhaps supervised medical knowledge could help determine the best methods to model different diseases. Chronic diseases will probably have different patterns than acute ones: conditions like infectious diseases are probably intermittently observed, while others like diabetes may persist for the patient’s entire lifetime. It is unclear whether one of the existing models could work equally well for such different diseases.
Now that we have successfully converted patient medical history to matrices, we still need to test computational phenotyping methods. The scale at which to aggregate each dimension is not always clear, and will likely vary based on the research question and input data.
Computational power and flexibility of data transfer would be useful for further analysis with this dataset. The indices created aid significantly in query speed, but they take up about half the disk space of the original table. More advanced distributed data processing capabilities do exist but are still somewhat fresh, raising questions about data security- particularly important for medical data, which is considered sensitive data. Perhaps in the future, as these technologies mature and become more
widely accepted in the international research community, this will no longer be an issue.
Another interesting possibility would be to integrate other data sources, whether EHRs, labs, genetics, or other registries. Health is affected by many other factors, and even sources outside of medicine, like economic status of certain area codes, could be useful in answering questions like whether poorer regions have different healthcare resource utilization patterns. Each data source has unique advantages, disadvantages, and quirks when being analyzed in practice. Combining many of these data sources could reduce error and variation in one source of data while multiplying predictive power.
7.3 Summary
We have shown that claims data analyzed on its own can be informative for a range of clinical questions, and we have implemented procedures to answer such questions with the Taiwanese NHIRD. New methods are constantly being developed to analyze a wide range of data, and the comprehensiveness of the NHIRD will make it an attractive target for such methods. The approaches mentioned in this thesis have already revealed information about healthcare usage in Taiwan; while not every new method will be easily applied to this data, carefully chosen methods that can handle highly variable data with many variables will be immensely helpful in clinical practice and understanding healthcare systems.
Appendix A
Tables
Table A.1: Database table statistics
Table Size # Records
cd: outpatient descriptions; expenditures by visit 67 GB 222731171 1996-2003 (896993 unique patients) 28 GB 91859384 2004-2011 (991748 unique patients) 34 GB 114989634 2012 (911707 unique patients) 4875 MB 15882153 oo: outpatient orders (incl. prescribed drugs) 136 GB 977236050
1996-2006 70 GB 516721736
2007-2011 52 GB 370065189
2012 14 GB 90449125
dd: inpatient descriptions; expenditures by admission 1 GB 1601526
1996-2003 328 MB 593402
2004-2006 148 MB 273298
2007-2011 331 MB 599036
2012 76 MB 135790
do: inpatient orders; details for patients in dd 12 GB 82893105
1996-2006 5127 MB 36997756
2007-2009 2521 MB 18208966
2010-2011 2543 MB 18379541
2012 1808 MB 9306842
gd: descriptions for prescriptions dispensed at 9 GB 29775886 contracted pharmacies 1996-1998 81 MB 280733 1999-2003 1391 MB 4471525 2004-2009 4930 MB 15773151 2010-2011 1940 MB 6073626 2012 1034 MB 3176851
go: pharmaceutical orders 16 GB 113040864
1996-2006 6726 MB 50569379
2007-2011 7053 MB 49705791
2012 1897 MB 12765694
id: demographic information for each patient 2 GB 14571807
1996-2009 1578 MB 11570989
Table A.2: Diabetes drugs and ATC codes
Diabetes Treatments ATC Codes Taiwanese Codes Insulins and Analogues A10A 118 codes
Blood glucose-lowering drugs A10B 567 codes (excluding insulins)
Biguanides A10BA 153 codes - Metformin - 02 151 codes
- Buformin - 03 2 codes
Sulfonylureas (incl. Glimepiride) A10BB 248 codes - 01-12, 31
Glymidine (a heterocyclic sulfonamide) A10BC01 None Alpha-glucosidase inhibitors A10BF 43 codes
- 01, 02, 03 - 39, 4, 0 Thiazolidinediones: A10BG 52 codes - Rosiglitazone - A10BG02 - 14 codes - Pioglitazone - A10BG03 - 38 codes DPP-4 inhibitors A10BH [01-06, 51] 5 codes:
- 01 (Januvia) - B024668100 - 02 - B025306100 - 03 - B025220100,
B025221100 - 05 - B025537100
Table A.3: Most frequent ICD-9 codes after thiazolidinedione prescription ICD-9 Code Rosiglitazone
(%) Pioglitazone(%) Ros./Pio. 250: Diabetes mellitus 21.22 23.49 0.90 272: Disorders of lipoid metabolism 7.48 8.73 0.86
274: Gout 0.56 1.19 0.47
300: Anxiety, dissociative and
somato-form disorders 0.83 0.65 1.27 362: Other retinal disorders 1.06 0.66 1.61 366: Cataract 0.91 0.71 1.28 372: Disorders of conjunctiva 1.09 0.91 1.20 401: Essential Hypertension 8.68 8.89 0.98 402: Hypertensive heart disease 3.36 3.40 0.99 414: Other forms of chronic ischemic
heart disease 2.67 2.65 1.01 434: Occlusion of cerebral arteries 1.52 0.77 1.99 438: Late effects of cerebrovascular
dis-ease 1.11 0.11 9.81
465: Acute upper respiratory infections
of multiple or unspecified sites 2.23 2.07 1.08 533: Peptic ulcer, site unspecified 0.66 1.04 0.63 564: Functional digestive disorders, not
elsewhere classified 1.15 0.84 1.37 571: Chronic liver disease and cirrhosis 1.41 0.82 1.72 585: Chronic kidney disease (CKD) 1.47 0.55 2.67 715: Osteoarthrosis and allied
disor-ders 2.03 1.58 1.29
721: Spondylosis and allied disorders 1.21 0.85 1.43 724: Other and unspecified disorders of
back 1.19 1.56 0.76
726: Peripheral enthesopathies and
al-lied syndromes 1.15 0.88 1.30 729: Other disorders of soft tissues 0.68 0.93 0.72 780: General symptoms 2.96 1.98 1.50 784: Symptoms involving head and
neck 0.97 0.94 1.03
786: Symptoms involving respiratory
Bibliography
[1] Yao-Chun Hsu, "Analyzing Taiwan’s National Health Insurance Research Database to explicate the allocation of health-care resources." Advances in Di-gestive Medicine (2015) 2, 41–43. doi:10.1016/j.aidm.2015.04.001
[2] Ming-Chia Hsieh, Tzu-Chi Lee, Shu-Min Cheng, Shih-Te Tu, Ming-Hong Yen, and Chin-Hsiao Tseng, "The Influence of Type 2 Diabetes and Glucose-Lowering Therapies on Cancer Risk in the Taiwanese," Experimental Diabetes Research, vol. 2012, Article ID 413782, 6 pages, 2012. doi:10.1155/2012/413782.
[3] Nicole Huang, Yiing-Jenq Chou, Long-Shen Chen, Cheng-Hua Lee, Pen-Jen Wang, and Jen-Huoy Tsay, "Utilization of Western Medicine and Traditional Chinese Medicine Services by Physicians and Their Relatives: The Role of Train-ing Background," Evidence-Based Complementary and Alternative Medicine, vol. 2011, Article ID 827979, 7 pages, 2011. doi:10.1093/ecam/nep094.
[4] Hsu JC, Lu CY. The evolution of Taiwan’s National Health Insurance drug re-imbursement scheme. DARU Journal of Pharmaceutical Sciences. 2015;23(1):15. doi:10.1186/s40199-014-0080-7.
[5] Ya-Ming Liu, Yea-Huei Kao Yang, Chee-Ruey Hsieh, "Financial incen-tives and physicians’ prescription decisions on the choice between brand-name and generic drugs: Evidence from Taiwan," Journal of Health Eco-nomics, Volume 28, Issue 2, March 2009, Pages 341-349, ISSN 0167-6296, doi:10.1016/j.jhealeco.2008.10.009.
[6] Wu CS, Lai MS, Gau SSF, Wang SC, Tsai HJ (2014) "Concordance be-tween Patient Self-Reports and Claims Data on Clinical Diagnoses, Medication Use, and Health System Utilization in Taiwan." PLoS ONE 9(12): e112257. doi:10.1371/journal.pone.0112257.
[7] Denny JC, Bastarache L, Ritchie MD et al. "Systematic comparison of phenome-wide association study of electronic medical record data and genome-phenome-wide asso-ciation study data." Nat Biotechnol. 2013 Dec; 31(12):1102-10.
[8] "ATC Structure and principles." WHO Collaborating Centre for Drug Statistics Methodology. http://www.whocc.no/atc/structure_and_principles/
[9] Chia-Hsuin Chang, Yi-Der Jiang, Ching-Hu Chung, Low-Tone Ho, Lee-Ming Chuang, "National trends in anti-diabetic treatment in Tai-wan," 2000-2009, Journal of the Formosan Medical Association, Vol-ume 111, Issue 11, November 2012, Pages 617-624, ISSN 0929-6646, http://dx.doi.org/10.1016/j.jfma.2012.09.009.
[10] Bombardier, Claire et al. "Comparison of Upper Gastrointestinal Toxic-ity of Rofecoxib and Naproxen in Patients with Rheumatoid Arthritis." New England Journal of Medicine; 343:1520-1528, November 23, 2000. doi: 10.1056/NEJM200011233432103.
[11] Rizos, CV; Elisaf, M; Mikhailidis, DP; Liberopoulous, EN. "How safe is the use of thiazolidinediones in clinical practice?" Expert Opinion on Drug Safety, 8:1. 25 Nov 2008. doi:10.1517/14740330802597821.
[12] Lasko, Thomas A. "Efficient Inference of Gaussian-Process-Modulated Renewal Processes with Application to Medical Event Data." Cornell University Library, 19 Feb 2014. arXiv:1402.4732 [stat.ML].
[13] Jiayu Zhou, Fei Wang, Jianying Hu, and Jieping Ye. 2014. "From micro to macro: data driven phenotyping by densification of longitudinal electronic med-ical records." In Proceedings of the 20th ACM SIGKDD international conference on Knowledge discovery and data mining (KDD ’14). ACM, New York, NY, USA, 135-144. doi:10.1145/2623330.2623711
[14] Rahman, S.A.; Yuxiao Huang; Claassen, J.; Kleinberg, S., "Imputation of Miss-ing Values in Time Series with Lagged Correlations," Data MinMiss-ing Workshop (ICDMW), 2014 IEEE International Conference, pp.753-762, 14 Dec. 2014. doi:10.1109/ICDMW.2014.110.