Supporting collaborative design and project management for
AEC using Speckle’s interactive data flow diagram
1ST PAUL POINET1, 2ND DIMITRIE STEFANESCU1, 3RD GEORGIOS TSAKIRIDIS2, AURELIE DE BOISSIEU2, ELENI PAPADONIKOLAKI1
1University College London - Bartlett School of Construction and Project Management, London, United Kingdom. 2Grimshaw Architects, London, United Kingdom.
1[email protected], 2[email protected]
Fig. 1. The interactive data flow diagram in Speckle. Here, each cluster represents a software environment from which data has been sent to – or received from – another software document through the respective Speckle clients. The square nodes represent the shared Speckle data streams which can be accessed
by the users belonging to the same Speckle project.
ABSTRACT.
Recent advances in architectural geometry and the rising ubiquity of design computation and Visual Programming (VP) amongst architecture practices has led to the design and construction of more complex, larger scale architectural projects. Consequently, the Architecture, Engineering and Construction (AEC) industry has witnessed the emergence of custom technological solutions tailored within some of the most progressive architecture practices to better understand and visualize complex digital design workflows. Although very relevant, such existing solutions have always been developed in isolation to solve particular design problems related to the conception and construction of a specific building project. Based on this observation, the open-source data platform for AEC called
Speckle has been developed in order to bring more transparency in the
design process, enabling multiple stakeholders working from different software environments to seamlessly communicate through its web interface. The present paper both introduces the platform and describes an interactive data flow diagram – named SpeckleViz – built upon it to support in a user friendly manner transparent collaborative design, project management and version control for AEC. This will be illustrated through two selected case studies.
KEYWORDS
Project Management, Version Control, Data Flow, Activity Network
1. INTRODUCTION
From De Vries’ Activity Network [de Vries 1995], the discretization of logic through “staging” introduced by Front Inc. [Van der Heijden et al. 2015], the Metagraph developed by Woods Bagot [Ringley 2017], to Sacks’ process models integrating material and informational flows
[Sacks et al. 2002], these different approaches commonly address the visualization of the design workflow at the global level – across multiple users and/or documents, in contrast with the more local input-output data flow within a single Visual Programming (VP) file, such as Grasshopper [Grasshopper 2020] or Dynamo [Dynamo 2020]. Although these methods have proved to be very successful at solving specific in-house computational design problems, they have been developed in isolation and their resulted Activity Network Diagrams (AND) have served primarily as visualization tools. Indeed, both the De Vries’ Activity Network or the Metagraph from Woods Bagot could only be used to visualize the data flow but lacked interactive capabilities that could enable the end-user to interface with the AND itself by analysing the data exchanged within a specific time range or under user-defined metadata. The interactive data flow diagram SpeckleViz [SpeckleViz 2020] augments the above-mentioned attempts to visualize the data exchanges and activity/social networks occurring during the design process through the implementation of custom interaction features to directly manage and interface with the shared data streams. As SpeckleViz leverages the open-source AEC data platform Speckle [Speckle 2020], it also brings more transparency in the design process than the previously mentioned methods.
This paper demonstrates the interactive, collaborative and data analytics capabilities of SpeckleViz through two case studies which provided placeholder data sets to deploy data flow diagrams. Through both case studies, it was demonstrated that the interactive data flow diagram in Speckle [Speckle 2020] can be used to analyse data exchanges happening at a global level across decentralized users, while data can still be processed independently and locally through each individual software at a local level. The initial input(s) and final output(s) of a Grasshopper
and/or Dynamo definition act in this case respectively as global receiver(s) and sender(s) within the wider digital design chain deployed through Speckle.
Through the two cases, the collaborative capabilities of SpeckleViz are demonstrated in small and large scale projects alike. The emphasis is on interoperability and data exchange and on how sustainable are Speckle [Speckle 2020] and SpeckleViz on a large scale and complex architectural project where data is difficult to consolidate throughout the design process.
The first case study consists of a collaboration with L2Onaval (a naval architecture practice) and CBStructure (a naval engineering practice) who provided datasets and 3D models from a 35-passenger aluminium vessel, called e-Boucarot [e-Boucarot 2020], entirely powered by an integrated electric propulsion system. Using SpeckleViz, the case study demonstrates a speculative data flow in which different datasets are exchanged seamlessly across different software platforms (e.g. Rhino3D and Microsoft Excel) from the earliest design phase to the latest stages.
The second case study consists of a collaboration with Grimshaw Architects who provided datasets and 3D models from a large-scale, aviation-related infrastructure project in the United Kingdom. By deploying the graph on these datasets, Grimshaw Architects was able to both review what kinds of insights the graph could instantly provide them through its existing features (e.g. tag-based queries). The architecture firm also identified particular missing features that could be helpful within their practice and provide critical feedback which could lead to future iterations and transformation of the data flow diagram into a proper management interface providing richer data analytics to the end-user – defined here as a “superuser” [Deutsch 2019] (e.g. computational designer, Building Information Modelling (BIM) specialist or design technologist). This would enable the latter to better manage large-scale and complex architectural projects throughout the whole design process. The present paper is divided into six sections. After this introduction, follow the description of the open-source data platform Speckle and the SpeckleViz interface. Afterwards, a demonstration of SpeckleViz via a speculative design workflow deployed across the two case studies follows. The paper ends with a discussion and final concluding remarks with an outline of future works.
2. SPECKLE
Speckle differentiates itself from other commercial web-based interoperability platforms by proposing a complete open-source data framework for AEC [Speckle 2020]. Speckle was originally developed at the University College London (UCL) in 2016 by Dimitrie Stefanescu as
part of the InnoChain project, a H2020 Marie Curie European Training Network.
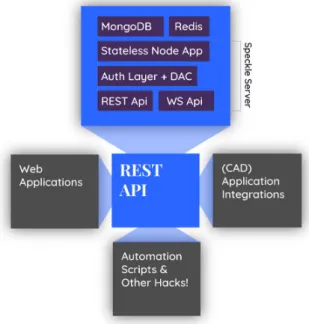
Speckle mainly consists of a Representational State Transfer Application Programming Interface (REST API) [SpeckleServer 2020] which is consumed by different client applications (Fig. 2). Those applications can either be web-based – such as [SpeckleAdmin 2020] – or integrated within the different supported Computer-Aided Design (CAD) software packages, such as Rhino3D and Grasshopper [SpeckleRhino 2020], Revit [SpeckleRevit 2020] and Dynamo [SpeckleDynamo 2020]. Through its REST API, Speckle generally keeps track of what has been sent to/from whom, and to/from where.
Resources in Speckle are organized in a hierarchical manner as a Work Breakdown Structure (WBS) through Objects, Layers (collections of Objects), Streams (collections of Layers and/or Objects) and Projects (collections of Streams). Furthermore, Speckle allows for resources to be enriched with extra metadata such as description, tags, comments, so as to be able to respond to the project's needs and allow for diagonal queries. The web admin interface allows users to manage these resources and control who has access to what data through link sharing, permissions, and project organizations (Fig. 3).
Fig. 2. The Speckle Technology Stack.
The Speckle Admin web app could be compared to other existing Common Data Environments (CDE) in the sense that it presents a single source of information used to collate, manage and disseminate documentation for the whole project team. However, Speckle’s CDE differs from other existing CDEs at it is not file-based and does not offer any Information Container Data Drop (ICDD) functionality1. Instead, resources in Speckle are dynamically sent and received from the different CAD software integrations (or clients), and are represented as JSON objects which can be accessed via their dedicated URLs/URIs.
Via Speckle Streams, users are able to share data from the different existing Speckle clients and plug-ins, which expose a User Interface to
1 Formerly known as Information Container for Data Drop (ICDD), the
standard has beenrecently renamed as Information Container for Linked Document Delivery. https://www.iso.org/standard/74389.html. Accessed 12 July 2020.
both share data (Senders) and receive (Receivers). For example, User A creates a Sender to share Stream A to User B, who creates a Receiver to receive Stream A from User A. As data transfer protocols in Speckle operate in a unidirectional (as opposed to bidirectional) manner, User B would need to create a new Stream (after working upon the data sent by
User A via Stream A) to share new data to User A. This simple yet crucial
triple protocol (Sender-Stream-Receiver) defines the basis of Speckle’s Activity Network and is illustrated in Fig. 4, along with the aforementioned hierarchical directory structure of Speckle (Object, Layers, Streams, Projects).
Fig. 5. The SpeckleViz interface [SpeckleViz 2020].
Fig. 4. Data exchange protocol between two users. Streams are created and stored within the Admin’s Project interface which and contains the Speckle Project’s exchanged data.
3. SPECKLEVIZ
SpeckleViz [SpeckleViz 2020] is a custom web application (Fig. 5) that is now part of the Speckle web admin interface [SpeckleAdmin 2020], and sits at the bottom of any Speckle Project’s page. Although one Stream can be contained within multiple Projects, SpeckleViz only renders the activity network happening within a single Project. In other words, SpeckleViz is a tool for illustrating data flows among the project network, a “network that gets re-initiated for each project” [Chinowsky et al. 2008], [Chinowsky et al. 2010]. Thus, given a specific Speckle Project, SpeckleViz harvests the information from both the clients and the documents collected by the Speckle REST API [SpeckleServer 2020], and renders it through its dedicated interface. While the latter is characterized by both visualization and interaction features described in the next subsections, a complete documentation explaining the interface’s features can be found in [SpeckleViz 2020].
3.1. Visualization features
While circle nodes represent Senders (S) and Receivers (R), square nodes represent Streams. Arrows (or graph edges) represent either data that has been shared to a stream by the user (Receiver to Stream) or data that has been retrieved by a user from a stream (Stream to Sender). The edge’s thickness is proportional to the number of exchanged geometrical objects. Generally, both nodes and edges are coloured according to their respective timestamp: dark blue for the newest created, and light grey for the oldest.
As the graph is force-directed and rendered dynamically, its overall layout might sometimes become too convoluted and not tidy enough to be grasped as a whole. Therefore, several options have been exposed to the end-user in order to manually adapt the graph representation: while the display mode of the graph edges could be switched between three different modes (straight line, arc or diagonal), the force-directed graph layout can be altered in order to force its alignment along the X or Y axis, taking the shape of a tidier Directed Acyclic Graph (DAG). Furthermore, the end-user could at any time during render stop the force-directed simulation.
Senders and Receivers can be grouped either by identical Document GUID or identical Client’s owner ID. While the latter is represented by a blue convex hull, the former is visualized by a pink convex hull.
3.1. Interaction features
The visualization features described in the previous section have been augmented by various interaction features, giving the end-user a
more granular control over the data exposed by SpeckleViz. These features operate on different levels:
Drop-down menus
Right-clicking on one the Stream nodes would display a related drop-down menu. The user can choose between accessing the Stream’s information through the Speckle web management admin interface, viewing the Stream within the Speckle viewer interface or accessing the Stream’s data available through the API endpoints.
Time frame selection
A slider enables the end-user to select a specific time frame of the project. When dragging the slider, the graph’s nodes and links fade out when they are out of the selected time frame, and fade back in when they are within it. Furthermore, the Streams contained within the selected time frame are continuously collated and can be visualized altogether within the Speckle viewer through a dedicated button.
Tag-based queries
In Speckle, Streams can be tagged by the end-user through the web management admin interface [SpeckleAdmin 2020]. These user-defined tags are then exposed via the API through the Stream’s property tags, which are being collected on the back-end before rendering the graph in SpeckleViz. On the front-end side, the end-user is able to select/deselect the existing tags present within the API. The selection dynamically updates the display of the Stream nodes within the graph by highlighting the ones containing at least one tag present within the current selection. Furthermore, the selected tagged Streams are continuously collated and can be visualized altogether within the Speckle viewer through a dedicated button.
Adaptive representations
SpeckleViz gives the end-user the possibility to visualize and adapt its graph from different points of view, or perspectives: the SpeckleViz toolbar exposes a toggle button enabling the user to choose between the “Data flow per user” and “Data flow per document” modes. Therefore, SpeckleViz provides the users with illustrations of the data flows among the Social Network, as described by [Wasserman and Faust 1994], and the Activity Network, as defined by [De Vries 1995]. Switching between these two modes dynamically updates the graph that reorganizes its nodes according to the chosen data flow perspective.
E-BOUCAROT’S CASE STUDY
This first case study (Fig. 6) employs Speckle to seamlessly exchange 3D models provided by both L2Onaval and CBStructure, during the conception and late design stages of a 35-passenger aluminium vessel – called e-Boucarot – across multiple Rhino3D and Microsoft Excel documents. SpeckleViz is then used to visualize and analyze these data exchanges. Although the current design practices amongst these naval architecture and engineering firms do not use Speckle, the present case study speculates how traditional workflows could be improved through the deployment of Speckle and SpeckleViz within them.
3.2. Data flow
The speculative data flow illustrated in Fig.6, Fig.7 and Fig.8 is constituted of 10 design steps enumerated below:
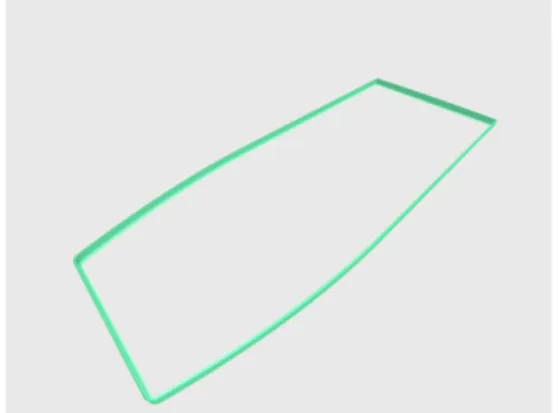
1. Design of the main hull by of L2Onaval in Rhino3D (document A) and transfer of the generated data to document B (Fig. 9).
2. Structural detailing of the hull by CBStructure in Rhino3D (document B) based on the data received from document A (Fig. 10).
3. Reception in document A (acting now as master file) of the data generated previously in document B.
4. Hull’s structure weight estimation performed by CBStructure via Excel for Office 365 (document E), based on data received from document B.
5. Bumper drawing by L2Onaval in Rhino3D (document C) based on the data received from document A (Fig. 11). 6. Reception in document A of the data generated previously in
document C.
7. Bumper’s weight estimation performed by L2Onaval via Excel for Office 365 (document E), based on data received from document C.
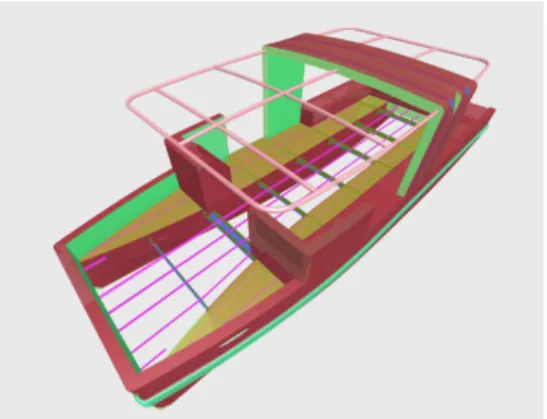
8. Superstructure detailing by CBStructure in Rhino3D (document D) based on the data received from document A (Fig. 12).
9. Reception in document A of the data generated previously in document D.
10. Superstructure’s weight estimation performed by CBStructure via Excel for Office 365 (document E), based on data received from document D.
Fig. 7. Speculative data flow using Speckle to enable seamless data exchanges across multiple documents authored by L2Onaval and/or CBStructure.
Fig. 8. The speculative data flow described in section 4.1 and illustrated in Fig. 6, rendered via SpeckleViz.
Fig. 9. Hull drawing: data originated from the document A (Rhino3D) authored by L2Onaval, viewed in the Speckle viewer app.
Fig. 10. Hull strucutral detailing: data originated from the document B (Rhino3D) authored by CBStructure, viewed in the Speckle viewer app.
Fig. 11. Bumper: data originated from the document C (Rhino3D) authored by L2Onaval, viewed in the Speckle viewer app.
Fig. 12. Superstructure: ata originated from the document D (Rhino3D) authored by CBStructured, viewed in the Speckle viewer app.
Fig. 13. Master file: data originated from the documents A, B, C, and D (Rhino3D) authored by both L2Onaval and CBStructure, aggregated in document A (Rhino3D) and viewed in the Speckle viewer app.
3.3. Analysis in Excel
The different weight estimations performed in Excel (Fig. 14) are following the layer table organization from Rhino3D extracted automatically via Speckle. Object properties from Rhino (e.g. object name, material, thickness, volume and centre of gravity position) are also kept during the transfer between Rhino3D and Excel. Once all the different properties are extracted from the model, total weight and global centre of gravity of the ship’s components are computed directly via Excel. Load cases will then be used to compute preliminary stability and check authority’s regulation criteria.
Fig. 14. Data received from Rhino3D to Excel via Speckle. The objects’ material, volume and centre of gravity, the total weight and global gravity of the ship’s components can be subsequently calculated.
2 AutoCAD Civil 3D software is a design and documentation solution for civil
engineering that supports building information modeling (BIM) workflows.
Although the Speckle client for Rhino3D is fully developed and well maintained, the Speckle client for Microsoft Excel is released as a beta version. The installation instructions can be found in [SpeckleExcel 2020].
Through the deployment of this case study, L2Onaval recognized that both Speckle and its Activity Network Diagram SpeckleViz could significantly improve digital design workflow in everyday practices.
The next case study will look beyond pure data exchange and interoperability concerns by deploying and stress testing SpeckleViz onto a larger and more complex architectural project. This will help in evaluating how robust are the platform and graph interface in a richer collaborative environment where data is more volatile and constantly sent back and forth between multiple project members.
4. GRIMSHAW ARCHITECTS’CASE STUDY
4.1. Presentation of the case study
The second study interrogates the use of SpeckleViz by Grimshaw Architects on a large-scale, aviation-related infrastructure project in the United Kingdom, where Grimshaw Architects’ full scope of involvement ranges across multiple scales, from the largest scales of land-use planning & zoning down to the architectural design of individual buildings.
On this specific project, the wider integrated design team counts hundreds of members of the Architecture, Engineering and Construction (AEC) industry, including architects, engineers, and urban designers. The present study is focused on the implementation of the tool specifically at the urban design scale, within a core team of approximately forty architects.
The main design task is the development of a consistent masterplan, within a complex framework of physical, functional and operational parameters and constraints, through the engagement with a large group of stakeholders, public authorities and local communities. In order to achieve that, the design team has a developed a design process, which is split into two main steps:
The first step is the development of a combinatorial system of parts (components) based on the given brief, which are related to both on-airport activities: airfield, terminals, satellite buildings, aprons etc. and off-airport activities: road & rail network, parking infrastructure, utilities and community facilities, as well as major landscape interventions and water reservoirs.
The next step is the distribution of these components in a series of zones across the available land, through an iterative process of extensive optioneering [Holzer and Downing 2010] and spatial and organization optimisations, which when put together form the Preferred Masterplan (PM).
In terms of the technical side of data production, manipulation and output, the design teams work with 2D and 3D Computer Aided Design (CAD) elements, as well as Geographic Information System (GIS) datasets, which represent either component (2D/ 3D models) or zonal elements (boundary lines etc.) in several stages of Level of Development (LOD), which are consolidated in drawing sets (for the representational elements), datasheets (for the metadata) and bespoke online viewing platforms. The development, coordination and exchange of data is handled through several formats:
Civil 3D2 models in .dwg (extension format for AutoCAD files).
Rhino3D3 models in .3dm (open-source 3D model format and native file format for Rhino3D).
3 Rhinoceros (typically abbreviated Rhino, or Rhino3D) is a computer
Coordinated Building Information Modelling (BIM) models in .rvt (extension format for Revit4 files).
GIS data in .shp5 and .geotiff6 formats. LIDAR Pointclouds in LAS7.
4.2. Speckle in the wider project’s data flow
To handle the scale of the project, the multiplicity of the file formats and the quality of the deliverables, a Common Data Environment (CDE) was set by the client following information management best practices [BS EN ISO 19650-1:2018 2018]. The case study won’t interrogate the wider CDE but will focus on its interface with the speckle implementation (Fig. 15).
Fig. 15. The case study in the wider data flows of the project.
4.3. Information management best practice and data streams identification
As detailed in the previous section, in this case study Speckle is not implemented as a Common Data Environment but as an internal tool to enhance fast pace and agile internal data exchange. However, agile and versatile data exchange in early stage of design still requires solid data management strategies. Especially, in this case the streamed datasets needed to be clearly identified to support the team collaboration. Indeed, the different members of the team (not only the “senders”) needed to be able to quickly identify the content of the streams: which data was contained, if it was suitable for further uses. At Grimshaw, in more “traditional” data-exchange processes, BIM guidelines are defined and used to allow suitable management of the projects data. In this case, only light guidelines and best practice were set and would benefit to be refined.
It is worth noticing that data exchanged were mainly Work In
progress (WIP) [BS EN ISO 19650-1:2018 2018], but also published
data, in order to address the following needs:
Data from published document: reference information (boundary lines for example) needed to be consolidated/used in the study.
WIP data: boundaries or land use options, associated with metadata.
We propose to interrogate here the different identification metadata of the Speckle Streams from the case study, according to BS EN ISO 19650-2:2018 (Fig. 16).
4Autodesk Revit is a Building Information Modelling (BIM) software for
architects, landscape architects, structural engineers, mechanical, electrical, and plumbing (MEP) engineers, designers and contractors.
5 Object created and/or used by various 3D design programs; typically a
three-dimensional image represented using polygons that are defined by vertices and lines; may also be a 2D drawing
Fig. 16. Identification of information containers within a common data environment, according to BS EN ISO 19650-2:2018 (page 37)
All identification data of the Speckle Streams are identified as analysed in Table 1.
TABLE I. IDENTIFICATION FIELDS (BSENISO19650-1:2018) AND RELATED METADATA IN SPECKLE
Identification field Identification in Speckle
Project Ensured by the Speckle project code field
Originator In this case, exchanges were run only within Grimshaw Architects, so the “originator” identification was not crucial. Also more detailed “originator” information is kept track of for each stream, especially about the senders ID as well as the streamed data history.
Volume/System Volume & levels (i.e. models breakdown) were tracked through Speckle tags (e.g. Fig. 17) which proved to be flexible and versatile enough for this stage of the project. Level/Location
Type “Types” as per the ISO are “types of information” (like Room Data Sheet, Survey etc), these are not defined nor constrained in Speckle, allowing the versatility of each stream.
Role Roles are dependent on the sender, and therefore currently very versatile.
Number Sequential numbers are needed only if the stream is part of a series. If needed, in this case study this field was included in the stream name.
Status The status identification (WIP, Shared etc) and suitability (suitable for stage approval, etc) fields were missing.
Suitability
Analyse of the Identification of information container according to BS EN ISO 19650-1:2018
From this analysis, we can notice that:
Some identification fields were kept undefined for more versatility, especially the “Types” field.
Some identification fields were undefined to rely on the automated tracking of the stream history, an automation
6 GeoTIFF is a public domain metadata standard which allows geo-referencing
information to be embedded within a TIFF file
7 LIDAR Data Exchange File. The LAS (LASer) format is a file format
allowing more accuracy and consistency: as for the “originator” and “role” fields.
Streams names and tags were the most useful identifier, especially through their visualization in SpeckleViz: as for the “Volume/System” and “Level/Location” fields.
The “status” and “suitability” identification were missing in this case study. It could have been set as tags, but with the risk of human error in setting or modifying them.
The high agility and versatility of Speckle reflects in the information management strategies currently implemented.
Speckle has been used so far at Grimshaw Architects both as an interoperability tool and a collaboration tool. However, the implementation of proper information management best practices is currently in progress. Further studies would be needed to interrogate further the use of Speckle as a powerful Common Data Environment and the evolution it implies in collaborative practices.
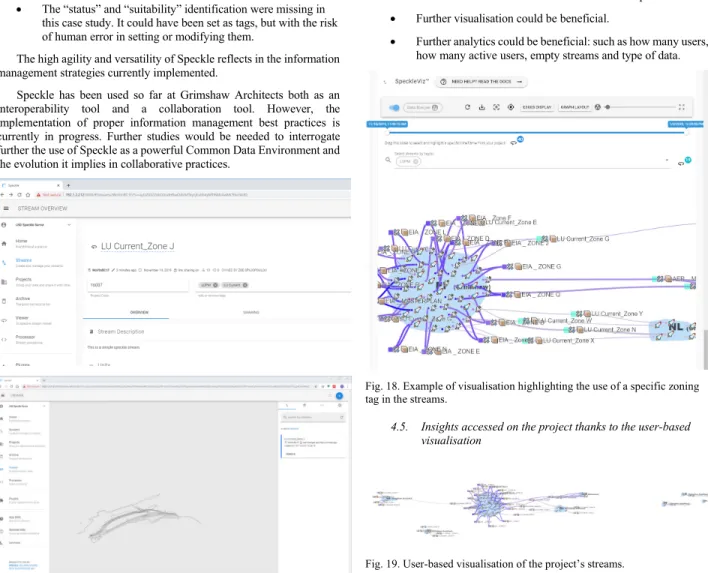
Fig. 17. The “LU Current_Zone J” Stream inspected in the Speckle Admin interface (top) and within the Speckle viewer (bottom).
4.4. General user observations of SpeckleViz
The SpeckleViz functionality was implemented after few months of Speckle implementation on the project. Its use is still in experimentation and this case study doesn’t reflect an everyday use of the tool but more a proactive initiative to assess the potentiality for some further improved implementation.
The metagraph, or SpeckleViz interface, is easy to access and its functionalities relatively easy to understand for a design technology aware individual. Amongst its functionality, we can note that:
The toggle between data flow per user and data flow per document enable interesting insights on the project organisation.
The stream filter per tag (Fig. 18) as well as the highlight of a specific timeframe enable an access to further understand the streams, their content and history.
The specific insights gained on the project and its processes will be developed in the following sections.
The general ergonomic of the interface be improved:
Navigating the graph is made difficult by the absence of a “zoom extent” tool, especially for disconnected nodes. Navigating the streams precisely is not easy especially for
over connected nodes where the streams overlap. Further visualisation could be beneficial.
Further analytics could be beneficial: such as how many users, how many active users, empty streams and type of data.
Fig. 18. Example of visualisation highlighting the use of a specific zoning tag in the streams.
4.5. Insights accessed on the project thanks to the user-based visualisation
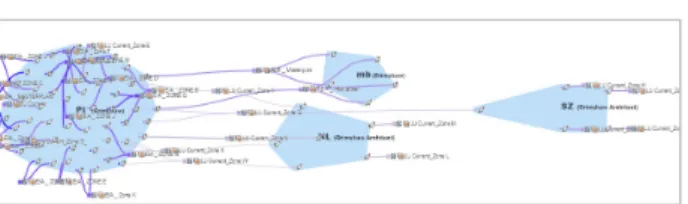
Fig. 19. User-based visualisation of the project’s streams.
The main insights we got from accessing the projects streams through the visualisation per users are:
One main user is emitting and receiving the majority of the streams.
A reduced proportion of the streams are actually used to exchange data between users, most of the streams are sent and received by the same person.
Out of the thirteen users part of the speckle project, only seven are actually contributing to the pool of data exchanged. Several of the active users are actually not exchanging data
with anyone but sending data only to themselves. It seems that some streams are sent but never received. The few streams having a different receiver than their sender all
implies the main speckle user: this person is the main connection, none of the secondary nodes connect together (Fig. 20).
Fig. 20. Detail on the user-based visualisation of the project’s streams. The highlight of the streams timeframe help to understand the evolution of the focus of the team. It confirms the importance of the central user and its consistence along the project timeframe (Fig. 21).
Fig. 21. Detail on the user-based visualisation of the project’s timeframe.
4.6. Insights accessed on the project thanks to the document-based visualisation
Grimshaw Architects provided two main insights through the visualization of the dataflow per document:
Because the Rhino3D API does not really have a consistent DocumentID property which corresponds instead to the RuntimeSerialNumber of the document, only one main Grasshopper definition seemed to have been used to issue/receive data, which wrongly shows a poor modularity of the scripting strategy of the project. This issue has been fixed since, by generating a key/value pair containing a custom GUID (Globally Unique Identifier) and storing it in the document’s string dictionary.
Because there is no visibility on non-speckle related exchanges and Grasshopper-Rhino is used as a main mining tool for the information, a very small part of the whole process and project data is actually available to our understanding through the graph.
Fig. 22. Document-based visualisation of the project’s streams.
4.7. Limitations and opportunities
Essentially, Grimshaw Architects identified three critical issues related to SpeckleViz which could be improved in the future through further development:
Poor ergonomics of the graph display:
‐ Insufficient visibility of the disconnected nodes. ‐ A zoom extent tool would definitely improve the
user experience while navigating through the graph. It is currently quite difficult to get a good overall understanding of the digital workflow only through the graph itself. High level analytics would be helpful such as : count of senders, count of receivers and count project members.
The SpeckleViz tool also reflects some of the speckle bugs. When a stream bug for a reason or another, it has to be created again, which make the timeline less accurate and loss the versions.
Grimshaw Architects also recognized that improving tag curation upfront within the Speckle admin interface would make tag-based queries in SpeckleViz more meaningful. Finally, Grimshaw Architects pointed out the need to be able to deal directly with options via the graph (i.e. map equivalent streams but for different intents).
5. DICUSSION AND CONCLUSION
This paper briefly introduced the current challenges in collaborative design workflows within the AEC sector and described both the open-source AEC data platform Speckle and its related SpeckleViz interface, an experimental and work-in-progress web-based interactive visualization tool, which aims at representing and managing the activity and social networks (across users or documents), operating within the Speckle framework. The two case studies described in this paper helped in illustrating the direct application of both Speckle and SpeckleViz in the AEC industry, and helped in assessing to what extent the open-source platform and its related graph interface could fully support “real-world”, industry-related scenarios.
The paper contributed to knowledge, first through the e-Boucarot case-study that described how existing segregated digital design workflows in industry could be seamlessly streamlined through Speckle and visualized through SpeckleViz. Secondly, the Grimshaw Architects case-study allowed for understanding the use of SpeckleViz on a larger scale. The practical implications of the work are that critical issues were identified, in terms of process, uses and functionalities such as: need for including Speckle in the project BIM guidance, lack of functionalities toward ISO1960 Common Data Environment compliance, lack of a zoom-extent tool, lack of high-level data analytics and lack of a versioning control system integrated within the graph.
Apart from these challenges, the tag-based query system proved to be very useful and encouraged Grimshaw Architects to better curate their Streams with tags so that they can be more searchable through the interface. To this end, beyond a visualization tool, SpeckleViz demonstrated the potential to evolve towards a proper management tool, enabling deeper curation, versioning, editing and deletion of Streams and streamlining issue management and collaborative work.
ACKNOWLEDGMENTS
The present research has received funding from InnovateUK under the competition “Increase Productivity, Performance and Quality in UK Construction” (proj. no. 104799). Speckle was originally developed at The Bartlett School of Architecture as part of the InnoChain project, which received funding from the European Un-ion’s Horizon 2020 research and innovation programme under the Marie-Sklodowska-Curie grant agreement No 642877.
The authors would like to thank both Grimshaw Architects, L2Onaval and CBStructure for providing relevant datasets and feedback in the case studies described in the present paper.
REFERENCES
AXIOS.2020. Axios GitHub Repository. Axios is a promise based HTTP client for the browser and Node.js. GitHub. https://github.com/axios/axios.
ISO 19650-1&2:2018. 2018. Organization and digitization of information about buildings and civil engineering works, including building information modelling (BIM) — Information management using building information modelling — Part 1: Concepts and principles. Part 2: Delivery phase of the assets. International Organization for
Standardization. https://www.iso.org/standard/68078.html.
CHINOWSKY,P.,DIEKMANN,J., AND GALLOTI,V. 2008. Social network model of construction. In Journal of construction engineering
and management, 134, 804–812.
CHINOWSKY, P. DIEKMANN, J., AND O'BRIEN, J. 2010. Project organizations as social networks. In Journal of Construction
Engineering and Management, 452-458.
D3JS.2020. D3.js Github Organization. Github. https://github.com/d3.
DE VRIES,B.1995. Message Development in the Building Process. In Modeling of Buildings through their Life-Cycle. Proceedings
of the CIB w78 Conference. Pp. 467-479. Standford.
DEUTSCH,R. 2019. Superusers: Design Technology Specialists and the
Future of Practice, First Edition. Routledge.
DYNAMO. 2020. Dynamo is a graphical programming interface within Revit, which is a Building Information Modelling (BIM) software for architects, and structural engineers. Dynamo BIM. https://dynamobim.org/
E-BOUCAROT.2020. Capbreton Goes Green with All-Electric Passenger Ferry. The Marine Executive.
https://www.maritime-executive.com/corporate/capbreton-goes-green-with-all-electric-passenger-ferry.
GRASSHOPPER. 2020. Grasshopper3D (typically abbreviated Grasshopper) is a visual programming language and environment that runs within Rhino3D. Grasshopper3D. https://www.grasshopper3d.com/.
HOLZER,D. AND DOWNING,S. 2010. Optioneering: a new basis for engagement between architects and their collaborators. AD:
Architectural Design 80, 4, 60–63.
RINGLEY,B. 2017. What is the point of using Dynamo? San Francisco Computational Design User Group, June 2017. https://www.youtube.com/watch?v=y6N1ICoFoyU.
SACKS,R.,NAVON,R.,SHAPIRA,A., AND BRODETSKY,I.,2002. M Monitoring Construction Equipment for Automated Project Performance Control. International Symposium on
Automation and Robotics in Construction. Pp. 161-166.
SPECKLE.2020. Speckle GitHub Organization. GitHub. https://github.com/speckleworks.
SPECKLEADMIN. 2020. SpeckleAdmin GitHub Repository. GitHub. https://github.com/speckleworks/SpeckleAdmin.
SPECKLEDYNAMO.2020. Speckle client for Dynamo. GitHub. https://github.com/speckleworks/SpeckleDynamo. SPECKLEEXCEL.2020. Speckle client for Microsoft Excel. GitHub.
https://github.com/speckleworks/SpeckleExcel.
SPECKLEREVIT.2020. Speckle client for Revit. GitHub. https://github.com/speckleworks/SpeckleRevitReboot. SPECKLERHINO.2020. Speckle client for Rhino. GitHub.
https://github.com/speckleworks/SpeckleRhino. SPECKLESERVER.2020. Speckle Server Github Repository. GitHub.
https://github.com/speckleworks/SpeckleServer. SPECKLEVIZ.2020. SpeckleViz documentation page. Speckle.
https://speckle.systems/docs/web/speckleviz
VAN DER HEIJDEN,R.,E.LEVELLE, AND M.REISE 2015. Parametric Building Information Generation for Design and Construction. In Proceedings of the 35th Annual Conference of the
Association for Computer Aided Design in Architecture – Computational Ecologies, Design in the Anthropocene (ACADIA 2015). Pp 417–430.
VUEJS.2020. Vue.js Github Organization. Github. https://github.com/vuejs.
VUETIFY.2020. Vuetify.js Github Organization. Github. https://github.com/vuetifyjs/vuetify.
WASSERMAN,S. AND FAUST,K. 1994. Social network analysis: Methods
and applications. Cambridge, United Kingdom: Cambridge
HARVESTING THE SPECKLE RESTAPI
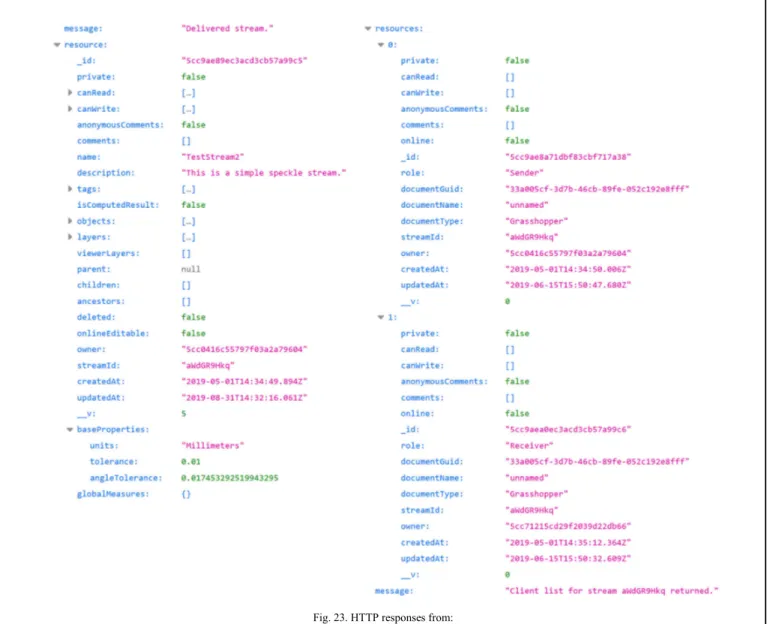
On the back-end, the SpeckleViz activity network diagram harvests data from the Speckle REST API (Application Programming Interface) by performing calls using Axios [Axios 2020]. The initial HTTP request takes a Project ID as an input, returning the list of contained Streams as a response. New HTTP requests are made to retrieve each stream’s corresponding resources, such as the _id (Stream’s ID), owner (Stream’s owner), createdAt (Stream’s creation time) and
updatedAt (Stream’s last update) properties. The complete list of the
existing Stream properties are illustrated in Fig. 23, left. Finally, last HTTP requests are made to get the corresponding Clients (Sender and/or Receiver) resources per Stream, such as the _id (Client’s ID), owner (Client’s owner), documentGuid (Document’s GUID),
documentName, createdAt (Client’s creation time) and updatedAt (Client’s last update) properties. The complete list of the
existing Stream properties are illustrated in Fig. 23, right. Although most of the resources can inform the graph, the main ones used to create its nodes and edges are the Client’s _id and Stream’s _id properties. The collected resources are formated into a JSON (JavaScript Object Notation) objects which will further feed the graph on the front-end.
INPUT (BACK-END)
The code below consumes the Speckle REST API through the above-mentioned HTTP requests. This is only a part of the whole script that produces the final graph. The complete code can be found on the SpeckleAdmin Github Repository page [SpeckleAdmin 2020].
asyncComputed: { async myResolvedValue() { this.toggleFix = false let streamLinks = [] let nodes = [] let resProject try {
resProject = await axios.get(
`${this.$store.state.server}/projects/${this. project._id}`
)
} catch (err) {
P
ART2:
I
MPLEMENTATION[I/O
S
ECTION]
Fig. 23. HTTP responses from:
https://hestia.speckle.works/api/v1/streams/${StreamID} (left) https://hestia.speckle.works/api/v1/streams/${StreamID}/Clients (right).
console.log(err) return
}
let allusersSet = new Set([resProject.data.resource.owner, resProject.data.resource.canRead, resProject.data.resource.canWrite])
let allusers = [...allusersSet].flat()
allusers = [...new Set(allusers)] //this.$data.all_userInfo = allusers for (let i = 0; i < allusers.length; i++) {
let user = allusers[i] let resOwner
try {
resOwner = await axios.get( `${this.$store.state.server}/accounts/${user} ` ) }catch (error) { console.log("Can't access user info") } let userInfo = resOwner.data.resource //console.log(userInfo) let userCode = `${userInfo.name} ${userInfo.surname} @ ${userInfo.company}` this.$data.all_userCode.push(userCode) this.$data.all_userInfo.push(userInfo) } let projectStreams = resProject.data.resource.streams let projectPermissions = resProject.data.resource.permissions let alltags = [] for (let i = 0; i < projectStreams.length; i++) { let streamShortID = projectStreams[i] let stream_id let resStream try {
resStream = await axios.get( `${this.$store.state.server}/streams/${stream ShortID}` ) let streamOwnerID = resStream.data.resource.owner let resOwner try {
resOwner = await axios.get( `${this.$store.state.server}/accounts/${strea mOwnerID}` ) }catch (error) { console.log("Can't access user info") } let userInfo = resOwner.data.resource stream_id = resStream.data.resource._id let streamCanRead = resStream.data.resource.canRead let streamCanWrite = resStream.data.resource.canWrite let streamCreatedAt = resStream.data.resource.createdAt let streamUpdatedAt = resStream.data.resource.updatedAt let streamName = resStream.data.resource.name let streamTags = resStream.data.resource.tags let objectsNumber = resStream.data.resource.objects.length let units = resStream.data.resource.baseProperties.units let tolerance = resStream.data.resource.baseProperties.tolera nce
let rawData = {stream_id: stream_id, canRead: streamCanRead, canWrite: streamCanWrite, tags: streamTags, objNum: objectsNumber, owner: streamOwnerID, createdAt: new
Date(streamCreatedAt).toLocaleString("en-GB"), updatedAt: new
Date(streamUpdatedAt).toLocaleString("en-GB"), units: units, tol: tolerance}
Object.keys(rawData).forEach((key,i) => {if(Array.isArray(rawData[key]) && (rawData[key].length < 1)){ rawData[key] = ["undefined"] } }) for (let j = 0; j < streamTags.length; j++) { this.$data.allStreamTagsJSON.push({ name: streamTags[j] }) } alltags.push(streamTags) nodes.push({ type: "Stream", _id: stream_id, streamId: streamShortID, owner: streamOwnerID, createdAt: streamCreatedAt, updatedAt: streamUpdatedAt, size: "10", objectsNumber: objectsNumber, name: `${streamName}`, tags: streamTags, canRead: streamCanRead, canWrite: streamCanWrite, units: units,
tolerance: tolerance }) } catch (error) { console.log("Can't access stream: " + streamShortID) } // let resClient try {
resClient = await axios.get( `${this.$store.state.server}/streams/${stream ShortID}/clients` ) for (let j = 0; j < resClient.data.resources.length; j++) { let client_id = resClient.data.resources[j]._id let clientOwnerID = resClient.data.resources[j].owner let resOwner try {
resOwner = await axios.get( `${this.$store.state.server}/accounts/${clien tOwnerID}` ) }catch (error) { console.log("Can't access user info") } let userInfo = resOwner.data.resource let clientCanRead = resClient.data.resources[j].canRead let clientCreatedAt = resClient.data.resources[j].createdAt let clientUpdatedAt = resClient.data.resources[j].updatedAt let clientRole = resClient.data.resources[j].role let clientDocumentType = resClient.data.resources[j].documentType let clientDocumentName = resClient.data.resources[j].documentName let clientDocumentID = resClient.data.resources[j].documentGuid let customName = `` if (clientRole == "Sender") { customName = `S` } if (clientRole == "Receiver") { customName = `R` } nodes.push({ type: "Client", _id: client_id, owner: clientOwnerID, userInfo: userInfo, createdAt: clientCreatedAt, updatedAt: clientUpdatedAt, role: clientRole, size: "10", documentType: clientDocumentType, documentName: clientDocumentName, documentGuid: clientDocumentID, name: customName }) if (clientRole == "Receiver") { streamLinks.push({ source: stream_id, target: client_id, targetClient: client_id, targetDoc: clientDocumentID, action: "receiving" }) } else if (clientRole == "Sender") { streamLinks.push({ source: client_id, target: stream_id, sourceClient: client_id, sourceDoc: clientDocumentID, action: "sending" }) } } } catch (error) { console.log("Can't access stream's client from " + streamShortID)
} } this.allStreamTags = this.flatten(alltags) this.sortedNodesByCreationDate = nodes this.sortedNodesByCreationDate.sort(function( a, b) {
return a.createdAt < b.createdAt ? -1 : a.createdAt > b.createdAt ? 1 : 0 }) let createdAts = this.sortedNodesByCreationDate.map(d => d.createdAt)
this.result = [nodes, streamLinks] //this.value3 = [0,this.result[0].length-1] this.dates = createdAts this.dates = createdAts.map(d => new Date(d).toLocaleString("en")) this.dates = [...new Set(this.dates)] this.sliderValue = [this.dates[0], this.dates[this.dates.length - 1]]
return [nodes, streamLinks] }
The main output of the above code is [nodes, streamLinks] which will later feed the front-end of SpeckleViz, described below.
OUTPUT (FRONT-END)
SpeckleViz is built upon the Speckle web management admin interface, within the Speckle Project tab. As the latter has been designed with Vue.js, an open-source JavaScript framework for building user interfaces and single-page applications [Vue.js 2018], a basic layout has been designed with the same framework in order to host the graph itself, which has been rendered using D3.js (also known as D3, short for Data-Driven Documents) - a JavaScript library for producing dynamic, interactive data visualizations in web browsers [D3.js 2017].
As Vue.js and D3.js operate on different levels and through different mechanisms, a suitable pattern had to be established to enable the passing of data seamlessly from one framework to the other. In this context, a Vue template has been created to receive the SVG elements from D3.js. For example, the SVG elements <svg> <g> and <rect> elements are added individually rather than through the familiar D3.js method chaining pattern. This allows to dynamically bind these elements to D3.js data within the Vue component, and take advantage of Vue’s reactivity.
In general, the graph is generated through d3-force, a D3.js module dedicated to force-directed graph layout using velocity verlet integration. In regards to the styling of the toolbar and control panels, SpeckleViz relies on Vuetify.js [Vuetify 2019].
Fig. 23. The resulted visualisation and interaction features have been described in section 3. The resulted graph takes different shapes (such as in Fig. 6 and Fig. 19) depending on the Speckle Project’s content (Different Streams shared across different users and documents).

![Fig. 5. The SpeckleViz interface [SpeckleViz 2020].](https://thumb-eu.123doks.com/thumbv2/123doknet/6000756.149526/3.918.145.787.97.418/fig-the-speckleviz-interface-speckleviz.webp)