HAL Id: hal-00330219
https://hal.archives-ouvertes.fr/hal-00330219
Submitted on 21 Jul 2005HAL is a multi-disciplinary open access
archive for the deposit and dissemination of sci-entific research documents, whether they are pub-lished or not. The documents may come from teaching and research institutions in France or abroad, or from public or private research centers.
L’archive ouverte pluridisciplinaire HAL, est destinée au dépôt et à la diffusion de documents scientifiques de niveau recherche, publiés ou non, émanant des établissements d’enseignement et de recherche français ou étrangers, des laboratoires publics ou privés.
Pollen transport to southern Greenland: new evidences
of a late spring long distance transport
D.-D. Rousseau, P. Schevin, D. Duzer, G. Cambon, J. Ferrier, D. Jolly, U.
Poulsen
To cite this version:
D.-D. Rousseau, P. Schevin, D. Duzer, G. Cambon, J. Ferrier, et al.. Pollen transport to south-ern Greenland: new evidences of a late spring long distance transport. Biogeosciences Discussions, European Geosciences Union, 2005, 2 (4), pp.829-847. �hal-00330219�
BGD
2, 829–847, 2005 Pollen transport to Greenland D.-D. Rousseau et al. Title Page Abstract Introduction Conclusions References Tables Figures J I J I Back CloseFull Screen / Esc
Print Version Interactive Discussion EGU Biogeosciences Discussions, 2, 829–847, 2005 www.biogeosciences.net/bgd/2/829/ SRef-ID: 1810-6285/bgd/2005-2-829 European Geosciences Union
Biogeosciences Discussions
Biogeosciences Discussions is the access reviewed discussion forum of Biogeosciences
Pollen transport to southern Greenland:
new evidences of a late spring long
distance transport
D.-D. Rousseau1,2, P. Schevin1, D. Duzer1, G. Cambon1, J. Ferrier1, D. Jolly1, and U. Poulsen3
1
Institut des Sciences de l’Evolution, Universit ´e Montpellier II, case 61, place Eug `ene Bataillon, 34095 Montpellier cedex 5, France
2
Lamont-Doherty Earth Observatory of Columbia University, Palisades, NY 10964, USA
3
Danish Radio-Sonde Station, 3923 Narsarsuaq, Greenland
Received: 9 June 2005 – Accepted: 30 June 2005 – Published: 21 July 2005 Correspondence to: D.-D. Rousseau (denis@dstu.univ-montp2.fr)
BGD
2, 829–847, 2005 Pollen transport to Greenland D.-D. Rousseau et al. Title Page Abstract Introduction Conclusions References Tables Figures J I J I Back CloseFull Screen / Esc
Print Version Interactive Discussion
EGU
Abstract
New observations of long distance transport of pollen to southern Greenland are recorded during two consecutive weeks, 19 May until 1 June 2003. These new re-sults indicate again Northeastern America as the source area of the transported pollen grains. Backward trajectories studies indicate that transport occurred twice during the
5
first week, which corresponds to the interval of maximum pollen flux emitted in the atmosphere. This is indicated by the large percentage of exotic pollen grains identi-fied, about 11% of the total counted including the local vegetation. Conversely, the transport observed during the second week occurred during a single day, at a time of reduced pollen emission into the atmosphere in the source area, and experienced
10
severe wash out and thus is indicated by a lower percentage of exotic grains, 1% of the total identified ones. The trajectories modeled by the HYSPLIT application show different patterns to those previously identified in 2002. Although air volumes passing over southern Greenland at 3000 m carried out the main transport, additional transport occurred at a much lower altitude leading producing a more complicated pattern of
15
modeling than previously considered.
1. Introduction
The on going “EPILOBE” project, monitoring the pollen transport to coastal Greenland, is based on several stations where filters are trapping, all year long, the pollen grains present in the air (Rousseau et al., 2001). Indeed, tracing spore or pollen movement
20
backwards is not new (Andrews et al., 1980; Bourgeois, 2000; Bourgeois et al., 2001; Bourgeois et al., 1985; Campbell et al., 1999; Franzen et al., 1994; Gajewski, 1995; Hicks et al., 2001; Hjelmroos and Franzen, 1994; Jacobs et al., 1985; Janssen, 1973; Nichols, 1967; Ritchie, 1974; Ritchie et al., 1987; Ritchie and Lichti-Federovich, 1967; Short and Holdsworth, 1985), but these studies never proposed the complete
trajec-25
BGD
2, 829–847, 2005 Pollen transport to Greenland D.-D. Rousseau et al. Title Page Abstract Introduction Conclusions References Tables Figures J I J I Back CloseFull Screen / Esc
Print Version Interactive Discussion
EGU
to southern Greenland, at Narsarsuaq, was documented in 2002 including arboreal pollen (hickory, hemlock, oak, beech, hornbeam, walnut) originating from northeast America (Rousseau et al., 2003). This transport was supported by the dates of pollen production measured in the Toronto area, southern Canada, at the northern range of the common distribution of these trees (Cambon, 1994; Cambon et al., 1992). In
ad-5
dition, another experiment, using the same protocol, was carried out the same year on the sea ice at the North Pole during the “Banquise 2002” expedition between Jan-uary and July. Two previously unrecorded long distance transports were reported from this area, corresponding to birch, willow, alder and pine pollen grains originating from Western Europe in the first week, followed by pollen from eastern Siberia two weeks
10
later (Rousseau et al., 2004). The patterns of transports have been described using the HYSPLIT model (Draxler and Hess, 1998; HYSPLIT4Model, 1997), from NOAA, which allows the determination of backward trajectories. Despite the possibility that the North Pole record may be exceptional as access to that region is rather rare, the question of the regularity of the pollen transport to southern Greenland remains. Was
15
the observed pattern in 2002 unique or is it more or less recurrent? We aim to address this question by presenting new data.
2. Methods
The pollen data were collected from a trap consisting of two 20 cm×20 cm filters (Cour, 1974), labeled respectively A and B, installed at 1.5 m elevation on a vane-holder
in-20
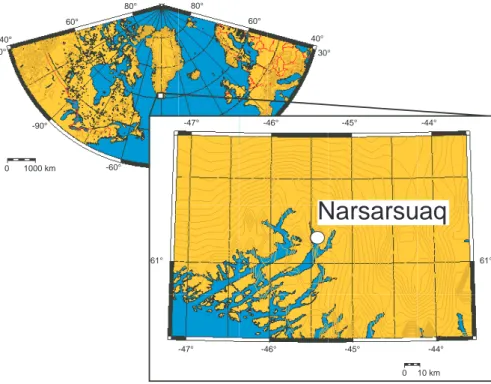
stalled close to the Radio Sonde station at Narsarsuaq (61.15◦N, 45.43◦W, 1 m a.s.l.) in southern Greenland (Fig. 1). A set of filters was exposed all year long, from Monday, 6 January until Sunday, 27 December. The filters are made of siliconed medical gauze and held constantly at right angles to the prevailing wind by the vane-holder. The filters were processed in Montpellier using a standard method described in Cambon
(Cam-25
bon, 1994; Cambon et al., 1992), and the pollen identified by examining the pollen slides at a magnification of x 600. The “A” filters were changed every two weeks,
la-BGD
2, 829–847, 2005 Pollen transport to Greenland D.-D. Rousseau et al. Title Page Abstract Introduction Conclusions References Tables Figures J I J I Back CloseFull Screen / Esc
Print Version Interactive Discussion
EGU
beled as Ax, indicating the two weeks of exposure, which begins at odd week intervals. The weekly “B1” and “B2” filters were labeled AxB1 or AxB2 respectively. If the “Ax” filters, analyzed first, showed transported pollen, in our case pollen from arboreal veg-etation outside of Greenland, the “B” filters were processed subsequently to determine the particular week and the pollen source.
5
The HYSPLIT (Hybrid Single-Particle Lagrangian Integrated Trajectory) transport and dispersion model computes trajectories for any place in the world from archived gridded meteorological data (Draxler and Hess, 1998; HYSPLIT4Model, 1997). The HYSPLIT backward trajectories requested were those for the air volumes reaching the pollen traps at filter – ground level, or passing over the sampling area at respectively
10
1000 m and 3000 m altitude, and hence allowing for the transported pollen to be de-posited on the filters. Recently, it has been demonstrated that long distance pollen transport to southern Greenland involved an air volume passing at 3000 m altitude (Rousseau et al., 2003) while different altitudes (1000 and 3000 m) concerned trans-portation to the North Pole (Rousseau et al., 2004). The geographical plot of the air
15
volume trajectories is then compared with the distribution maps of the trees in northern Hemisphere, whose pollen has been identified on the exposed filters (Hult ´en, 1964; Hult ´en and Fries, 1986; Thompson et al., 1999a, b). HYSPLIT also provides informa-tion on the upward and downward air moinforma-tions contributing to enhance or reduce the abundance of pollen being transported and subsequently deposited on the filters. The
20
vertical velocity plot allows the final selection of the air volumes assumed to have trans-ported the pollen grains. Besides the correct timing of the pollen production, if neither upward movement above the growing area nor downward movement at the Greenland station are indicated, then the possible air volume is not selected. The different pat-terns presented here fulfill these 3D requirements. We are nevertheless aware of the
25
restrictions indicated by Stohl et al. (2002) about trajectory calculations in the interpre-tation of atmospheric trace substance measurements. This would requires changing our collecting protocol to a more frequent interval, i.e. every day or so, that we cannot a priori perform as the dates of captures seem to vary year after year
BGD
2, 829–847, 2005 Pollen transport to Greenland D.-D. Rousseau et al. Title Page Abstract Introduction Conclusions References Tables Figures J I J I Back CloseFull Screen / Esc
Print Version Interactive Discussion
EGU
3. Results
3.1. Pollen occurrence
Among the primary (A) filters collected, one of these (A10) provided abundant pollen, which corresponds with the time interval 19 May–1 June. Indeed 154 grains of Fraxinus (ash), 29 of Populus (poplar), 24 of Acer (maple), 21 grains of Quercus (oak), 3 of
Fa-5
gus (beech), 2 of Tsuga (hemlock), 1 of Carpinus (hornbeam), Carya (hickory), Picea
(spruce), Pinus (pine), Taxus (yew) and of Ulmus (Elm), were recorded, representing 239 grains off a total counted of 6810 (Fig. 2). This is 3,49% of the total identified grains representing the local tundra vegetation surrounding the station. All the cited trees do not grow in Greenland, and thus indicate, as in 2002, the occurrence of long
10
distance pollen transport. To narrow our time investigation, the weekly exposed filters were processed to determine the origin of pollen transport.
From a total of 2939 identified grains, 162 exotic grains of Fraxinus (ash), 65 of
Populus (poplar), 42 of Quercus (oak), 21 of Acer (alder), 18 of Taxus (yew), 3 of Fa-gus (beech), Pinus (pine), and Tsuga (hemlock), 2 of Carpinus (hornbeam), Platanus
15
(plane) and Picea (spruce), 1 of Juglans (walnut) and Carya (hickory), were deter-mined on the A10B1 filter corresponding to week 21 (19–25 May). This corresponds to a total of 325, representing 11.06 % of the total identified grains indicating a significant proportion of “exotic” grains.
From the second B filter, A10B2, corresponding to week 22 (26 May–1 June), a total
20
of 3955 grains were identified. Among them, 12 exotic grains of Fraxinus (ash), 5 of
Quercus (oak), 3 of Acer (maple), and of Tsuga (hemlock), 2 of Fagus (beech), and of Pinus (pine), 1 Carpinus (hornbeam), Platanus (plane) and of Populus (poplar), were
counted corresponding to a total of 30, which is 0.76 % of the identified grains.
Our new results clearly indicate that the pollen captured on the exposed filters at
25
Narsarsuaq, southern Greenland, was mainly transported during week 21 even if some minor transport occurred during week 22. Indeed, besides oak, beech, hornbeam, walnut and especially hemlock and hickory which absolutely indicate North America
BGD
2, 829–847, 2005 Pollen transport to Greenland D.-D. Rousseau et al. Title Page Abstract Introduction Conclusions References Tables Figures J I J I Back CloseFull Screen / Esc
Print Version Interactive Discussion
EGU
as the potential source of the pollen, observed in 2002, poplar, yew, ash, plane and spruce combined with the previous ones, also growing in eastern North America, were recorded for the first time in the 2003 exposed filters (Thompson et al., 1999a, 1999b). In eastern America, these trees flower between weeks 15 and 31 according to the pollen capture recorded in the Toronto area, southern Canada, by Cambon (Cambon,
5
1994; Cambon et al., 1992). Therefore, the air volumes, responsible for the pollen transport during weeks 21 and 22, must have passed over the growing areas when these arboreal taxa were dispersing pollen into the atmosphere.
3.2. Backward trajectories
Backward trajectories, with duration of 314 h, were obtained for the selected 14 days,
10
performed once a day at 12:00 UTC at Narsarsuaq during weeks 21 and 22. These provide a comparison with the compiled distribution of the observed trees (Thompson et al., 1999a, 1999b), allowing the most probable candidates for pollen transport to be selected. Three different altitudes were requested for the model at the deposition loca-tion: at ground level, at 1000 and 3000 m. The compilation of the HYSPLIT backward
15
trajectories for week 21 shows that two air volumes passed over the northern limit of the compiled distribution range of the identified trees in North Eastern America. These air volumes reached southern Greenland on 20 and 21 May 2003 (Figs. 3a, 3b and 4a, 4b), and are referred to here as AV (air volume) 20 and AV21, respectively. According to HYSPLIT, the pollen grains were uplifted to the 850 hPa level (about 1500 m above
20
ground level) on 14 and 16 May (AV20), as well as on 13 and 16 May (AV21) (Figs. 3b, 3c and 4b, 4c). The pollen grains were then transported northward to Narsarsuaq after crossing Ontario and Quebec provinces. It is evident that the pollen deposited on 20 May appears to have been released at Narsarsuaq one day later than that recorded on 21 May because of a different trajectory inducing a longer transport. On both dates, 21
25
and 22 May, the pollen grains reached the filter station with an air volume passing over Greenland at an altitude of 3000 m (Figs. 3a and 4a). They however deposited with downward air movements associated with 0.1 mm/h during 2 h and 0.3 mm/h during
BGD
2, 829–847, 2005 Pollen transport to Greenland D.-D. Rousseau et al. Title Page Abstract Introduction Conclusions References Tables Figures J I J I Back CloseFull Screen / Esc
Print Version Interactive Discussion
EGU
11 h rain respectively in the morning. Analysis of the 3D backward trajectories shows that few downward air motions occurred during the transport by AV21 while stronger downward motions occurred during that of AV20 (Figs. 3c and 4c). The pollen record at Narsarsuaq cannot separate the relative proportions in every air volume as the trans-ported pollen grains were deposited on the same filter. Furthermore, the duration of
5
the filter exposure is not useful for explaining the higher number of exotic pollen grains recorded in week 21 than in week 22, as it is the same, 7 days. Nevertheless, for week 22, the HYSPLIT model indicates two possible scenarios for, only one single day of de-position in southern Greenland, 27 May. The air volume selected is the one reaching Narsarsuaq between ground level and 100 m (Fig. 5a). Light rain of 0.1 mm/h during
10
2 h is associated with the deposition of the pollen grain. Upward air movements were lifting the pollen grains to an altitude between 500 and 1000 m in 15 May (Figs. 5b, 5c), and light downward air motion released the transported grains on the filters (Fig. 5c). HYSPLIT results also propose another possibility, which concerns trees with a more northern limit. Indeed, the model shows that an air volume passed over such an area
15
in 23 and 24 May, when the pollen grains were released at higher altitude than indicated for the ground-100 m level (Fig. 6a). This other air volume could have transported them to Greenland over the Canadian Arctic, and released the pollen at Narsarsuaq at an altitude of 3000 m (Figs. 6b, 6c), as observed in previous analyses. Strong upward air motion occurred during the pollen emission, while weak downward movements, still
as-20
sociated with light 0.1 mm/h rain during 6 h in the morning, permitted pollen deposition over Narsarsuaq.
4. Discussion and conclusion
The total of transported grains counted is much more important during week 21 than during week 22. Several possibilities may explain such marked differences. Firstly,
25
according to previous investigations on the northern growth limit of these trees, the maximum pollen emission is strongly reduced in week 22 (Cambon, 1994; Cambon
BGD
2, 829–847, 2005 Pollen transport to Greenland D.-D. Rousseau et al. Title Page Abstract Introduction Conclusions References Tables Figures J I J I Back CloseFull Screen / Esc
Print Version Interactive Discussion
EGU
et al., 1992), inducing less pollen release into the atmosphere. Secondly, the meteo-rological conditions for pollen capture could have been less favorable during week 22 leading to a reduction in pollen transport (weak upward air movements). Thirdly, even if favorable conditions for pollen capture had been available, downward air motion in-ducing deposition on the filters was almost absent. Fourthly, wash out by rain during
5
the transportation to Greenland, associated to turbulence effects would have imply a serious reduction in the number of pollen grains remaining in the air volume reaching southern Greenland. Finally, the record observed in week 21 is much more important in terms of grains counted than previously observed, and is almost solely contributing to the total amount.
10
Our results clearly indicate that during two consecutive weeks, from 19 May until 1 June, again pollen grains originating from North America were transported by air volumes reaching southern Greenland at 3000 m, where they were deposited on the exposed filters at Narsarsuaq associated with noticeable wash out. However, the occur-rence of hemlock in the filter exposed during week 22, (26 May to 1 June), originating
15
from Northeastern America (Thompson et al., 1999a, 1999b), supports the occurrence of low altitude transport not previously recorded. Indeed the responsible air volume reaching southern Greenland was moving between ground level and 100 m, according to the HYSPLIT model. Indeed, Barry et al. (1981) point out that horizontal transport depends upon the differential transportability of the pollen grains, meteorological
fac-20
tors related to the trajectory at a particular altitude and wash out probability. This new finding of very long distance transport to Southern Greenland, while the previously described transports to southern Greenland and North Pole, using this method, were involving air volumes passing at respectively 1000 and 3000 m over the deposition area (Rousseau et al., 2003, 2004). This altitudinal range is between the boundaries
pro-25
posed by Barry et al. (1981) concerning the upward dispersion of pollen which they assumed required altitudes between 1500 m and 3000 m, the pollen grains in our in-vestigation were lifted up between 500 and 1000 m.
favor-BGD
2, 829–847, 2005 Pollen transport to Greenland D.-D. Rousseau et al. Title Page Abstract Introduction Conclusions References Tables Figures J I J I Back CloseFull Screen / Esc
Print Version Interactive Discussion
EGU
able for the pollen grains deposited during week 21 (stronger upward and downward air velocity) than week 22, especially for the capture by the air volumes passing over the growing areas of the trees. This could partly explain, the difference in pollen grains identified on the respective filters. Indeed, Figs. 3, 4, 5 and 6 all show that pollen cap-ture by the respective identified air volumes occurred mainly at about noon when the
5
conditions for higher emission were favorable (Cour et al., 1993). This supports the numerical modeling results of pollen dispersion by Helbig et al. (2004) indicating that in a source area, the maximum pollen concentration, and thus the probability of stronger capture by an air volume, is reached at 12:00 CET. Conversely, at night, pollen emis-sion and thus the concentration are considerably reduced. Furthermore, the greater
10
abundance of exotic pollen grains identified at Narsarsuaq during the first week is also related to the most favorable period of pollen emission during that interval, very close to the peak pollen emission for most of the identified trees. Meanwhile, pollen emis-sion during the second week was considerably lower, occurring at the end of the pollen production interval, as well as the transport conditions being less favorable. Indeed,
15
important rain occurred during the transport, reaching up to 2.6 mm/h which is largely enough to remove most of the pollen present in the concerned air volume (Barry et al., 1981). Thus, our results show that two different air volume trajectories permitted the transport of exotic pollen grains to southern Greenland in 2003 from Northeastern America. These air volumes are connected with different altitudes leading to a more
20
difficult modeling than originally expected or previously recorded. If the main transport remains mostly linked to an air volume passing over the filters at 3000 m, the pattern of the trajectories in 2003 is different from one week to another, and therefore different from that recorded in 2002.
If the transport of pollen grains from Northeastern America to Greenland might be
25
constant, more experiments are necessary to check its regularity, and to validate the usefulness of such results for paleoclimatic studies, our results showing some variabil-ity in the timing of deposition of these exotic grains in Greenland. Indeed as models of pollen dispersion and transport are available and reliable on local or regional scales
BGD
2, 829–847, 2005 Pollen transport to Greenland D.-D. Rousseau et al. Title Page Abstract Introduction Conclusions References Tables Figures J I J I Back CloseFull Screen / Esc
Print Version Interactive Discussion
EGU
(Helbig et al., 2004; McCartney and Lacey, 1991; Sugita, 1993), modeling transport over longer (several thousands of kilometers) distances requires more sophisticated parameterization as these that our results clearly show. Furthermore the general pat-tern observed today can be considered as a control for modeling the last 20 000 years and future climatic conditions affecting the distribution of North American temperate
5
trees (Overpeck et al., 2003; Shafer et al., 2001; Williams et al., 2004).
Acknowledgements. This study was carried out thanks to financial support from the French
Polar Institute (IPEV). We thank A. J. Chepstow-Lusty and the Boulder 34th International Arc-tic Workshop parArc-ticipants for comments and remarks. The first author completed this paper during a stay at the University of Bayreuth thanks to a von Humboldt research award. This is
10
ISEM contribution 2004-xxx and LDEO contribution YY. The authors gratefully acknowledge the NOAA Air resources laboratory (ARL) for the provision of the HYSPLIT transport and dispersion model and/or READY web site (http://www.arl.noaa.gov/ready.html) used in this publication.
References
Andrews, J. T., Mode, W. N., and Davis, P. T.: Holocene climate based on pollen
transfer-15
functions, Eastern Canadian Arctic, Arct. Alp. Res., 12, 41–64, 1980.
Barry, R. G., Elliott, D. L., and Crane, R. G.: The palaeoclimatic interpretation of exotic pollen peaks in Holocene records from the eastern Canadian Arctic: a discussion, Rev. Palaeobot. Palynol., 33, 153–167, 1981.
Bourgeois, J. C.: Seasonal and interannual pollen variability in snow layers of arctic ice caps,
20
Rev. Palaeobot. Palynol., 108, 17–36, 2000.
Bourgeois, J. C., Koerner, R. M., and Alt, J. C.: Airborne pollen: A unique air mass tracer, its influx to the Canadian high Arctic, Ann. Glaciol., 7, 109–116, 1985.
Bourgeois, J. C., Gajewski, K., and Koerner, R. M.: Spatial patterns of pollen deposition in arctic snow, J. Geophys. Res., 106, 5255–5265, 2001.
25
Cambon, G.: Modern pollen spectra and vegetation in southern Ontario, Canada., Rev. Palaeobot. Palynol., 82, 147–155, 1994.
Cambon, G., Ritchie, J. C., and Guinet, P.: Pollen marqueur de transports `a longue distance dans l’atmosph `ere du sud de l’Ontario (Canada), Can. J. Bot., 70, 2284–2293, 1992.
BGD
2, 829–847, 2005 Pollen transport to Greenland D.-D. Rousseau et al. Title Page Abstract Introduction Conclusions References Tables Figures J I J I Back CloseFull Screen / Esc
Print Version Interactive Discussion
EGU
Campbell, I. D., McDonald, K., Flannigan, M., and Kringayark, J.: Long-distance transport of pollen into the Arctic, Nature, 399, 29–30, 1999.
Cour, P.: Nouvelles techniques de d ´etection des flux et des retomb ´ees polliniques: Etude de la s ´edimentation des pollens et des spores `a la surface du sol, Pollen et Spores, 16, 103–141, 1974.
5
Cour, P., Cambon, G., Ferrier, J., Duzer, D., Janzon, L., Quet, L., Loublier, Y., Olivier, J., and Gros, R.: Calendriers polliniques de l’Europe occidentale, r ´egion m ´editerran ´eenne comprise, in: Pollen et allergies, edited by: Gu ´erin, B., Bousquet, J., Cour, P., Evrard, Gu ´erin, F., Nolard, N., Peltre, G., and Sell, Y., Allerbio, Varennes-en-Argonne, 1993.
Draxler, R. R. and Hess, G. D.: An overview of the Hysplit 4 modelling system for trajectories,
10
dispersion and deposition, Aust. Met. Mag., 47, 295–308, 1998.
Franzen, L. G., Hjelmroos, M., Kallberg, P., Brorstromlunden, E., Juntto, S., and Savolainen, A. L.: The yellow-snow episode of Northern Fennoscandia, March 1991. A case-study of long-distance transport of soil, pollen and stable organic-compounds, Atmos. Env., 28, 3587– 3604, 1994.
15
Gajewski, K.: Modern and Holocene pollen assemblages from some small Arctic lakes on Somerset Island, NWT, Canada, Quat. Res., 44, 228–236, 1995.
Helbig, N., Vogel, B., Vogel, H., and Fiedler, F.: Numerical modelling of pollen dispersion on the regional scale, Aerobiologia, 3, 3–19, 2004.
Hicks, S., Tinsley, H., Huusko, A., Jensen, C., H ¨attestrand, M., Gerasimides, A., and Kvavadze,
20
E.: Some comments on spatial variation in arboreal pollen deposition: first records from the Pollen Monitoring Programme (PMP), Rev. Palaeobot. Palynol., 117, 183–194, 2001. Hjelmroos, M. and Franzen, L. G.: Implications or recent long-distance pollen transport events
for the interpretation of fossil pollen records in Fennoscandia, Rev. Palaeobot. Palynol., 82, 175–189, 1994.
25
Hult ´en, E.: Vascular cryptogams, conifers, Monocotyledon, Almqvist & Wiksell, Stockholm, 1964.
Hult ´en, E. and Fries, M.: Atlas of North European vascular plants, Koeltz scientific books, 1986. HYSPLIT4Model: (HYbrid Single-Particle Lagrangian Integrated Trajectory) http://www.arl.
noaa.gov/ready/hysplit4.html, NOAA Air Resources Laboratory, Silver Spring, MD, 1997.
30
Jacobs, J. D., Mode, W. N., and Dowdeswell, E. K.: Contemporary pollen deposition and the distribution of Betula glandulosa at the limit of low arctic tundra in Southern Baffin Island, Nwt, Canada, Arct. Alp. Res., 17, 279–287, 1985.
BGD
2, 829–847, 2005 Pollen transport to Greenland D.-D. Rousseau et al. Title Page Abstract Introduction Conclusions References Tables Figures J I J I Back CloseFull Screen / Esc
Print Version Interactive Discussion
EGU
Janssen, C. R.: Local and regional pollen deposition, in: 0Quaternary plant Ecology, edited by: Birks, J. H. B. and West, R. G., Blackwell Scientific, Oxford, 1973.
McCartney, H. A. and Lacey, M. E.: Wind dispersal of pollen from crops of oilseed rape
(Bras-sica napus L.), J. Aerosol Sci., 22, 467–477, 1991.
Nichols, H.: Pollen diagrams from Sub-Arctic Central Canada, Science, 155, 1665–1668, 1967.
5
Overpeck, J., Whitlock, C., and Huntley, B.: Terrestrial biosphere dynamics in the climate sys-tem: Past and future, in: Paleoclimate, global change and the future”, edited by: Alverson, K. D., Bradley, R. S., and Pedersen, T. F., Springer, Heidelberg, 2003.
Ritchie, J. C.: Modern pollen assemblages near arctic tree Line, Mackenzie Delta Region, Northwest-Territories, Can. J. Bot., 52, 381–396, 1974.
10
Ritchie, J. C. and Lichti-Federovich, S.: Pollen dispersal phenomena in Arctic-Subarctic Canada, Rev. Palaeobot. Palynol., 3, 255–266, 1967.
Ritchie, J. C., Hadden, K. A., and Gajewski, K.: Modern pollen spectra from lakes in Arctic Western Canada, Can. J. Bot., 65, 1605–1613, 1987.
Rousseau, D. D., Duzer, D., Cambon, G., Ferrier, J., Gros, R., and Jolly, D.: La pluie pollinique
15
au Groenland, Rap. activit ´e IPEV, 51–58, 2001.
Rousseau, D. D., Duzer, D., Etienne, J. L., Cambon, G., Jolly, D., Ferrier, J., and Schevin, P.: Pollen record of rapidly changing air trajectories to the North Pole, J. Geophys. Res., 109, doi:10.1029/2003JD003985, 2004.
Rousseau, D. D., Duzer, D., Cambon, G., Jolly, D., Poulzen, U., Ferrier, J., Schevin, P., and
20
Gros, R.: Long distance transport of pollen to Greenland, Geophys. Res. Lett., 30, 1766, doi: 10.1029/2003GL017539, 2003.
Shafer, S. L., Bartlein, P. J., and Thompson, R. S.: Potential changes in the distributions of western NorthAmerica tree and shrub taxa under future climate scenarios, Ecosystems, 4, 200–215, 2001.
25
Short, S. K. and Holdsworth, G.: Pollen, oxygen isotope content and seasonality in an ice core from the Penny ice cap, Baffin Island, Arctic, 38, 214–218, 1985.
Stohl, A., Eckhardt, S., Forster, C., James, P., Spichtinger, N., and Seibert, P.: A replacement for simple back trajectory calculations in the interpretation of atmospheric trace substance measurements, Atmos. Env., 36, 4635–4648, 2002.
30
Sugita, S.: A model of pollen source area for an entire lake surface, Quat. Res., 39, 239–244, 1993.
BGD
2, 829–847, 2005 Pollen transport to Greenland D.-D. Rousseau et al. Title Page Abstract Introduction Conclusions References Tables Figures J I J I Back CloseFull Screen / Esc
Print Version Interactive Discussion
EGU
parameters and distributions of important trees and shrubs in North America; introduction and conifers, U. S. Geological Survey, Denver, 1999a.
Thompson, R. S., Anderson, K. H., and Bartlein, P. J.: Atlas of relations between climatic parameters and distributions of important trees and shrubs in North America; harwoods, US Geological Survey, Denver, 1999b.
5
Williams, J. W., Shuman, B. N., Webb, T., Bartlein, P. J., and Leduc, P. L.: Late-Quaternary vegetation dynamics in North America: Scaling from taxa to biomes, Ecol. Monogr., 74, 309–334, 2004.
BGD
2, 829–847, 2005 Pollen transport to Greenland D.-D. Rousseau et al. Title Page Abstract Introduction Conclusions References Tables Figures J I J I Back CloseFull Screen / Esc
Print Version Interactive Discussion EGU 80 60 40 80 60 40 -120 -90 -60 30 0 1000 km -47 -46 -45 -44 61 61 -47 -46 -45 -44 0 10 km
Narsarsuaq
BGD
2, 829–847, 2005 Pollen transport to Greenland D.-D. Rousseau et al. Title Page Abstract Introduction Conclusions References Tables Figures J I J I Back CloseFull Screen / Esc
Print Version Interactive Discussion
EGU
BGD
2, 829–847, 2005 Pollen transport to Greenland D.-D. Rousseau et al. Title Page Abstract Introduction Conclusions References Tables Figures J I J I Back CloseFull Screen / Esc
Print Version Interactive Discussion EGU 1000 925 850 700 500 400 300 250 200 150 100 50 20 -15.00 -13.00 -11.00 -9.00 -7.00 -5.00 -3.00 -1.00 1.00 3.00 5.00 7.00 9.00 11.00 13.00 15.00 17.00 2 0 M a y 1 9 M a y 1 8 M a y 1 7 M a y 1 6 M a y 1 5 M a y 1 4 M a y 1 3 M a y 1 2 M a y 1 1 M a y 1 0 M a y 0 9 M a y
C
2005 1905 1805 1705 1605 1505 1405 1305 1205 1105 1005 0905 0805 2 0 M a y 1 9 M a y 1 8 M a y 1 7 M a y 1 6 M a y 1 5 M a y 1 4 M a y 1 3 M a y 1 2 M a y 1 1 M a y 1 0 M a y 0 9 M a y 0 8 M a y 0 1000 3000 1500 3000 4500 7500 6000 NarsarsuaqA
B
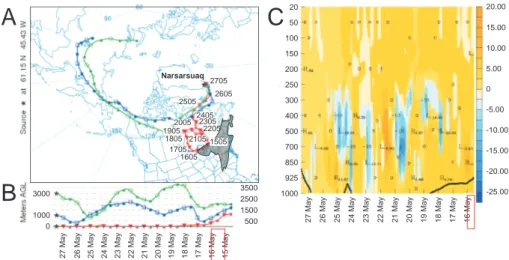
Fig. 3. Long distance transport to Narsarsuaq on 20 May 2003. (A) Backward trajectories
provided by the HYSPLIT model (HYSPLIT4Model, 1997) of air volumes reaching Narsarsuaq (61.15◦N, 45.43◦W, 1 m a.s.l.) at different altitudes: ground level (red), 1000 m (blue) and 3000 m (green) on 20 May 2003. The grey area in eastern USA and south-eastern Canada represents the zone where “exotic” trees are all growing (from Thompson et al., 1999b, 1999a). The “3000 m” air volume passed over this area.(B) Altitudinal variation of the three air volumes
used in the backward trajectories analysis. The “3000 m” air volume over Narsarsuaq on 20 May 2003, was at a lower elevation on 14 and 16 May, when it passed over the area where “exotic” trees are growing. The red box indicates the time span when the potential uplift of the pollen was possible. (C) Updrafts and downdrafts in the atmosphere. Velocity of the air
volume passing over growing area in Eastern America which reached Narsarsuaq at 3000 m on 20 May 2003 versus time (see Fig. 3a for the geographic trajectory). Yellow to brown values indicate upward movements, whereas light blue to pink indicate downward movements. The dark line corresponds to the selected air volume. The light colored red box characterizes the timing of the uplift of the pollen within the potential interval corresponding to the selected air volume passing over the growing area.
BGD
2, 829–847, 2005 Pollen transport to Greenland D.-D. Rousseau et al. Title Page Abstract Introduction Conclusions References Tables Figures J I J I Back CloseFull Screen / Esc
Print Version Interactive Discussion EGU 1000 925 850 700 500 400 300 250 200 150 100 50 20 -25.00 -20.00 -15.00 -10.00 0 -5.00 5.00 10.00 20.00 15.00 25.00
20 May 19 May 18 May 17 May 16 May 15 May 14 May 13 May 12 May 11 May 10 May
21 May 2005 1905 1805 1605 1505 1405 1305 1205 1105 1005 0905 2105
20 May 19 May 18 May 17 May 16 May 15 May 14 May 13 May 12 May 11 May 10 May 09 May
21 May 0 1000 3000 1500 3000 4500 Narsarsuaq 1805 15 1 1705
C
A
B
Fig. 4. Long distance transport to Narsarsuaq on 21 May 2003. (A) Backward trajectories for
21 May 2003 (see Fig. 3).(B) Altitudinal variation of the three air volumes used in the backward
trajectories analysis. The “3000 m” air volume over Narsarsuaq on 20 May 2003, was at a lower elevation on 13 and 16 May, when it passed over the area where “exotic” trees are growing (see Fig. 3).(C) Updrafts and downdrafts in the atmosphere (see Fig. 3).
BGD
2, 829–847, 2005 Pollen transport to Greenland D.-D. Rousseau et al. Title Page Abstract Introduction Conclusions References Tables Figures J I J I Back CloseFull Screen / Esc
Print Version Interactive Discussion
EGU
26 May 25 May 24 May 23 May 22 May 21 May 20 May 19 May 18 May 17 May 16 May
27 May 1000 925 850 700 500 400 300 250 200 150 100 50 20 -25.00 -20.00 -15.00 -10.00 0 -5.00 5.00 10.00 20.00 15.00 2705
26 May 25 May 24 May 23 May 22 May 21 May 20 May 19 May 18 May 17 May 16 May 15 May
27 May Narsarsuaq 2605 2505 2405 2305 2205 2105 2005 1905 1805 1705 1605 1505 0 1000 3000 2500 3500 1500 500
C
A
B
Fig. 5. Long distance transport to Narsarsuaq on 27 May 2003. First scenario. (A) Backward
trajectories for 27 May 2003. The “ground to 300 m” air volume passed over this area (see Fig. 3). (B) Altitudinal variation of the three air volumes used in the backward trajectories
analysis. The “ground to 300 m” air volume over Narsarsuaq on 27 May 2003, was at a higher elevation on 15 May, when it passed over the area where “exotic” trees are growing (see Fig. 3).
(C) Updrafts and downdrafts in the atmosphere. Velocity of the air volume passing over growing
area in Eastern America which reached Narsarsuaq at “ground level-300 m” on 27 May 2003 versus time (see Fig. 3).
BGD
2, 829–847, 2005 Pollen transport to Greenland D.-D. Rousseau et al. Title Page Abstract Introduction Conclusions References Tables Figures J I J I Back CloseFull Screen / Esc
Print Version Interactive Discussion
EGU
26 May 25 May 24 May 23 May 22 May 21 May 20 May 19 May 18 May 17 May 16 May
27 May 1000 925 850 700 500 400 300 250 200 150 100 50 20 -12.00 -10.00 0 -8.00 2.00 10.00 4.00 6.00 8.00 -6.00 -4.00 -2.00 -14.00 -16.00
26 May 25 May 24 May 23 May 22 May 21 May 20 May 19 May 18 May 17 May 16 May 15 May
27 May Narsarsuaq 0 1000 3000 2500 3500 1500 500 2705 2605 2505 2405 2305 2205 2105 2005 1905 1805 1705 1605 1505 2605 2505 2405 2305 2205 2105
C
A
B
Fig. 6. Long distance transport to Narsarsuaq on 27 May 2003. Second scenario. (A)
Back-ward trajectories for 27 May 2003 . The “3000 m” air volume passed over the northern range of pine, poplar, and Taxaceae distribution (see Fig. 3). (B) Altitudinal variation of the three air
volumes used in the backward trajectories analysis. The “3000 m” air volume over Narsarsuaq on 27 May 2003, was at a higher elevation on 24 May, when it passed over the northern range of the area where “exotic” trees are growing (see Fig. 3). (C) Updrafts and downdrafts in the
atmosphere. Velocity of the air volume passing over the northern range of the growing area of some exotic trees in Northern America which reached Narsarsuaq at “3000 m” on 27 May 2003 versus time (see Fig. 3).