HAL Id: hal-01618297
https://hal.archives-ouvertes.fr/hal-01618297
Submitted on 15 Nov 2017
HAL is a multi-disciplinary open access
archive for the deposit and dissemination of
sci-entific research documents, whether they are
pub-lished or not. The documents may come from
teaching and research institutions in France or
abroad, or from public or private research centers.
L’archive ouverte pluridisciplinaire HAL, est
destinée au dépôt et à la diffusion de documents
scientifiques de niveau recherche, publiés ou non,
émanant des établissements d’enseignement et de
recherche français ou étrangers, des laboratoires
publics ou privés.
A new supercritical co-injection process to coat
microparticles
Marilyn Calderone, Élisabeth Rodier, Hubert Lochard, Florence Marciacq,
Jacques Fages
To cite this version:
Marilyn Calderone, Élisabeth Rodier, Hubert Lochard, Florence Marciacq, Jacques Fages. A new
su-percritical co-injection process to coat microparticles. Chemical Engineering and Processing: Process
Intensification, Elsevier, 2008, 47 (12), p.2228-2237. �10.1016/j.cep.2007.12.001�. �hal-01618297�
A new supercritical co-injection process to coat microparticles
Marilyn Calderone
a, Elisabeth Rodier
a,∗, Hubert Lochard
b,
Florence Marciacq
b, Jacques Fages
aaRAPSODEE Research Centre, UMR EMAC-CNRS 2392, ´Ecole des Mines d’Albi, Campus Jarlard, 81013 Albi, France bPierre Fabre Plantes et Industrie, 16 rue Jean Rostand, 81603 Gaillac, France
Abstract
A new supercritical co-injection process has been developed to coat microparticles. The process was first set up with micron-sized glass beads as model particles and then applied to two powdered active pharmaceutical ingredients. A lipid was used as coating material. The mass balance core/shell in the obtained particles was performed using both differential scanning calorimetry (DSC) and pycnometry measurements and showed a good reproducibility of the process when particles above 20 !m size were considered. Fourier transform infrared (FT-IR) spectra and environmental scanning electronic microscope (ESEM) characterization were used to ensure that a shell of coating surrounded the raw particles. Both methods showed a different deposition mode of the lipid between the coated particles and a physical mixture of glass beads and lipid. Release tests in distilled water performed with coated active compounds showed a slowed down dissolution kinetics. The study of the polymorphism of the crystallized lipid revealed a solid/solid transition with time. The supercritical co-injection process is a promising way to discretely coat particles with relatively low diameters (20–50 !m) and is particularly suited to coat sensitive pharmaceutical molecules such as proteins.
Keywords:Supercritical fluid; Co-injection; Coating; Polymorphism; Lipid; Microparticles
1. Introduction
Microencapsulation of active pharmaceutical ingredient (API) is a technique mostly used for controlled or targeted release, in order to mask a bitter taste, to protect a sensitive API from its external environment or to isolate it from another reactive molecule in a pharmaceutical formulation[1]. A review of microencapsulation processes can be found in Ref.[2]. Most of the microencapsulation techniques require organic solvent or involve drastic conditions in terms of temperature, pressure or pH. Besides, it appears that all processes used to coat particles under 50 !m have a common feature: the coating agent and the material to be coated are processed into the same media. Hence, sensitive molecules might be degraded during the encapsulation process. For example, the emulsion solvent evaporation process
Abbreviations: API, active pharmaceutical ingredient; BSA, bovine serum albumin; ESEM, environmental scanning electronic microscope; FT-IR, Fourier transform infrared; PE, pseudoephedrine chlorhydrate; SCF, supercritical fluid.
∗ Corresponding author. Tel.: +33 5 63 49 31 25; fax: +33 5 63 49 30 25.
E-mail address:[email protected](E. Rodier).
is performed by mixing at relatively high temperature both the dissolved active compound and the polymer into the same ves-sel[3]. Thus, uncoated particles get in contact with the organic solvent used to dissolve the coating polymer, and may suffer from heating. In the fluidization process and its variations such as the W¨urster one, uncoated particles are fluidized into a cham-ber where the internal high temperature allows evaporation of the organic solvent and solidification of the coating onto the particles[4]. Consequently, this process might not be suited to thermo sensitive API’s.
Supercritical fluids and especially supercritical CO2display
excellent solute properties in a large range of materials and were found to be worthy to generate solvent-free particles[5]. An implementation of this property is well known under the PGSS acronym, particles from gas saturated solution[6]. Briefly, the process involves the dissolution of a dense gas into a liquid or a molten solid until its saturation. The expansion of such a saturated solution or molten phase creates a high super saturation and a sharp temperature decrease leading to particles or droplets formation. After expansion, CO2becomes gaseous and is easily
are useless, PGSS is an attractive process for powder generation. It turns out to generate micron- or nano-sized particles with a controlled size range and morphology. Besides, saturating a solid with a high-pressure fluid usually allows to decrease its normal melting point up to 40 K and thus to lower energetic costs[7].
This principle has been applied for coating applications. For instance, Perrut placed the following uncoated solid APIs: oval-bumin, acid ascorbic or lactase and the coating material, a fat, into the same vessel. The expansion of the mixture caused the solidification of the lipid onto the particles and then the forma-tion of a surrounding shell onto the active compound[8]. Even if the encapsulation was successful, this interesting solvent-free process presents the drawback that the pharmaceutical molecule is heated for a consequent duration in the vessel with the coat-ing. In another implementation of the PGSS process, droplets were coated by a powdered material to allow the handling of a solid form instead of a liquid one[9]. In this case, supercritical CO2 was dissolved in a liquid. The saturated liquid was then
expanded to form fine droplets. A powder was carried just at the liquid outlet. The entrapment of liquid droplets by solid par-ticles gave solid–liquid-designed forms. This implementation was named concentrated powder form (CPF) and was applied, for example, to form silica/water-designed particles[10].
The co-injection process presented in this paper is a new route to form microcapsules[11]. It involves first, the dissolu-tion of a pressurized gas into a solid fat in order to easily melt it at relatively low temperatures and second, the expansion of the sat-urated melted phase and the excess of pressurized fluid onto solid particles. Its main specificity is that the uncoated particles are kept at ambient temperature and therefore, are prevented from any degradation. The contact between the uncoated particles and the pulverized fat occurs in a custom-designed co-injection device, which further allows the deposition of the coating onto the particles. The uncoated particles were conveyed to the co-injection device by a Venturi system alimented by pressurized air. Alternatively conveying the particles with pressurized CO2
from a high-pressure vessel was also experimented. The chosen coating agent was Precirol®, a commercial mixture of di- and
triglycerides. In a first time, the process was applied to glass beads as model particles; then it was tested to coat cohesive active compounds. The polymorphism of the crystallized fat was also investigated during shell life. Indeed, it is well estab-lished that fatty products may exhibit ageing effect, whereby a range of physical properties may change during storage
[12].
2. Materials and methods
Precirol® ATO 5 (Glycerol dipalmitostearate, Gattefoss´e,
France) was used as coating material for this study. Precirol®is
a mixture of mono-, di- and triglycerides and contains mainly a diglyceride (51.6 wt%) with one C16 (48.9%) and one C18 (48.8%) fatty acid saturated chains. Precirol®is widely used as
filler into pharmaceutical formulations and is found to be safe
[13,14].
CO2N45 TP was supplied by Air Liquide (99.6% pure, Air
Liquide, France) and used as supplied.
Because of their spherical shape, controlled size and smooth surface, glass beads (0–80 !m, Sovitec, France) were first used as model particles. They were considered as model in terms of flow ability, controlled size distribution and non-cohesive behaviour. Before coating experiments, glass beads were sieved into the six following size fractions: <20, 20–30, 30–40, 40–50, 50–63 and 63–80 !m. Pseudoephedrine chlorhydrate (PE) and bovine serum albumin (BSA) were supplied by Pierre Fabre Laboratories (Plantes et Industries, France). PE is a white cohesive powder, whereas BSA particles are large translucent pellets.
2.1. Characterization of particles size, shape and morphology
A thin film deposited onto the particles must lead in an increase of their average diameters. Thus, particle size and particle size distribution were determined before and after the coating experiments. Particle diameter was measured using an Aerosizer®PSD 3603 particle size distribution analyser (TSI,
USA). This apparatus measures the time it takes for a particle to be accelerated through two laser beams, in a fixed laminar flow. It is accurate for the lower part of the size distribution (under 100 !m); in the higher part, a big single particle may diffract significantly laser beam thus perturbing the measure-ment. As a consequence, the average volume diameter, D[4;3], can be mistaken, and we have chosen to evaluate the change in particle size considering the median diameter D50, which is less
affected by this perturbation. The results are presented together with the cumulated volume size distributions and with regard to the distribution span. The span is defined by the following rela-tion (D90− D10)/D50, and reflects the width of the distribution [15]. A particle size distribution analysis of these results was presented in Ref.[16].
ESEM, environmental scanning microscope XL 30 FEG (Philips, Netherlands) was used to visualize the deposition of Precirol® onto the particles. Samples were sputter coated with gold 2-nm thick, in high vacuum, using a sputter coater prior to SEM analysis.
X-ray powder diffraction patterns of the starting materials and the coated glass beads were recorded on a X’pert diffractometer (Philips, Netherlands), at a scan rate of 0.5◦min−1over the range
2–40◦. Samples were analyzed in duplicate.
Infrared spectra were recorded with a 2000 FT-IR equipped Spectrum V.5.0.1 software (PerkinElmer, UK). Disks were obtained by grinding 100 mg of dry KBr with 1 mg of studied sample. Spectra were acquired in the range 4000–400 cm−1. 2.2. Characterization of product composition
Differential scanning calorimetry DSC 7 (PerkinElmer, UK) allowed to quantify the mass of deposited Precirol® onto the
particles. For DSC measurements, a sample of about 5 mg was placed into an aluminium DSC pan. The temperature increases from 293.15 to 363.15 K at a heating rate of 5 K/min under nitro-gen flow. The amount of Precirol® was determined from the relation(1):
x= !H
coating agent onto the sample melting
!Hmeltingpure coating agent (1)
In(1), x represents the mass ratio of the coating agent in the coated particles. !Hmeltingcoating agent onto the sample, is the heat of fusion of Precirol®in the coated particles samples. !Hpure coating agent
melting ,
is the heat of fusion of Precirol®solidified alone via the same
supercritical fluid process. Relation(1)allows quantification of Precirol®deposited onto the particles, but the measurement was
done on a small fraction of the coated sample.
Then, quantification of the whole collected coated samples was performed via true density measurement using a helium pycnometer Accupyc 1330 (Micromeritics, USA). Density mea-surements of digive an evaluation of the mass ratio of coating
agent, fcoating agent, according to the relation(2)
1 dcoated particle = fcoating agent dcoating agent + 1 − fcoating agent duncoated particle (2) 2.3. Measurements of intrinsic dissolution rates
The coated samples dissolution tests were performed as fol-lows: five fractions of a given sample were placed into five flasks equipped with a magnetic stirrer and stirred at 100 rpm. 50 mL of distilled water at room temperature were introduced in each flask. An aliquot per flask was collected at different time intervals and filtered using Millex LH PTFE 0.45 !m filters (Millipore, USA). The UV absorption at 258 nm was then measured with a HP 8452A (PerkinElmer, UK).
3. Coating experiments: experimental set-up and procedure
Pressure and temperature conditions of crystallization of the coating material were studied in[17]. Briefly, the previous study showed that the Precirol®melting point could be decreased of 20 K, by solubilizing a dense gas in it. Precirol®normal melting
point was measured by calorimetry at 329.6 ± 0.4 K. The maxi-mum melting point depletion was reached for pressures equal to 11 MPa or above. Thus, in all the following coating experiments we fixed the pressure of the vessel at 11 MPa.
The experimental set-up is depicted inFig. 1. Before starting the experiments, uncoated particles were put into the container of a Venturi GVP12 (Coval, France) pressurized by an air injec-tion system at 0.7 MPa pressure. Solid Precirol® was placed
into a high-pressure vessel and the process was then ready to start. CO2coming from the cylinder (1), was liquefied (2) to be
pumped (3), then flowed through a heat exchanger (4) in order to be heated at 323.15 K. Supercritical CO2was then introduced
into the vessel (5) at 11 MPa, whereabouts it started to dissolve into solid Precirol®and melted the fat. The CO
2flowed
contin-uously for 30 min so as to reach equilibrium, while the pressure was maintained at 11 MPa. The saturated melted phase and an additional excess of supercritical CO2were then next expanded
through a valve at the Venturi inlet pressure. At the same time of this expansion, the valve (7) was opened to allow the
pneu-Fig. 1. Sketch of the co-injection coating process: the Venturi is used as bare particles conveying system.
matic conveying (8) of the uncoated particles to the co-injection device. Uncoated particles and expanded Precirol®get then into
contact in a designed co-injection device (9), as shown inFig. 2. Due to the high supersaturation generated, Precirol®solidified
onto the particles. The coated particles were then conveyed to a gas/solid separation filter (10). Gases escaped through the vent line, whereas the coated particles were collected into the separator for further analysis.
In another implementation of the previously described co-injection process, carbon dioxide was both used as carrying and solute gas, which allowed its re-use. Therefore uncoated particles were placed into a vessel filled up by gaseous CO2
at 2 MPa pressure. The coating process procedure was similar: when melted Precirol®was expanded, a valve at the bottom of
the vessel containing the raw particles was opened to push the material towards the co-injection device.
4. Results and discussion
4.1. Preliminary experiments
Before performing the coating experiments, both Precirol®
and glass beads were processed alone. Crystallization of the lipid by supercritical fluid was necessary to determine the aver-age size of the so-formed particles and gave information on the
Fig. 2. The co-injection device ensure the contact between the uncoated particles and the coating material expanded from the high-pressure vessel.
Table 1
Preliminary experiments: study of the SCF crystallization of Precirol® and
impact of the pressure on the glass beads diameter
Samples D[4;3] (!m)
Precirol®solidified by a SCF process 12.2 ± 0.4
Unprocessed Precirol® 43.0 ± 1.1
Glass beads before injection 45.9 ± 0.1 Glass beads after injection at 80 bars pressure 46.1 ± 0.3
polymorph obtained. Processing the particles through pressur-ized CO2was unavoidable to ensure that the conveying did not
alter particles.
When processing Precirol®, the experimental conditions
have been given previously. Unprocessed fat particles have a mean volume diameter of 43.0 ± 10.1 !m, whereas re-crystallized ones have a worthy lower mean volume diameter of 12.2 ± 0.4 !m (Table 1). The heat of fusion of re-crystallized Precirol®was measured by DSC immediately after its
process-ing and was found to be 114.4 ± 1.3 J/g. This value was the reference chosen for mass ratio calculation according to relation
(1).
As for the glass beads, the high-pressure vessel (6) was filled with glass bead particles and flowed to the co-injection device under gaseous carbon dioxide at a pressure of 8 MPa. The particle size distribution was measured before and after this treatment, so as to check that the process does not alter the parti-cles, neither by attrition nor by agglomeration (Table 1). Since a pressure of 8 MPa has no significant effect on the particles diam-eter, we assumed that there is no altering effect when particles were injected at a lower pressure.
4.2. Coating of the sieved glass beads: study of the homogeneity of a processed sample and of the reproducibility of the coating process
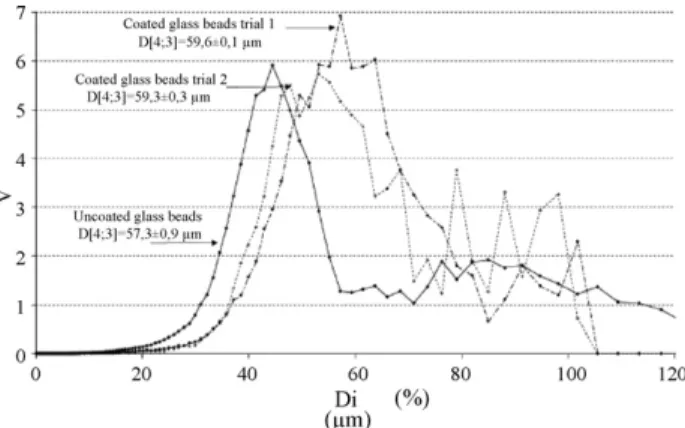
Fig. 3 depicts an example of particle size measurements obtained on the 50–63 !m sieved glass bead fraction. Trials one and two correspond to the same experiment repeated twice: 3 g of Precirol®were put in the autoclave and 3 g of glass beads were
injected by the compressed air alimented Venturi. The curves are
Fig. 3. Particle size distribution in volume percentage for the coated and uncoated 50–63 !m glass beads. The experiment was done using the Venturi as bare particle conveying device.
noised by the diffraction of the greatest particles. The standard deviation given for the mean volume diameter was calculated on the basis of three particles size measurements performed on the same sample. Considering both standard deviations of uncoated and of coated particles, it appears that the coated sam-ples get a higher diameter than the uncoated ones. This may be due to the deposit of a film of Precirol®onto the particles. This
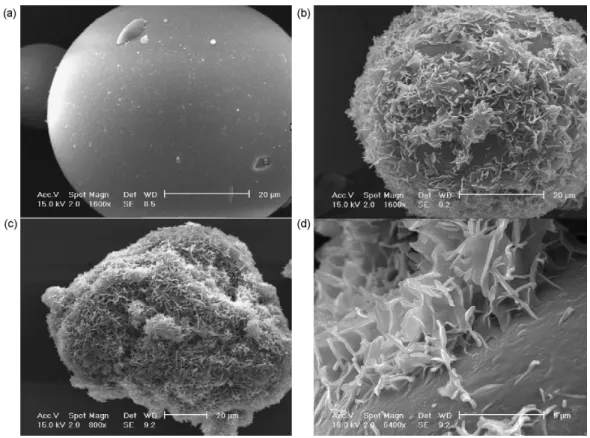
assumption is verified by ESEM investigations.Fig. 4(a) shows uncoated glass beads, whereasFig. 4(b) and (c) depict coated ones.Fig. 4(d) focuses on the surface of a coated glass bead. A crystallized fat layer can be seen on the bead surface.
The next three coating trials were performed on the small-est particles, i.e. under 20 !m. In this case, the particles were injected using gaseous CO2. Precirol®supplied weight
percent-age was equal to 33.3% of the total weight coating/glass beads. The three coating experiments were analyzed by particle size distribution, DSC and pycnometry.
Results for reproducibility discussion are depicted in
Table 2. The median diameter D50 of coated glass beads
was 16.0 ± 1.0 !m, whereas the D50 of bare particles was
13.4 ± 0.4 !m. The standard deviations on the entire population given were calculated on three different trials. Based on these values, the reproducibility of the process, on this first parame-ter was good. Considering now the mass percent deparame-termined by DSC according to relation(1), the weight of Precirol®deposited
onto the particles was evaluated at 19.2 ± 4.1%. This value was significantly lower than the one obtained by pycnometry accord-ing to Eq.(2): 27.7 ± 3%. Consequently, the relative uncertainty
of the co-injection process based on mass balance criteria was 10.9% when pycnometry characterization was performed, but reached 21.6% on the basis of the DSC measurements. The dif-ference between the results given by these two methods can be explained if one considers that DSC was performed on the 1000th part of a coated sample and pure Precirol®aggregates
were segregated in the whole sample and not taken for the DSC measurement. Thus, DSC gave information on the mass of fat deposited onto the particles excluding fat in excess. On the oppo-site, pycnometry was done on the whole sample. Therefore this measure took into account the present lipid, deposited or not onto the particles.
The value obtained, when compared to the global mass bal-ance, gives then a piece of information on the Precirol®that was
lost in the experimental set-up during co-injection process. As the initial quantity of Precirol®loaded was 33.3% in weight and
the overall final percentage in the coated beads was 21.6%, about 12% of fat has been lost throughout the coating experiment. That somewhat important loss was thought to be technology dependant: indeed, the downstream Precirol®coming from the
expansion valve flows through a right angle before reaching the expansion device ofFig. 2. Therefore, this dead area can retain a few coating material.
4.3. Comparison of the coated glass beads with a physical mixture?
At this step, comparing the coated glass beads sample lower than 20 !m, with a physical mixture of the same weight ratio,
Fig. 4. MEBE photographs of the 50–63 !m glass bead fraction. (a) Uncoated glass bead magnification 1600×; (b) coated glass bead magnification 1600×; (c) coated glass beads magnification 800×; (d) coated glass beads magnification 6400×.
brought interesting additional information. Therefore, Precirol®
solidified by supercritical CO2 was strongly mixed manually
with the smallest glass beads to form the so-called physical mix-ture. The weight ratio (coating:beads) chosen for the physical mixture was the one measured by DSC on the coated sam-ple: 19.2 wt%. Since the expanded Precirol® should surround
the glass beads in the coated sample, a single population, was then expected. Whereas the physical mixture, that contained two free separate compounds, should present two different par-ticles populations. As a result, FT-IR spectra of the physical mixture should be the addition of the Precirol®peaks and the
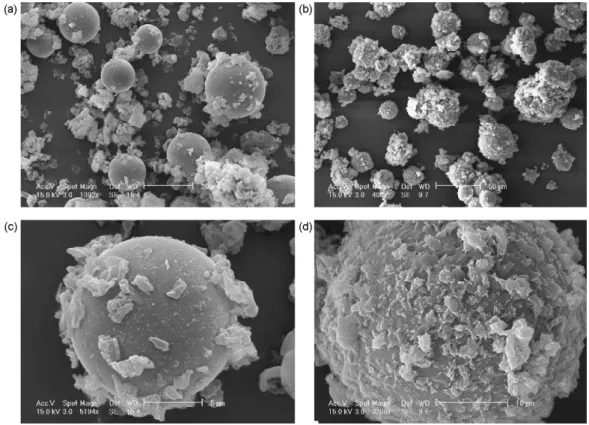
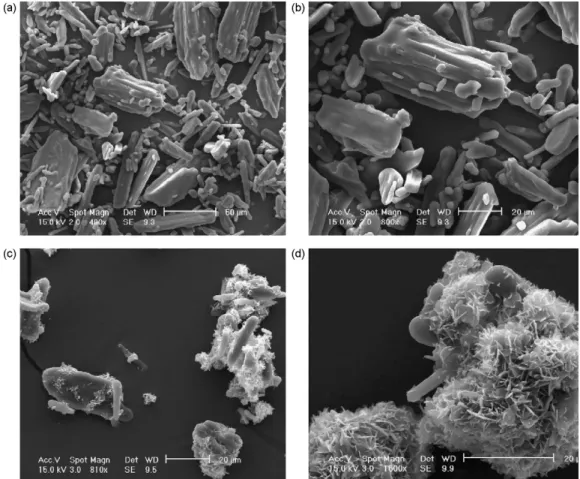
glass beads ones, whereas the coated sample should diffract only the fat molecule. A fraction of the obtained samples was visu-alized by ESEM (Fig. 5) and presented some differences: the fat crystallized on the glass beads surface for the co-injected
sample, whereas it was just deposited on the surface in the physical mixture. Obviously, the FT-IR spectra of the physi-cal mixture differed from the coated sample ones as depicted in
Fig. 6: especially, characteristic peaks of silica element found in the 3200–3600 and 400–800 cm−1 regions were hidden in
the coated glass beads sample, whereas they were present in the physical mixture sample, giving evidence that the fat form a shell onto the glass beads surface.
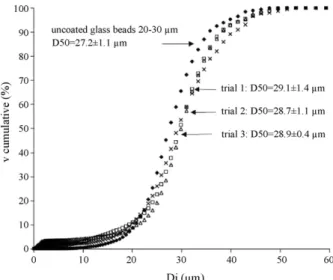
Table 3presents results for particle size distribution analysis. An example of an obtained distribution is plotted inFig. 7for the 20–30 !m size range. On this figure, trials 1–3 were replica of the same experiment. Similar D50were obtained and curves were
transposed towards higher diameters between the bare sample and the coated ones. Higher D50on coated glass beads samples
were also found for particles size class above 20 !m (Table 3).
Table 2
Study of the reproducibility of the co-injection process: results of three similar coating experiments
Method Experimental results Conclusion Particle size analysis Coating experiments: D50trial 1 = 15.8 !m; D50trial 2 = 17.3 !m;
D50trial 3 = 15.0 !m; D50uncoated beads = 13.4 ± 0.4 !m
D50coated particles: 16.0 ± 1.0 !m
DSC (supplied Precirol®
percentage: 33.3%)
Coating experiments: !Hfus-trial 1= 22.8 J/g; !Hfus-trial 2= 15.8 J/g;
!Hfus-trial 3= 27.4 J/g; !Hfus-pure Precirol®= 114.4 ± 1.3 J/g
Mass percent of Precirol®trial 1 = 19.9%; mass ratio of
Precirol®trial 2 = 13.8%; mass ratio of Precirol®trial
3 = 23.6%; average trials (1–3) = 19.2 ± 4.1%; relative uncertainty = 21.6%
Pycnometry (supplied Precirol®percentage:
33.3%)
Density measurements: ρtrial 1= 1.78 g/cm3; ρtrial 2= 1.79 g/cm3;
ρtrial 3= 1.89 g/cm3; ρglass beads= 2.45 g/cm3; ρ
Precirol®= 0.99 g/cm3
Mass ratio of Precirol®trial 1 = 29.9%; mass ratio of Precirol®
trial 2 = 29.8%; mass ratio of Precirol®trial 3 = 23.4%; average
Fig. 5. MEBE comparison of a physical mixture glass beads/Precirol®and a coated sample. (a) Physical mixture magnification 1092×; (b) coated sample magnification
400×; (c) physical mixture magnification 5194×; (d) coated sample magnification 3200×.
For each mean diameter class the specific surface area of the uncoated glass beads was calculated using relation(3): Scalculated= 6
D[3; 2] 1
ρglass beads (3)
Glass beads being spherical, the surface diameter D[3;2] is equal to the volume diameter D[4;3]. Values of the weight of Precirol®deposited onto the particles, which was measured by DSC, enabled to quantify each experiment in terms of deposited mass of Precirol®per glass beads surface area, as presented in Table 4. This ratio was plotted versus the specific surface area (Fig. 8). The results showed a good linear correlation for the smallest surface areas between deposited quantity of Precirol®
Fig. 6. FT-IR spectra of coated particles and of physical mixture.
Table 3
Comparison between the D50of the coated and uncoated glass beads and for the
five sieved class
Uncoated glass beads Coated glass beads Sieved class (!m) D50(!m) Uncoated glass beads span D50(!m) Coated glass beads span <20 13.4 1.9 16 ± 1 1.06 ± 0.08 20–30 27.2 0.53 29.3 ± 0.3 0.51 ± 0.12 30–40 31.9 0.43 36.9 ± 3.6 0.46 ± 0.02 40–55 45.9 0.36 51.2 ± 1.1 0.43 ± 0.02 55–80 59.3 0.37 65.4 ± 1.5 0.41 ± 0
per surface area and the surface area or the diameter of the beads. This implies an individual coating for the lowest surface areas particles that is to say the highest particle sizes. On the con-trary, the correlation was no longer valid for the highest specific
Table 4
Volume of deposited Precirol®per glass bead surface unit and for the five sieved
fractions
Coated glass beads Coating quantification Sieved class (!m) D[4;3] (!m) Scalculated (m2/g) Precirol ® (wt%) cm3Precirol®/m2 glass beads <20 17.5 ± 0.8 0.14 22.9 ± 4.8 2.60 20–30 28.8 ± 0.1 0.09 23.4 ± 10.1 3.47 30–40 39.4 ± 1.3 0.07 24.1 ± 2.4 4.23 40–55 50.4 ± 0.8 0.06 22.3 ± 1.8 5.22 55–80 62.9 ± 2.6 0.04 20.8 ± 0.9 6.40
Fig. 7. Particle size distribution in cumulated volume for the 20–30 !m class coated glass beads. The experiment was done using the Venturi as bare particle conveying device.
surface areas, or the smallest particles. This may be due to an agglomeration effect. These results were consistent with the span values obtained before and after coating: the span was narrower for the smallest specific surface areas but wider for the highest ones (Table 3).
4.4. Validation of the co-injection process: coating of the micron-sized APIs—PE and BSA
Before starting the coating experiments, raw BSA mean vol-ume diameter was measured to be 69.6 ± 11.4 !m by Aerosizer®
particle size measurements, whereas raw PE mean diameter was measured at 16.1 ± 1.2 !m. Besides, particle size distribution showed a large polydispersity for this compound, which was confirmed by microscopy. In all the following coating experi-ments, the ratio (coating:active ingredient) was chosen equal to 1. A sample of 3 g of the coating fat was co-injected with a sam-ple of 3 g of an active compound using a Venturi as conveying system. Both BSA and PE coating experiment were repeated twice.
Fig. 8. Volume of Precirol®deposited on the particles vs. the specific surface
area of the particles.
ESEM characterization evidenced agglomeration on coated PE samples (Fig. 9). This effect could be proactively expected from Fig. 8, indeed raw PE mean volume diameter was 16.1 ± 1.2 !m. Agglomeration was not surprising due to the powder characteristics: cohesive particles, diameter under 15 !m, widely dispersed.
Particle size distribution analysis corroborated the agglomer-ation phenomenon: trials 1 and 2, inFig. 10, were the replica of the same experiment but samples median diameters were signif-icantly different. This is due to a random agglomeration of PE with lipid. Besides, in both trials, the coated samples had a sig-nificant higher median diameter compared to the uncoated API. This might be due to both agglomeration and coating effects as evidenced on ESEM pictures ofFig. 9. The agglomeration phenomenon may occur during the transport through the co-injection device system or after the coating in the solid/gas separator. Concerning, the mass percent determined by DSC, it gave an average Precirol®percentage of 59.1 and 77.3% for respectively trials 1 and 2, whereas the initial fat mass percent was 50%. Agglomeration phenomenon was taken responsible for too high the amount of lipid, dosed by DSC.
Finally, drug release tests performed on coated BSA and PE in distilled water at room temperature both presented slower disso-lution rate compared to raw materials (Figs. 11 and 12). Whereas uncoated PE was fully dissolved within 10 min, coated PE (trial 1) needed five times more to be released in water and PE pro-cessed in trial 2 was released in 150 min. So, Precirol®deposited
on the surface by this new process was effective enough to slow down the release of the active compound in distilled water. The coated PE from trial 2, which had the highest percentage of Precirol®took a longer time to be released in water. As for coated
BSA, the compound was completely released within 30 min into distilled water, whereas uncoated one was fully dissolved in water within 5 min at room temperature.
4.5. Some considerations about the ageing of the fat crystallized by supercritical fluid
The last part of the study aimed to determine if the very low temperature reached when expanding the fat and the associated high cooling rate may affect the structure of Precirol®. Indeed,
the in situ measured depressurization temperature was close to 243 K.
A sample of Precirol®was crystallized by supercritical route
and stored at room temperature. Its heat of fusion was mea-sured at regular time intervals.Fig. 13shows the evolution of the temperatures of the melting peaks. The heat of fusion of the fat increased from 114.4 J/g for a freshly crystallized sample up to 170 J/g after 1 year of ageing. The fresh sample presented one single peak, whereas the aged sample developed a second peak towards the highest temperatures. This remark suggested a reorganization of the crystalline lattice of the fatty compound.
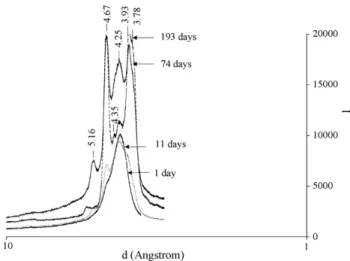
Fig. 14depicts Precirol® X-ray diffraction patterns. The large
single peak for freshly solidified Precirol® developed rapidly
a shoulder on its left side and then two others peaks on each side of the first main one. After 74 days, Precirol® spectrum exhibited four distinct peaks identified at 4.25 ˚A which was the
Fig. 9. ESEM pictures of the pseudoephedrine chlorhydrate (PE) coated or not, by the Precirol®. (a) Raw PE magnification 490×; (b) raw PE magnification 800×;
(c) coated sample magnification 810×; (d) coated sample magnification 1600×.
first to appear, 4.67 and 5.16 that were the following, and 3.93 that was the fourth one. After 193 days two additional peaks seemed to appear, at 3.78 and 4.35 ˚A while the 4.25 one had significantly decreased. Sato established that triglycerides may be subject to solid/solid transitions: " form of triglyceride gives one single strong peak at 4.15 ˚A, #′form peak is usually
recog-nized by its two peaks, at 3.8 and 4.2 ˚A, whereas three peaks at 4.6 (strong), 3.8 (weak) and 5.4 (weak) would be characteris-tic for the # form[18]. ", #′, # correspond to different subcell
Fig. 10. Particle size distribution in cumulated volume for the pseudoephedrine chlorhydrate coating tests. Trials 1 and 2 are the replica of the same experiment.
crystalline structures. " is the thermodynamically less stable form, whereas # is usually the most stable one for pure triglyc-erides, whereas it could be the #′form for triglycerides mixtures.
Less information can be found on diglycerides in the literature. According to Sato[19], #′form would not exist for 1,2
satu-rated monoacid diglycerides, whereas the three forms, ", #′#
were evidenced in the case of 1,3 saturated monoacid diglyc-erides. On the hypothesis that Precirol® main component is a
Fig. 11. Test release of the coated pseudoephedrine chlorhydrate and the raw one in distilled water and at room temperature.
Fig. 12. Test release of the coated BSA and the raw one in distilled water and at room temperature.
1,3 diglyceride, the one crystallized by supercritical fluid might then be composed of a " form that evolved with time into a # form; at least a #′form seemed to appear. This evolution was
rel-atively fast when the fat was stored at room temperature but was significantly slower, about 4 months, when stored in cooled con-ditions (i.e. 277.15 K). Furthermore, Precirol®freshly supplied
get the same heat of fusion as Precirol® just after
crystalliza-tion by SCF. Further re-crystallizacrystalliza-tion tests (not presented in this paper), were done with a DSC apparatus performing heat-ing/cooling/heating cycles, the lowest temperature ranging from 273.15 to 223.15 K the highest being 363.15 K and varying cool-ing rates from 5 to 15 K/min. These tests showed that the heat of fusion obtained at the second heating and the re-crystallization temperature during the cooling step varied slightly and remained close to 114.4 J/g (actually, between 114 and 123 J/g) and 328.7 K (between 328.69 and 329.11 K). From all these remarks, it appears that Precirol®was somewhat influenced by the
con-ditions of solidification. The fact that Precirol®is a mixture of
fats and not a pure compound, might be the reason of such a stability.
Fig. 13. Time course evolution over 335 days of the DSC spectra of Precirol®
stored at room temperature.
Fig. 14. X-ray powder diffraction pattern of Precirol®stored at room
tempera-ture at different time intervals.
4.6. Some considerations about this new process
From the above results and discussion we can sum up the main novelties and advantages of the proposed process. First, it is a green process as it does not use any organic solvent, con-tributes to valorise the main greenhouse effect gas and CO2
can be re-used in the process. Besides, the two-step process, dissolution–expansion, is proposed here in a semi-continuous configuration: it could be achieved in a continuous way by con-sidering a separation of the coated particles from the uncoated ones and from exceeding coating agent (through cyclonic sepa-rators for instance) and then a recirculation of the coated particles up to the Venturi tank and re-use of the coating agent. Third, it allows to coat particles that are tricky to fluidize, under 80 !m and above 20 !m, without any agglomeration problem, in par-ticular, for non-cohesive powders. Finally, labile materials can be processed in this way without any degradation and the coat-ing agent is processed at operatcoat-ing temperatures below the ones used at atmospheric conditions, which is worthy in terms of energetic yield. On a scaling-up point of view, the ratio of coat-ing agent to particles would have to be considered as the main invariant.
Yet, several points has been underscored that need to be well controlled. The right angle just before the expansion valve must be suppressed, thus the fat loss will be drastically reduced and the relative uncertainty of the process improved. The mass ratio of coating agent to particles has also to be controlled: it could be achieved tuning the bare particles flow rate. This would allow both a precise control of the quantity of fat, which deposits onto the host particles and a limited agglomeration phenomenon as well, since it will have no excess of fat in the coated sam-ples. For highly cohesive powders, particles agglomeration can be reduced, by using dry compressed air as venturi alimenta-tion. Experiments (not presented here) with a dessicator just prior the venturi inlet have shown a reduction of the agglomer-ation. As for the coating agent processing, the upstream (before expansion) temperature and pressure determine the phase of the coating agent downstream (after expansion), but the excess of
supercritical CO2 upstream has also a major influence on the
temperature after expansion and on the nature of the expanded coating agent[20]. So upstream operating conditions have to be chosen so as the whole the lipid is melt and the maximum depletion of the melting point is reached. In addition, the excess quantity of CO2 has to be carefully chosen in order to
con-trol the downstream conditions and the nature of the expanded product.
5. Conclusion, further work
A new co-injection process for coating fine particles by fats under supercritical conditions has been developed. This process can be implemented both by conveying the initial particles in air using a Venturi system or with a gaseous stream of CO2.
The first study done with Precirol® and glass beads showed
that both techniques are valuable, but need further improve-ments since the fat deposit measured by DSC (19.2 ± 4.1%) may vary in rather large proportion. In terms of encapsulation quality, the co-injection process differs whether high or low specific surface area particles are coated. For the lowest sur-face areas (50–63 !m range size particles), a good correlation between the mass deposited and the surface available for the fat was found. In this case, particles were rather discretely coated as confirmed by ESEM pictures. For the highest surface area (particles smaller than 20 !m), this correlation was no longer valid, and agglomeration was the dominant phenomenon. In any case, FT-IR and ESEM observations evidenced clear dif-ferences between a physical mixture and a processed coated sample; the latter exhibited in all cases a much better coating. The validation of the co-injection process was done with two active compounds, PE (pseudoephedrine chlorhydrate) and BSA (bovine serum albumin). Both compounds presented significant lowered dissolution rates once the particles are processed and coated by the fatty material.
The last point of the study dealt with the supercritical crys-tallization of the fatty product. Indeed, the co-injection coating process sharply and quickly cooled down the fat at negative temperature. The study showed that Precirol® was stable in
terms of crystallization and followed a solid–solid transition from " to # or #′ form, independently of the solidification
pathway.
The co-injection coating process involves neither high tem-perature nor organic solvent for the APIs to be coated. Hence, this process is mostly suited to coat sensitive molecules such as proteins. Besides a good control of both flow rates coat-ing/particles is allowed, thus the thickness of the surrounding shell could be adapted. When only CO2is used, the gas can be
fully re-used. The co-injection process is currently under scaling up phase.
Acknowledgements
We would like to thanks the Pierre Fabre Company for finan-cial support via Performances project. We thank Sylvie Del Confetto for DSC measurements and Philippe Accart for particle size distribution analyses and their profitable discussion.
Appendix A. Nomenclature
di density of the compound i (kg/m3) D[4;3] mean volume diameter (m) D50 median diameter (m)
fi mass fraction of the compound i
!Hfus heat of fusion (J/g) S0 specific surface area, m2/g
References
[1] G. Cole, J. Hogan, M. Aulton, Pharmaceutical Coating Technology, Taylor & Francis (ed.), London, 1995.
[2] D. Chulia, M. Deleuil, Y. Pourcelot, Powder technology and pharmaceutical processes, in: Handbook of Powder Technology, vol. 9, Elsevier Science (ed.), Amsterdam, 1994, p. 513.
[3] A. Andr´e-Abrant, J.L. Taverdet, J. Jay, Microencapsulation par ´evaporation de solvant, Eur. Polym. J. 37 (2001) 955–963.
[4] H. Ichikawa, Y. Fukumori, Microagglomeration of pulverised pharma-ceutical powders using the Wurster process. I. Preparation of highly drug-incorporated, subsieve-sized core particles for subsequent microen-capsulation by film coating, Int. J. Pharm. 180 (1999) 195–210. [5] J. Fages, H. Lochard, J.-J. Letourneau, M. Sauceau, E. Rodier, Particle
generation for pharmaceutical applications using supercritical fluids tech-nology, Powder Technol. 141 (2004) 219–226.
[6] E. Weidner, Z. Knez, Z. Novak, PGSS (Particles from Gas Saturated Solutions)—a new process for powder generation, in: G. Brunner, M. Perrut (Eds.), Proceedings of the 3rd International Symposium on Supercritical Fluids, Strasbourg, 1994, pp. 229–234.
[7] E. Weidner, V. Wiesmet, Z. Knez, M. Skerget, Phase equilibrium (solid–liquid–gas) in polyethylenglycol carbon dioxide systems, J. Super-crit. Fluids 10 (1997) 139–147.
[8] M. Perrut, Method for encapsulating fine solid particles in the form of microcapsules, WO Patent 02/05944 A1, 2002.
[9] B. Weinreich, R. Steiner, Method for producing powder product from a liquid substance or mixture of substances, EP Patent 1021241 A, 2000. [10] H. Lankes, K. Sommer, B. Weinreich, Liquid absorption capacity of carriers
in the food technology, Powder Technol. 134 (2003) 109–201.
[11] M. Calderone, E. Rodier, Pierre Fabre Medicament, Method for coating powders, WO Patent 06/030112, 2006.
[12] W. Sutanata, D.Q.M. Craig, J.M. Newton, The effects of ageing on the thermal behaviour and mechanical properties of pharmaceutical glycerides, Int. J. Pharm. 111 (1994) 51–62.
[13] V. Jannin, E. Pochard, O. Chambin, Influence of poloxamers on the dissolution performance and stability of controlled-release formulations containing Precirol®ATO 5, Int. J. Pharm. 309 (2006) 6–15.
[14] M. Savolainen, J. Herder, C. Khoo, K. Lovqvist, C. Dahlqvist, H. Glad, A.M. Juppo, Evaluation of polar lipid hydrophilic polymer microparticles, Int. J. Pharm. 262 (2003) 47–62.
[15] T. Allen, Particle size measurement Powder Sampling and Particle Size Measurement, 1, Vth ed., Chapman & Hall (ed.), London, 1997. [16] M. Calderone, E. Rodier, J. Fages, Microencapsulation by a solvent-free
supercritical fluid process: use of density, calorimetric and size analysis to quantify and qualify the coating, Part. Sci. Technol. 42 (2007) 189–199. [17] A.R. Sampaio de Sousa, M. Calderone, E. Rodier, J. Fages, C.M.M. Duarte,
Solubility of carbon dioxide in three lipid-based biocarriers, J. Supercrit. Fluids 39 (2006) 13–19.
[18] K. Sato, Crystallization behaviour of fats and lipids—a review, Chem. Eng. Sci. 56 (2001) 2255–2265.
[19] K. Sato, in: N. Garti, K. Sato (Eds.), Crystallization and Polymorphism of Fats and Fatty Acids, Marcel Dekker, New York, 1988.
[20] M. Calderone, E. Rodier, J.-J. Letourneau, J. Fages, Solidification of Precirol® by the expansion of a supercritical fluid saturated melt: from the thermodynamic balance towards the crystallization aspect, J. Supercrit. Fluids 42 (2) (2007) 189–199.