HAL Id: hal-02999448
https://hal.archives-ouvertes.fr/hal-02999448
Submitted on 10 Nov 2020HAL is a multi-disciplinary open access archive for the deposit and dissemination of sci-entific research documents, whether they are pub-lished or not. The documents may come from teaching and research institutions in France or abroad, or from public or private research centers.
L’archive ouverte pluridisciplinaire HAL, est destinée au dépôt et à la diffusion de documents scientifiques de niveau recherche, publiés ou non, émanant des établissements d’enseignement et de recherche français ou étrangers, des laboratoires publics ou privés.
Perovskite through a Methylammonium-Based Additive
for High-Efficiency Solar Cells
Tao Zhu, Daming Zheng, Marie-Noelle Rager, Thierry Pauporté
To cite this version:
Tao Zhu, Daming Zheng, Marie-Noelle Rager, Thierry Pauporté. The Stabilization of Formami-dinium Lead Tri-Iodide Perovskite through a Methylammonium-Based Additive for High-Efficiency Solar Cells. Solar RRL, Wiley, 2020, 4 (11), pp.2000348. �10.1002/solr.202000348�. �hal-02999448�
1
Please cite this paper as:
Tao Zhu,a Daming Zheng,a Marie-Noelle Rager,b Thierry Pauporté*a
The Stabilization of Formamidinium Lead Tri-Iodide Perovskite through a Methylammonium-Based additive for High Efficiency Solar Cells
Solar RRL (2020) 2000348. DOI:10.1002/solr.202000348 [a] Prof. Th. Pauporté, Mr T. Zhu, Mr D. Zheng
Institut de Recherche de Chimie Paris (IRCP), UMR8247, F-75005 Paris, France. Department: Chimie ParisTech, PSL Research University, CNRS
11 rue P. et M. Curie, F-75005 Paris, France. E-mail: [email protected] [b] Dr. Marie-Noelle Rager
NMR Facility, Chimie ParisTech, PSL Research University 11 rue P. et M. Curie, F-75005 Paris, France.
Keywords: Perovskite solar cell, Stabilization by methylammonium, NMR, High efficiency, Organic cations composition
Nowadays, complex chemistry and precursor solution compositions are developed to stabilize hybrid perovskite films and boost the efficiency of perovskite solar cells (PSCs). In this context, determining the actual composition of these layers, especially in organic cation, and understanding the chemistry behind is challenging. In the present paper, we consider the introduction of methylammonium (MA+) in formamidinium lead iodide (FAPbI3) 3D
perovskite to stabilize the α-phase which quantity must be minimized to reduce the material hydrophilicity and its possible destabilization by degassing. The key effects of methylammonium chloride (MACl) additive on the growth of FA1-xMAxPbI3 perovskite layers
are studied. Liquid-NMR has been used to analyze the photovoltaic layers. NMR peaks and their origin have been identified. We have then reliably measured MA and FA content in films actually used in PSCs and prepared over a large additive molar concentration ratio. We have quantified x at 0.06±0.01 for the pure films which corresponds to the best entropic compound stabilization. It results in perovskite solar cells (PSCs) with a stabilized power conversion
2
efficiency as high as 22.06 %. These PSCs are shown highly stable under solar irradiation and high moisture.
Organic-inorganic hybrid perovskites (OIHPs) are among the most fascinating semiconductor materials due to their versatility, tunability, low temperature preparation and amazing optoelectronic properties.[1] Their direct transition bandgap can be tuned by playing
on their composition, they exhibit long charge carrier lifetimes and they can be prepared at low cost starting from precursor solutions which are processed at low temperature. OIHPs have emerged as one of the most promising family of materials for photovoltaic solar cell application.[2–15] The record power conversion efficiency of perovskite solar cells (PSCs) has
reached a certified record efficiency of 25.2%.[16] PSCs have the highest performance for the
thin film solar cell technologies and they are closely approaching the efficiency of the best silicon solar cells.
Formamidinium lead tri-iodide (FAPbI3) perovskite is among the best suited OIHP material
for the application from the point of view of the bandgap for light harvesting over a vast wavelength range (from the near-IR to the near-UV) and for generating a rather large photovoltage output.[6,9] However, FAPbI
3 is stable at room temperature in its δ-phase, a
photo-inactive compound in solar cells. The stabilization of the photo-active black perovskite α-phase requires the incorporation of an extra monovalent cation.[6,17] To the best of our knowledge and
as summarized in Table S1 (Supporting Information), PSCs reaching PCE>22% reported in the literature contain methylammonium (MA+) as extra-organic cation.[10-15] However, the
presence of MA+ presents disadvantages as this organic compound is hydrophilic and its excess
can be degassed out of the layer.[9] It is therefore of utmost importance to incorporate enough
MA+ for stabilization and a minimum of this cation for the long-term stability. The other
important points is that, for a high efficiency and a high stability, the layer must be made of large grains which go through the entire perovskite thin film.[18,19]
3
To increase the performances of PSCs, complex recipes have been developed. Remarkable results have been achieved by employing additives and precursor solutions which composition is far from the actual composition of the final perovskite layer. For instance chloride is a well-known additive which favor the formation of large grains and has been used in a large extent in MAPbI3 perovskite layers.[20,21] Only a small number of papers have employed chloride
additives for the growth of perovskites mixing formamidinium and methylammonium cations.[11,15,22-24] MACl was used by several authors for processing the perovskite layers upon
spin-coating to increase their quality.[23,24] In another paper, MACl was combined with FAI to
force the stoichiometric introduction of Cl in perovskite compounds and obtained mixed halide anion materials.[22] Kim et al. showed that MACl successfully induces an intermediate to the
pure FAPbI3 α-phase without annealing.[15] However, a minimum of methylammonium must
be incorporated in the perovskite to minimize its hydrophobicity and its destabilization.[9]
We describe the accurate quantification of organic cations in perovskite thin films employed in high efficiency solar cells that have been produced from non-stoichiometric precursor solutions. The technique is based on liquid-NMR. It is applied to FA1-xMAxPbI3
layers, well-crystallized in their α-phase. The optimized films are free of δ-phase and of PbI2.
We show that MACl must be added in a large excess in the precursor solution to favor the layer crystallinity. We demonstrate that the actual methylammonium molar content in the films is low (x~0.06) and does not vary with the initial additive content between 40 mol% and 55 mol%. It is explained by the fact that the best amount of MA for the thermodynamic stabilization of FA1-xMAxPbI3 is incorporated while all the excess is eliminated by the annealing treatment at
4
The perovskite layers were prepared as detailed in the Supporting Information. Table S1 (Supporting Information) shows that we employed a low concentration of precursor at 1.2M of PbI2 compared to the other recipes yielding very high efficiencies PSCs. The morphology of
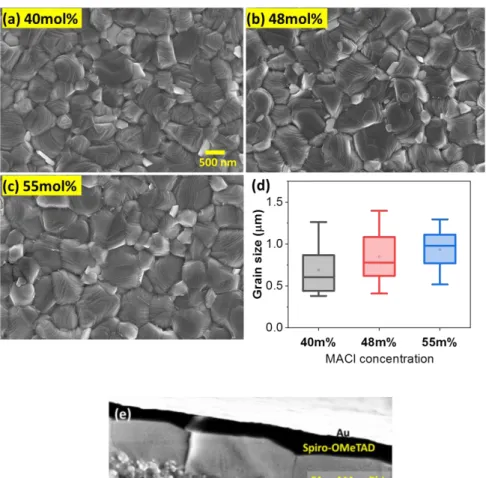
perovskite films with 40 mol%, 48 mol% and 55 mol% molar fractions of MACl additive (the films and cells are denoted MC40, MC48 and MC55, respectively, in the following) are presented in Figure 1a-c. The layers were uniform, compact, contained no pinholes and were made of remarkably large size perovskite grains. The various MACl fractions employed gave a similar morphology. The statistical analysis of the grain size, done with the Image J software, is presented in Figure 1d. The average values were 604 nm, 775 nm and 982 nm for MC40, MC48 and MC55 films, respectively. The grain size gradually increased with the MACl molar fraction used. The cross-sectional views of the layer in the solar cells confirmed the large size of the grains (Figure 1e). Remarkably, they also showed monolithic large grains, their thickness being the perovskite layer thickness. We therefore conclude that, in the solar cells, each grain is contacted by the electron transporting layers on one side (TiO2) and by the hole
transporting layer on the other side (Spiro-OMeTAD) (Figure 1e).
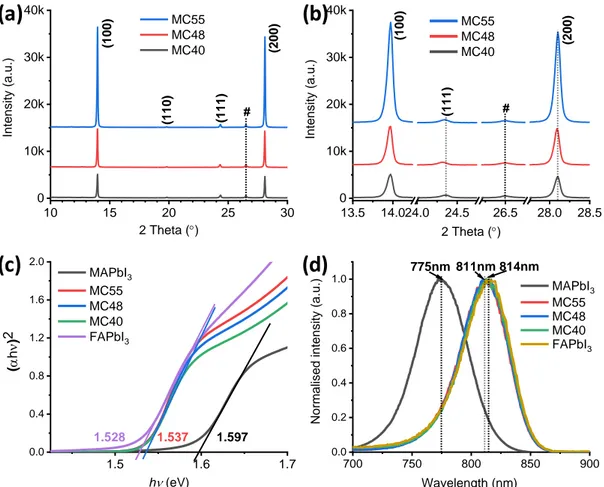
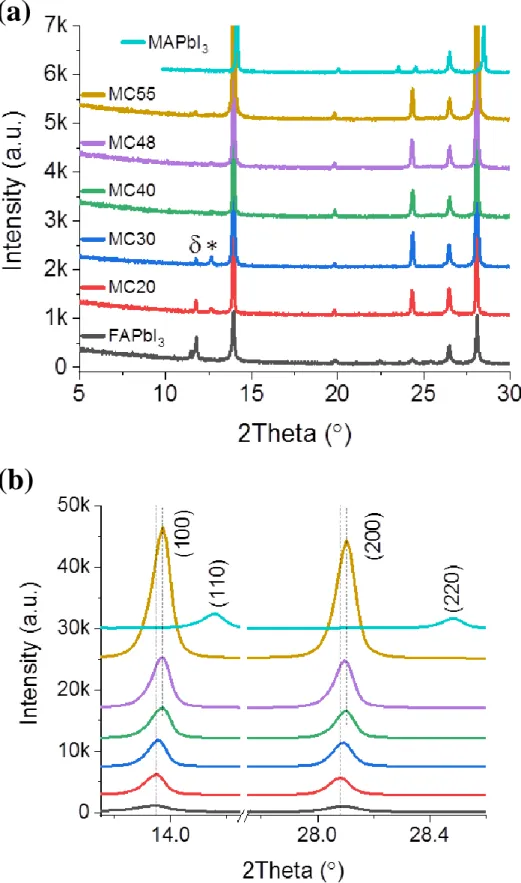
The phase and the purity of the produced compounds were checked by X-ray diffraction (XRD). The patterns shown in Figure 2a and 2b correspond to the ultra-pure cubic α-phase perovskite. We have noted that high concentation of MACl, with an optimum at 48 mol.% was required to get the high purity α-phase, while MC30 and MC20 films contained both PbI2 and
δ-phase impurities (See Figure S1, Supporting Information). The reflection peaks have been indexed accordingly. The fact that the strongest diffraction peaks belong to the (h00) family of plane shows a strong texturation of the layer with a preferential orientation along the [100] crystallographic direction. The XRD peak intensity followed the additive fraction in relation with the grain enlargement with increasing the chloride concentration. Another interesting information extracted from the XRD patterns is that the peak positions are almost unchanged
5
with the fraction of MACl between 40% and 55% and that these parameters are very close to those of the α-FAPbI3 compound (Figure S1, Supporting Information). On the other hand, the
XRD peaks of the FA1-xMAxPbI3 are significantly shifted compared to the MAPbI3 compound
(Figure S1, Supporting Information). Replacing FA by MA is known to produce a shrinkage of the crystal lattice and a reduction of the lattice parameter.15 It suggests that, in the present
case, x in FA1-xMAxPbI3 does not change significantly with the initial amount of MACl in the
precursor solution.
Energy dispersive x-ray spectrometry (EDX) allowed us to determine the layers I/Pb atomic ratio. The average values were 2.96, 3.15 and 3.06 for MC40, MC48 and MC55 samples, respectively. The theoretical ratio is 3 and the presence of PbI2 would reduce this parameter.
Within the uncertainty of the technique, the compounds were close to the stoichiometry without a significant amount of PbI2 present. Also, EDX analysis revealed that the final layers, after
annealing, were almost free of chloride element, regardless of the MACl fraction in the precursor solution. In hybrid 3D perovskite, the integration of iodide is thermodynamically much more favorable than that of chloride. In the precursor solution employed, I is added in a stoichiometric ratio and no Cl need to be integrated in the structure for its stabilization.[22]
Therefore, almost all chloride ions provided were eliminated during the annealing step. For the charge compensation, cations must be eliminated with Cl-. A small amount of MA is integrated
in the structure to stabilize the black α-phase of perovskite while the organic cation excess is also eliminated upon the layer annealing.
To accurately determine how much MA is incorporated in the films and then to answer the critical issue of the actual organic cation composition of the prepared layers, a NMR study was conducted. To the best of our knowledge, in the works investigating perovskite composition by NMR, the analyzed compounds are precipitated powders,[7,25-27] crystals,[7,26,28] or films
6
using them, one can get a quite large amount of material that permits solid-state- and/or liquid-NMR investigations. However, the drawback of these techniques is that they deviate from the ones employed for very high efficiency PSC fabrication. In our case we have investigated the films actually employed in the perovskite solar cells. They have been directly dissolved in DMSO-d6 solvent (see the Experimental Section). The liquid-state 1H-NMR and 13C-NMR
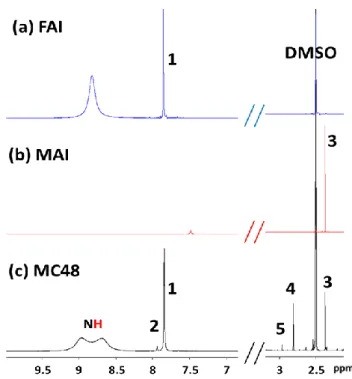
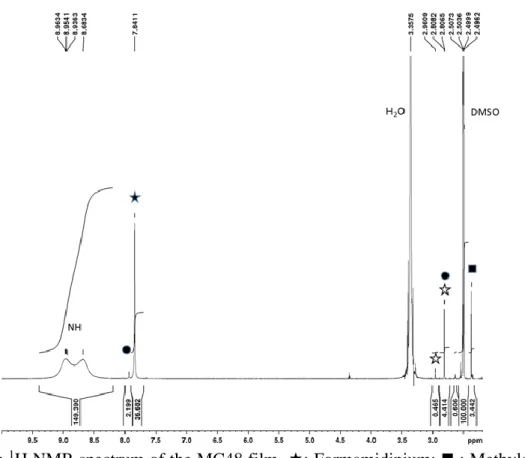
spectra of the MC48 layer and their correlation figure are disclosed in Figure S2a, S2b and S2c (Supporting Information), respectively. In the NMR spectra, we observed more peaks than expected from our MAI and FAI reference spectra (Figure 3a and 3b, respectively). The 1H
NMR spectrum showed a singlet at δ 7.84 ppm, which was correlated with the 13C NMR peak
at δ 157.4 ppm, and a singlet at δ 2.37 ppm correlated with the 13C NMR peak at δ 24.7 ppm.[25]
Based on our references (Figure 3a and 3b), these peaks were attributed to the CH of the formamidinium and the CH3 of methylammonium, respectively.[27] We also observed a small 1H peak at δ 7.94 ppm, correlated with the 13C peak at δ 155.4 ppm and a 1H peak at δ 2.81
ppm correlated with a 13C peak at δ 28.0 ppm. A very small 1H peak was also detected at δ 2.96
ppm. These three features are absent from the FAI and MAI NMR spectra (Figure 3) and it suggests that they result from reaction products between FA and MA. MAI in solution undergoes deprotonation and methylamine and HI are formed in equilibrium with MAI. Upon the writing of this paper, an article by Wang et al.[27] appeared which shows that the
nucleophilic N atom in MA can react with the electrophilic imine group of FAI. It results in the formation of N-methyl FAI (CH3-NH2-CH=NH•HI) by condensation. The 1H-NMR peak at δ
7.94 ppm fit with the CH in N-methyl FAI and that at δ 2.81 ppm with the CH3 in this
compound. The very small peak at δ 2.96 ppm could be assigned to CH3 in N,N’-dimethyl FAI
(CH3-NH2-CH=N-CH3•HI) formed by a second condensation reaction. We conclude that,
following the layer dissolution in DMSO solution, N-methyl FAI is formed by the partial reaction between FAI and MA and that this compound is detected on the NMR spectra. A small
7
amount of N,N’-dimethyl FAI is also formed. The spectra were similar for the MC40, MC48 and MC55 layers (Figure S2, Supporting Information). The 1H-NMR peaks of formamidnium,
methylammonium, N-methyl FAI and N,N’-dimethyl FAI were present with about the same ratio.
The main advantage of the liquid-state 1H-NMR technique is its high sensitivity. As a
consequence, by integrating the spectrum peaks, we have been able to quantify the relative amount of FA and MA incorporated in the perovskite layers actually used in the solar cells. The DMSO peak was retained as an internal reference. The integration value of MAI peak was corrected of the 13C satellite of DMSO. The CH
3 of N-methyl FAI peak was corrected of the
second N-methyl FAI peak which appeared at the same chemical shift. We have also supposed that the two CH3 of N,N’-dimethyl FAI had the same integration. The results gave x values in
FA1-xMAxPbI3 equal to 0.064, 0.064 and 0.061 for MC40, MC48 and MC55 layers, respectively
(x was slightly less for the MC30 (0.060) and MC20 (0.040) films (Table S2, Supporting Information) but they were not phase pure). Within the uncertainty of the technique, the remarkable point is that this parameter is almost irrespective of the MACl mol% present in the precursor solution which was varied in a large extent and is determined at 0.06±0.01. We can conclude that this value corresponds to the optimum for which the prepared black α-phase perovskite is the most stable. The excess of MACl is removed upon the annealing at 153°C by decomposition/sublimation.[9] For the charge and chemistry balance, a small amount of FA
must be also eliminated likely by similar processes. The incorporation of a small amount of MA for the stabilization of FAPI is in agreement with recent computational investigation which calculated in FA1-xMAxPbI3 a minimum of the Gibbs free energy for x <0.2, while this
parameter continuously increases at higher x.[30]
The optical properties of the layers were characterized by measuring their absorbance curves. The spectra of FA1-xMAxPbI3 layers are compared to those of MAPbI3 and FAPbI3 in
8
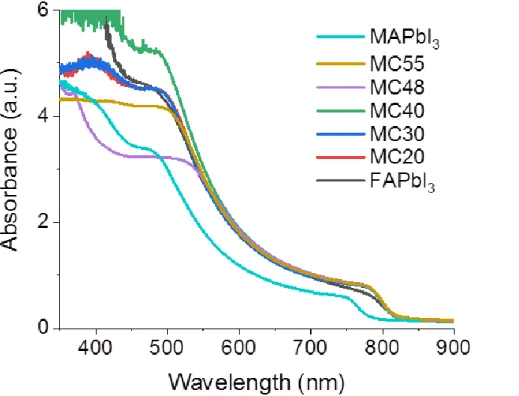
Figure S3 (Supporting Information). They exhibit a direct optical transition at about 820 nm.
We observed that FAPbI3 and FA1-xMAxPbI3 layers had about the same absorbance in the 550
nm-800 nm range. In Figure 2c. the linear fit intersection of the Tauc plot with the energy axis gives an optical bandgap energy (Eg) of 1.537 eV, regardless of the additive fraction. It confirms
the same stoichiometry for the perovskite layers prepared. This value was very close to our Eg
value of FAPbI3, 1.528 eV, and far apart the Eg of MAPbI3 (1.597 eV). These results are in line
with the NMR study. This low Eg is a positive property for the light harvesting in the near-IR.
We have also measured the photoluminescence (PL) spectra of the layers. The maximum emission wavelength was the same for the prepared mixed cation perovskites and their normalized spectra overlapped (Figure 2d). In the same figure, we have reported the FAPbI3
and MAPbI3 spectra. FA1-xMAxPbI3 layers had a maximum emission wavelength (811 nm) very
close to that of FAPbI3 (814 nm). Using the approximation of a linear variation and the emission
maximum of MAPbI3, we found x at 7.5±2.5%, which is in agreement with the NMR study.
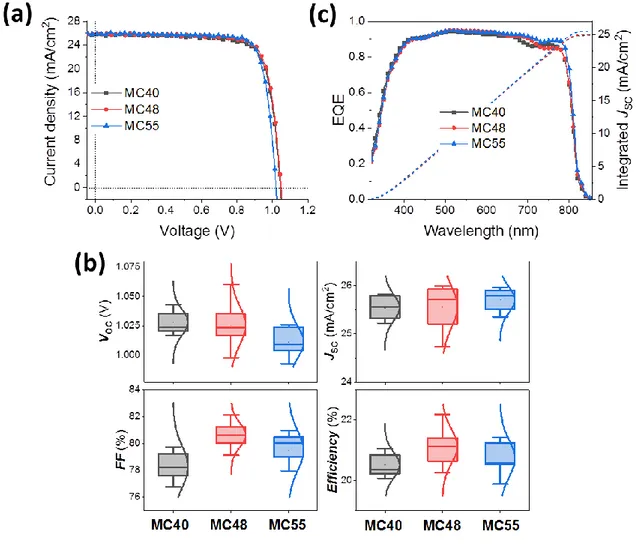
Perovskite solar cells were prepared by completing the layers stacking by spin-coating a Spiro-OMeTAD layer and by evaporating a gold back-contact. An SEM view of the device structure is presented in Figure 1e. Typical J-V curves are displayed in Figure 4a. Table 1 summarize the J-V curve parameters of devices among the best. We focus our discussion on the highest concentrations of MACl since the performances of MC20 and MC30 cells were rather lower (Table S3a, Supporting Information). Table 1 shows that the cells were almost hysteresis free. The very low hysteresis can be related to the very large grains and low defect density in the structure. JSC was the highest for MC48 and MC55 cells and the VOC was the
highest for the MC48 ones. Overall, the best power output was achieved for MC48 devices. These trends can be explained by the larger grains, higher structural quality and less defects in the case of the MC48 perovskite layer. The VOC depends on the recombination rate in the grains
9
Overall, choosing MACl at 48% molar fraction appears as the best compromise for the best performances.
The observation made for the best cells were confirmed by the statistics of the J-V curve parameters distribution (Figure 4b). We noted the high JSC measured with the presented
perovskite. The high charge generation efficiency over a large wavelength range was confirmed by EQE measurements (Figure 4c). The large grains, high crystallinity and high absorbance over a large visible-near infrared range of the produced perovskite layers gave rise to high performances. Figure 5a shows the reverse and forward scans for the best cell with a 22.15% PCE measured on the reverse scan. The hysteresis index of this cell was only 4.0%. By tracking, the steady power output was reached after about 80s and measured at 22.06% which is very close to the PCE measured on the reverse scan (Figure 5b).
We have also noted that the prepared cells had a remarkable stability. The photostability was followed for 5 hours under a continuous one sun AM 1.5G illumination at ambient temperature and 45% of relative humidity (RH). Figure S4a (Supporting Information) compares unencapsulated MC48, MAPI and FAPI cells. The latter had a very low efficiency (Table S3b, Supporting Information) and were not stable when stored under ambient conditions. Their PCEs degraded quickly upon tracking at the maximum power point under one sun (Figure S4a). On the contrary, the power output was highly stable and unchanged in the case of the FA0.94MA0.06PbI3 cell of the present study. In the same figure, we also include the
MAPI cell power output which continuously decreased during the test. The stability against moisture was tested by storing the unencapsulated cells in a chamber with a 90% RH and ambient light conditions (Figure S4b, Supporting Information). The MC48 power output was stable for 20h. The MAPI cell lost 60 % of its initial PCE within only 20h. The variations of the J-V curve parameters are shown in Figure S4b (Supporting Information). This high stability
10
is explained by the optimal incorporation of a minimum of MA for the α-phase stabilization and large grains.
In summary, we have described the reproducible synthesis of mixed organic cation halide perovskite films using methyl ammonium chloride as additive in a large amount and a rather low-concentration precursor solution compared to the other high efficiency PSC works. We have shown that the optimum amount of this additive is 48 mol%. The perovskite compound had a low bandgap, very large grains and was optimized to be free of parasitic phases. Importantly, we have identified by liquid NMR the organic compounds formed after the dissolution of the layers in DMSO and shown the presence of condensation products between MA and FA. On this basis, we have been able to determine the actual methylammonium fraction in the FA1-xMAxPbI3 perovskite photovoltaic films. We have shown that the MA
amount was very low at x~0.06±0.01. This small amount is analyzed as the best for the entropic stabilization of the FA1-xMAxPbI3 compound. It resulted in a high PCE up to 22.15% and an
excellent stability of the prepared solar cells.
Experimental Section
The full experimental details are provided in the Supporting Information. In brief, the fluorine-doped SnO2 (FTO) substrates were cleaned and the compact TiO2 hole blocking layer (c-TiO2)
and the mesoporous TiO2 (mp-TiO2) layer were deposited as described in our Ref.[17]. We
prepared a mixed cation precursor solution with a 1.2M concentration by mixing 206 mg of formamidinium iodide (FAI, greatcell), 553 mg of PbI2 (TCI), and 16.2 mg, 24.3 mg, 32.4 mg,
38.9 mg and 44.6 mg of methylammonium chloride (Alfa Aesar) in 800 μL DMF and 200 μL DMSO. They corresponded to 20 mol%, 30mol%, 40 mol%, 48 mol% and 55 mol% of FAI, respectively. The solutions were spin-coated on top of the FTO/c-TiO2/mp-TiO2 substrates. 100
11
a precursor solution with a 1.2 M concentration was prepared by mixing 103.18 mg of FAI and 276.7 mg of PbI2 in 100 μL DMSO and 400 μL DMF. The spin coating procedure was the same.
All the layers were annealed at 153°C, 13 min for the FA1-xMAxPbI3 films and for 18 min for
the FAPbI3 films. Spiro-OMeTAD (Borun New Material Technology) was employed as the
HTM and prepared as in Ref.[17]. The solar cells characterizations, the XRD patterns, the absorbance and photoluminescence spectra measurements as well as the Tauc plot analyses of the films were performed as described in our previous work.[17] A Quantax system from Bruker operated at 15 kV was employed for the EDX spectra measurements.
For NMR (1H and 13C) the chemical shifts, in ppm, are referred to the residual DMSO solvent signal. Perovskite layers, deposited on a sprayed c-TiO2 layer, were dissolved in DMSO-d6
solvent (99.96 %D, H2O<0.01%, Euriso-top) and the NMR spectra of the solutions were
measured by a Bruker Avance 500 MHz Neo spectrometer.
Methylamonium iodide: 1H NMR (DMSO, 500 MHz): δ = 2.37 (s, CH3). 13C NMR (DMSO,
125 MHz): δ = 24.7.
Formamidinium iodide : 1H NMR (DMSO, 500 MHz): δ = 7.84 (s, CH). 13C NMR (DMSO,
125 MHz): δ = 157.4.
N-methyl formamidinium iodide : 1H NMR (DMSO, 500 MHz): δ = 7.94 (s, CH), 2.81 (s, CH3). 13C NMR (DMSO, 125 MHz): δ = 155.4 (CH), 28.0 (CH3).
N, N'-dimethyl formamidinium iodide: 1H NMR (DMSO, 500 MHz): δ = 2.96 (s, CH3NH2CH=NCH3), 2.81 (s, CH3NH2CH=NCH3).
Supporting Information
The Supporting Information is available online. Table of review of perovskite solution compositions for very high efficiency PCS with their references; Experimental Section; XRD patterns of α-FAPbI3, MAPbI3, MC20, MC30, MC40, MC48 and MC55 thin films; 1H NMR
spectra of MC48, MC40 and MC55, 13C NMR spectrum and c1H & 13C NMR spectrum correlation diagram of MC48; Table of x; Absorbance spectra of α-FAPbI3, MAPbI3, MC20,
MC30, MC40, MC48 and MC55 thin films; Table of J-V curves parameters of MC20, MC30, MC48 and FAPI cells; Stability trackings.
12
Acknowledgements
T.Z. and D.Z. thank the CSC-Paristech and CSC programs for Ph.D scholarship. The ANR agency and the Ile de France Region are acknowledged for financial support via the Moreless project ANR-18-CE05-0026 and the SESAME equipment project, respectively. The NSFC (21703070), the Science and Technology Program of Guangzhou (201804010176 ) and the Guangdong Basic and Applied Basic Research Foundation (2020A1515010378) are acknowledged for funding.
Received: ((will be filled in by the editorial staff)) Revised: ((will be filled in by the editorial staff)) Published online: ((will be filled in by the editorial staff))
References
[1] B. Saparov, D. B. Mitzi, Chem. Rev. 2016, 116, 4558–4596.
[2] M. M. Lee, J. Teuscher, T. Miyasaka, T. N. Murakami, H. J. Snaith, Science 2012, 338, 643–647.
[3] W. S. Yang, B. W. Park, E. H. Jung, N. J. Jeon, Y. C. Kim, D. U. Lee, S. Shin, J. Seo, E. K. Kim, J. H. Noh, S. I. Seok, Science 2017, 356, 1376–1379.
[4] J. Zhang, E. J. Juarez-Perez, I. Mora-Sero, B. Viana, T. Pauporté, J. Mater. Chem. A,
2015, 3, 4909–4915.
[5] P. J. Wang, Z. Shao, M. Ulfa, T. Pauporté, J. Phys. Chem. C 2017, 121, 9131–9141. [6] P. J. Wang, M. Ulfa, T. Pauporte, J. Phys. Chem. C 2018, 122, 1973–1981.
[7] A. Leblanc, N. Mercier, M. Allain, J. Dittmer, V. Fernandez, T Pauporté, Angew. Chem.
Int. Ed. 2017, 56, 16067–16072.
[8] M. Ulfa, P. J. Wang, J. Zhang, J. W. Liu, W. D. de Marcillac, L. Coolen, S. Peralta, T. Pauporté, ACS Appl. Mater. Interfaces 2018, 10, 35118–35128.
[9] S. -H. Turren-Cruz, A. Hagfeldt, M. Saliba, Science 2018, 362, 449–453.
[10] N. J. Jeon, H. Na, E. H Jung, T. Y. Yang, Y. G. Lee, G. Kim, H. W. Shin, S. I. Seok, J. Lee, J. Seo, Nature Energy 2018, 3, 682–689.
13
[11] Q. Jiang, Y. Zhao, X. W. Zhang, X. L. Yang, Y. Chen, Z. M. Chu, Q. F. Ye, X. X. Li, Z. G. Yin, J. B. You, Nature Photonics 2019, 13, 460–466.
[12] E. H. Jung, N. J. Jeon, E. Y. Park, C. S. Moon, T. J. Shin, T. Y. Yang, J. H. Noh, J. Seo,
Nature 2019, 567, 511–515.
[13] J. J Yoo, S. Wieghold, M. C. Sponseller, M. R. Chua, S. N. Bertram, N. T. P. Hartono, J. S. Tresback, E. C. Hansen, J. P. Correa-Baena, V. Bulovic, T. Buonassisi, S. S. Shin, M. G. Bawendi, Energy Environ. Sci. 2019, 12, 2192–2199.
[14] Y. H. Liu, S. Akin, L. F. Pan, R. Uchida, N. Arora, J. V. Milic, A. Hinderhofer, F. Schreiber, A. R. Uhl, S. M. Zakeeruddin, A. Hagfeldt, M. I. Dar, M. Gratzel, Sci. Adv.
2019, 5, eaaw2543.
[15] M. Kim, G. -H. Kim, T. K. Lee, I. W. Choi, H. W. Choi, Y. Jo, Y. J. Yoon, J. W. Kim, J. Lee, D. Huh, H. Lee, S. K. Kwak, J. Y. Kim and D. S. Kim, Joule 2019, 3, 1–14. [16] NREL chart (2020) https://www.nrel.gov/pv/cell-efficiency.html
[17] T. Zhu, J. Su, F. Labat, I. Ciofini, T. Pauporté, ACS Appl. Mater. Interfaces 2020, 12, 744–752.
[18] G. Tumen-Ulzii, C. Qin, D. Klotz, M. R. Leyden, P. Wang, M. Auffray, T. Fujihara, T. Matsushima, J. -W. Lee, S. -J. Lee, Y. Yang, Adv. Mater. 2020, 32, 1905035.
[19] W. Nie, H. Tsai, R. Asadpour, J. C. Blancon, A. J. Neukirch, G. Gupta, J. J. Crochet, M. Chhowalla, S. Tretiak, M. A. Alam and H. L. Wang, Science 2015, 347, 522–525.
[20] E. Edri, S. Kirmayer, S. Mukhopadhyay, K. Gartsman, G. Hodes, D. Cahen, Nat.
Commun. 2014, 5, 3461.
[21] A. Buin, P. Pietsch, J. X. Xu, O. Voznyy, R. Comin, E. H. Sargent, Nano Lett. 2014, 14, 6281–6286.
14
[23] Fen. Xie, C. -C. Chen, Y. Wu, X. Li, M. Cai, X. Liu, X. Yang, L. Han, Energy Environ.
Sci. 2017, 10, 1942–1949.
[24] Y. -H. Wu, Y. Ding, X. -Y. Liu, X. Pan, J. -H. Wu, S. -Y. Dai, Sol. RRL 2020, 4, 1900183.
[25] W. T. M. Gompel, R. Herckens, G. Reekmans, B. Ruttens, J. D’Haen, P. Adriaenssens, L. Lutsen, D. Vanderzande, J. Phys. Chem. C 2018, 122, 4117−4124.
[26] A. Leblanc, N. Mercier, M. Allain, J. Dittmer, T. Pauporté, V. Fernandez, F. Boucher, M. Kepenekian, C. Katan, ACS Appl. Mater. Interfaces 2019, 11, 20743–20751. [27] X. Wang, Y. Fan, L. Wang, C. Chen, Z. Li, R. Liu, H. Meng, Z. Shao, X. Du, H. Zhang,
G. Cui, S. Pang, Chem 2020, DOI : 10.1016/j.chempr.2020.02.016.
[28] W. M. Franssen, B. J. Bruijnaers, V. HL Portengen, A. P. M. Kentgens, ChemPhysChem
2018, 19, 3107–3115.
[29] T. Moot, A. R. Marshall, L. M. Wheeler, S. N. Habisreutinger, T. H. Schloemer, C. C. Boyd, D. R. Dikova, G. F. Pach, A. Hazarika, M. D. McGehee, H. J. Snaith, J. M. Luther, Adv. Energy Mater. 2020, 1903365.
[30] L. T. Schelhas, Z. Li, J. A. Christians, A. Goyal, P. Kairys, S. P. Harvey, D. H. Kim, K. H. Stone, J. M. Luther, K. Zhu, V. Stevanovic, J. J. Berry, Energy Environ. Sci. 2019,
15
Figure 1. (a-c) Typical SEM images of the perovskite layers surface with various MACl
additive mol%. (a-c) Share the same scale bar. (d) Statistical analysis of the effect of MACl additive fraction on the grain size. (e) Cross-sectional SEM view of a MC48 perovskite solar cell.
16
Figure 2. (a) XRD patterns of the perovskite layers. (b) is a zoom view of (a). # symbol marks
a FTO substrate peak. (c) Absorbance Tauc plots and (d) normalized photoluminescence spectra of α-FAPbI3, MAPbI3, MC40, MC48 and MC55 layers.
1.5 1.6 1.7 0.0 0.4 0.8 1.2 1.6 2.0 (a h n) 2 hn (eV) MAPbI3 MC55 MC48 MC40 FAPbI3 1.528 1.537 1.597 10 15 20 25 30 0 10k 20k 30k 40k Int en si ty (a .u. ) 2 Theta (°) MC55 MC48 MC40 # (1 00 ) (2 00 ) (1 10 ) (1 11 ) 13.5 14.024.0 24.5 26.5 28.0 28.5 0 10k 20k 30k 40k Int en si ty (a .u. ) 2 Theta (°) # MC55 MC48 MC40 (1 00 ) (1 11 ) (2 00 ) 700 750 800 850 900 0.0 0.2 0.4 0.6 0.8 1.0 Norma lis ed in ten si ty (a .u. ) Wavelength (nm) MAPbI3 MC55 MC48 MC40 FAPbI3 775nm 811nm 814nm
(a)
(b)
(c)
(d)
17
Figure 3. 1H-NMR spectra of (a) MAI, (b) FAI and (c) MC48 layer with indexation. 1. NH=CHNH 3I; 2. CH3NH2CH=NHI; 3. CH3NH3I; 4. CH3NH2CH=NHI + CH3N=CHNH2CH3I; 5. CH3N=CHNH2CH3I (N,N’-dimethyl FAI).
Table 1. Photovoltaic J-V parameters of FA0.94MA0.06PbI3 cells among the best, prepared with
various MACl%, (under AM 1.5G conditions, 100 mW/cm2).
Cell Scan Direction Voc/ V Jsc / mA.cm-2 FF/ % PCE/ % HIa/%
MC40 Reverse Forward 1.043 1.035 25.79 25.82 78.21 76.11 21.05 20.34 3.3 MC48 Reverse Forward 1.066 1.048 25.95 25.94 80.08 78.16 22.15 21.25 4.0 MC55 Reverse Forward 1.026 1.012 25.90 25.92 80.63 77.83 21.42 20.42 4.5 [a] Hysteresis index defined as [PCE(%)rev-PCE(%)for]/PCE(%)rev
18
Figure 4. (a) J-V curves of MC40, MC48 and MC55. solar cells (reverse scan). (b) Statistical
analysis of the J-V parameters. (c) EQE spectra and integration curve of JSC.
Figure 5. (a) J-V forward and reverse curves of the best FA1-xMAxPbI3 cell. (b) Tracking of the
20
Table of contents entry
MACl additive is employed to synthesize FA1-xMAxPbI3 films. The best molar fraction of this
additive is determined. The MA content in the thin films actually used in solar cells is determined at x= 0.06. This amount is thermodynamically the best for the stabilization of this highly efficient perovskite. The perovskite solar cell achieves a stabilized power conversion efficiency as high as 22.06%.
Keywords: Perovskite solar cell, Stabilization by methylammonium, NMR, High efficiency,
Organic cations composition
Tao Zhu,a Daming Zheng,a Marie-Noelle Rager,b Thierry Pauporté*a
The Stabilization of Formamidinium Lead Tri-Iodide Perovskite through a Methylammonium-Based additive for High Efficiency Solar Cells
21
Copyright WILEY-VCH Verlag GmbH & Co. KGaA, 69469 Weinheim, Germany, 2018.
Supporting Information
The Stabilization of Formamidinium Lead Tri-Iodide Perovskite through a Methylammonium-Based additive for High Efficiency Solar Cells
Tao Zhu,a Daming Zheng,a Marie-Noelle Rager,b Thierry Pauporté*a
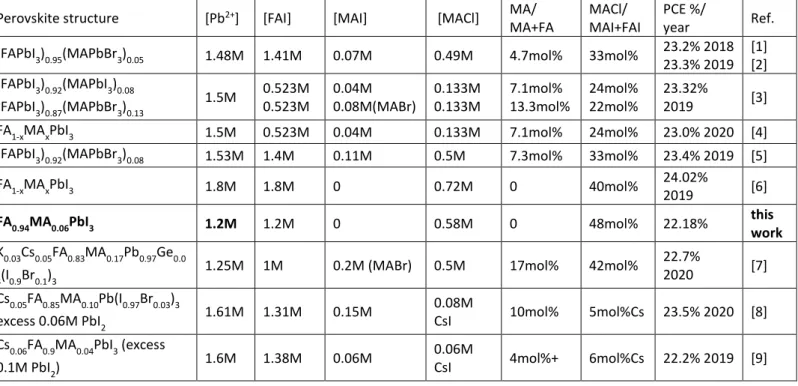
Table S1: Review of perovskite structure and precursor solution composition of PSCs with
PCE > 22% published in the literature.
Perovskite structure [Pb2+] [FAI] [MAI] [MACl] MA/
MA+FA
MACl/ MAI+FAI
PCE %/
year Ref.
(FAPbI3)0.95(MAPbBr3)0.05 1.48M 1.41M 0.07M 0.49M 4.7mol% 33mol% 23.2% 2018
23.3% 2019 [1] [2] (FAPbI3)0.92(MAPbI3)0.08 (FAPbI3)0.87(MAPbBr3)0.13 1.5M 0.523M 0.523M 0.04M 0.08M(MABr) 0.133M 0.133M 7.1mol% 13.3mol% 24mol% 22mol% 23.32% 2019 [3]
FA1-xMAxPbI3 1.5M 0.523M 0.04M 0.133M 7.1mol% 24mol% 23.0% 2020 [4]
(FAPbI3)0.92(MAPbBr3)0.08 1.53M 1.4M 0.11M 0.5M 7.3mol% 33mol% 23.4% 2019 [5]
FA1-xMAxPbI3 1.8M 1.8M 0 0.72M 0 40mol% 24.02%
2019 [6]
FA0.94MA0.06PbI3 1.2M 1.2M 0 0.58M 0 48mol% 22.18% this
work
K0.03Cs0.05FA0.83MA0.17Pb0.97Ge0.0
3(I0.9Br0.1)3
1.25M 1M 0.2M (MABr) 0.5M 17mol% 42mol% 22.7%
2020 [7]
Cs0.05FA0.85MA0.10Pb(I0.97Br0.03)3
excess 0.06M PbI2 1.61M 1.31M 0.15M
0.08M
CsI 10mol% 5mol%Cs 23.5% 2020 [8]
Cs0.06FA0.9MA0.04PbI3 (excess
0.1M PbI2) 1.6M 1.38M 0.06M
0.06M
22
Experimental Section
Preparation of Substrate, compact-TiO2 and mesoporous TiO2 Layers: Fluorine-doped SnO2
(FTO) substrates (TEC 7 from Pilkington) were etched pattern by zinc powder and 10% HCl solution prior to be cleaned with soap and water. The substrates were subsequently immersed for 20 min in a concentrated 2.2 M NaOH in ethanol/water (10:1 v/v %) and then rinsed with deionized water in an ultrasonic bath for 15 min. The substrates were subsequently heated at 500°C for 15 min. The compact TiO2 hole blocking layer, noted c-TiO2, was prepared by
aerosol spray pyrolysis. A TiO2 nanoparticle solution employed for the preparation of the
mesoporous layer, noted mp-TiO2, was prepared in advance and stirred for at least 12h. The
TiO2 NR30-D paste (from Greatcell) was diluted in ethanol with a 1:7 w/w ratio. 45 μL of the
solution was dropped on the compact TiO2 layer and spin-coated at 2000 rpm for 15 s. The
layer was then dried on a hotplate at 70 °C for 5-10 min and finally heated at 500 °C under an air flux for 30 min, cooled down to 200 °C and removed from the hotplate.
Preparation of Perovskite Layer: A mixed cation precursor solution with a 1.2M concentration
was prepared by mixing 206 mg of formamidinium iodide (FAI, greatcell), 553 mg of PbI2
(TCI), and 16.2 mg, 24.3 mg, 32.4 mg, 38.9 mg and 44.6 mg (20 mol%, 30mol%, 40 mol%, 48 mol% and 55 mol%, respectively) of methylammonium chloride (MACl, Alfa aesar) in 800 μL DMF and 200 μL DMSO. The solution was stirred for a minimum of 2-4h at room temperature in a N2 glovebox. 45 μL of this solution was placed on top of the substrates. A two-step
spin-coating program was employed: first spinning at 1000 rpm for 10 s and then at 6000 rpm for 30 s. 100 µL of chlorobenzene was dripped 20 s after the starting of the spinning routine. The films were then annealed at 153 °C for 13 min. These films and corresponding solar cells are noted MC20, MC30, MC40, MC48 and MC55. The PEAI post-deposition treatment consisted in dropping 60 μL of a 10 mM 2-Phenylethylamine Hydroiodide (PEAI) solution (2.49 mg in 1
23
mL of isopropanol) onto the cold perovskite film. A one-step spin-coating program was employed: 2000 rpm/s acceleration, 3000rpm for 20s. For the FAPbI3 films, the precursor
solution had a 1.2 M concentration. 103.18 mg of FAI and 276.7 mg of PbI2 were mixed in 100
μL DMSO and 400 μL DMF. The spin coating procedure was the same and the annealing time at 153°C was 18 min.
HTM layer and Gold Contact: The hole transporting material (HTM) solution was prepared by
dissolving 78 mg of Spiro-OMeTAD (Borun New Material Technology) in 1 mL of chlorobenzene. Then, 17.9 µL of bis(trifluoromethylsulfonyl)imide lithium salt solution (Li-TFSI) (Sigma Aldrich) solution (517 mg in 1 mL ACN), 30.4 µL of TBP (tert-butylpyridine) (Sigma Aldrich) and 14 µL of tris(2-1H-pyrazol-1-yl)-4-tert-butylpyridine)-cobalt(III) tris (bis(trifluoromethylsulfonyl)imide) (Dyesol, FK209) (376 mg in 1 mL acetonitrile) were added to this solution. 40 µL of the HTM solution was spin-coated at 4000 rpm for 30 s. Finally, the device was completed by thermally evaporating a 70-80 nm thick gold back contact on the Spiro-OMeTAD layer. The solar cells where matured by storing them several days in a N2
glovebox before to be characterized.
Characterization Methods: The J-V curves were recorded by a Keithley 2410 digital
sourcemeter, using a 0.1 V.s-1 voltage scan rate. The solar cells were illuminated with a solar simulator (Abet Technology Sun 2000) filtered to mimic AM 1.5G conditions (100 mW/cm2). The illuminated surface was delimited by a black mask with an aperture diameter of 3 mm. The power density was calibrated at 100 mW.cm-2 by the use of a reference silicon solar cell.
The structure of the organolead perovskite film was characterized by a PANanalytical X-Pert high-resolution X-ray diffractometer (XRD) operated at 40 kV and 45 mA and using the CuKα radiation with λ= 1.5406 Å. The film specular absorbance was measured by a Cary 5000 UV-Vis-NIR spectrophotometer. A glass/FTO/c-TiO2/mp-TiO2 sample was used as the baseline.
24
spectrophotometer. The sample morphologies were examined with a high resolution Ultra 55 Zeiss FEG field-emission scanning electron microscope (FE-SEM) in the in-lens mode. The EDX spectra were measured with a Quantax system from Bruker operated at 15 kV.
NMR (1H and 13C) spectra were recorded on a Bruker Avance 500 MHz Neo spectrometer. Chemical shifts are given in ppm using the residual DMSO solvent signal as an internal reference. Perovskite layers deposited on a sprayed c-TiO2 layer were dissolved in DMSO-d6
solvent (99.96 %D, H2O<0.01%, Euriso-top) and the NMR spectra of solutions were measured.
Methylamonium iodide: 1H NMR (DMSO, 500 MHz): δ = 2.37 (s, CH3). 13C NMR (DMSO,
125 MHz): δ = 24.7.
Formamidinium iodide : 1H NMR (DMSO, 500 MHz): δ = 7.84 (s, CH). 13C NMR (DMSO,
125 MHz): δ = 157.4.
N-methyl formamidinium iodide : 1H NMR (DMSO, 500 MHz): δ = 7.94 (s, CH), 2.81 (s, CH3). 13C NMR (DMSO, 125 MHz): δ = 155.4 (CH), 28.0 (CH3).
N, N'-dimethyl formamidinium iodide: 1H NMR (DMSO, 500 MHz): δ = 2.96 (s, CH3NH2CH=NCH3), 2.81 (s, CH3NH2CH=NCH3).
25
Figure S1. XRD patterns of α-FAPbI3, MAPbI3, MC20, MC30, MC40, MC48 and MC55 thin
films prepared by spin-coating. # symbol marks a FTO substrate peak. (b) is a zoom view of (a) with a longer counting time.
(b)
(a)
26
Figure S2a: 1H NMR spectrum of the MC48 film. : Formamidinium; ◼ : Methylamonium, ⚫: N-methyl formamidinium; : N, N'-dimethyl formamidinium
Figure S2b: 13C NMR spectrum of the MC48 film. : Formamidinium; ◼ : Methylamonium, ⚫: N-methyl formamidinium.
27
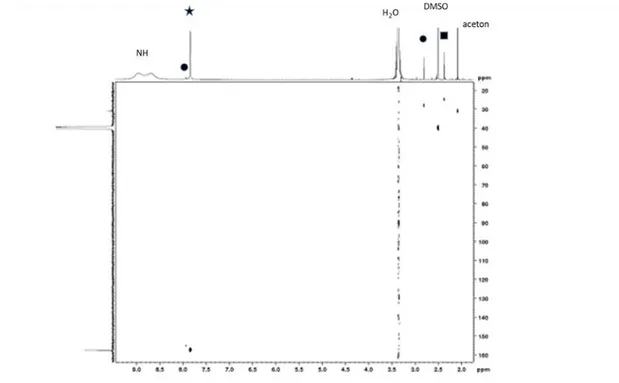
Figure S2c: 1H-13C HSQC NMR spectrum of MC48 film. : Formamidinium; ◼ : Methylamonium, ⚫: N-methyl formamidinium.
Figure S2d: 1H NMR spectrum of the MC40 film. : Formamidinium; ◼ : Methylamonium, ⚫: N-methyl formamidinium; : N, N'-dimethyl formamidinium.
28
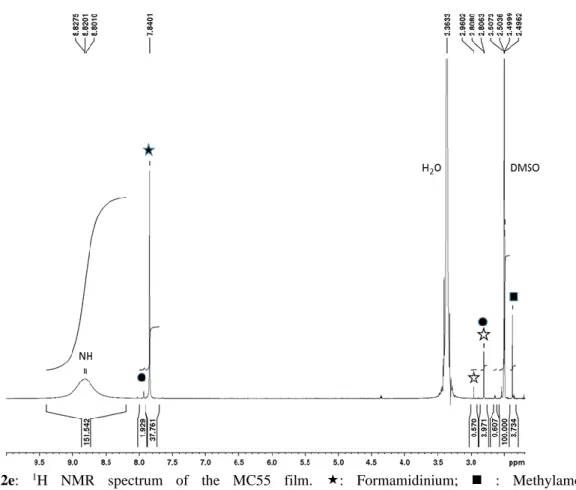
Figure S2e: 1H NMR spectrum of the MC55 film. : Formamidinium; ◼ : Methylamonium,
⚫: N-methyl formamidinium; : N, N'-dimethyl formamidinium.
Table S2: x in FA1-xMAxPbI3 films determined by 1H-NMR.
MC20 MC30 MC40 MC48 MC55
MACl mol.% 20 30 40 48 55
29
Figure S3. Absorbance spectra of α-FAPbI3, MAPbI3, MC20, MC30, MC40, MC48 and MC55
films.
Table S3. J-V curves parameters of (a) MC20, MC30 and MC48 cells, without PEAI surface
treatment; (b) of the best cell and of a typical pure FAPI cell.
(a)
Cell Scan direction Voc /V Jsc /mA/cm2 FF /% PCE /% HI/%
MC20 Reverse 0.926 23.49 71.59 15.56 21.2 Forward 0.866 23.33 60.62 12.25 MC30 Reverse 0.971 24.67 73.84 17.68 7.3 Forward 0.967 24.70 68.60 16.38 MC48 Reverse 0.971 25.35 74.41 18.32 6.6 Forward 0.967 25.25 70.03 17.10 (b)
Best cell Scan
direction VOC /V JSC mA/cm2 FF /% PCE /% HI/%
MC48 Reverse 1.060 25.94 80.62 22.18 3.7
Forward 1.052 25.93 78.26 21.35
FAPI Reverse 0.789 17.19 45.97 6.23 8.8
30
Figure S4. (a) Tracking of FAPI, MAPI and MC48 solar cell normalized power outputs under
continuous one sun AM1.5G illumination (unencapsulated devices, 45% RH). (b) Normalized PCE and J-V parameters evolution of MC48 and MAPI unencapsulated cells upon storage in a chamber with a 90% RH.
References
[1] N. J. Jeon, H. Na, E. H Jung, T. Y. Yang, Y. G. Lee, G. Kim, H. W. Shin, S. I. Seok, J. Lee, J. Seo, Nature Energy 2018, 3, 682–689.
[2] E. H. Jung, N. J. Jeon, E. Y. Park, C. S. Moon, T. J. Shin, T. Y. Yang, J. H. Noh, J. Seo,
Nature 2019, 567, 511–515.
(a)
31
[3] Q. Jiang, Y. Zhao, X. W. Zhang, X. L. Yang, Y. Chen, Z. M. Chu, Q. F. Ye, X. X. Li, Z. G. Yin, J. B. You, Nature Photonics 2019, 13, 460–466.
[4] Y. Zhao, P. Zhu, M. Wang, S. Huang, Z. Zhao, S. Tan, T.H. Han, J.W. Lee, T. Huang, R. Wang, J. Xue, Adv. Mater. 2020, Doi.org/10.1002/adma.201907769.
[5] J. J. Yoo, S. Wieghold, M. C. Sponseller, M. R. Chua, S. N. Bertram, N. T. P. Hartono, J. S. Tresback, E. C. Hansen, J. P. Correa-Baena, V. Bulovic, T. Buonassisi, S. S. Shin, M. G. Bawendi, Energy Environ. Sci. 2019, 12, 2192–2199.
[6] M. Kim, G. -H. Kim, T. K. Lee, I. W. Choi, H. W. Choi, Y. Jo, Y. J. Yoon, J. W. Kim, J. Lee, D. Huh, H. Lee, S. K. Kwak, J. Y. Kim and D. S. Kim, Joule 2019, 3, 1–14. [7] G.M. Kim, A. Ishii, S. Öz, T. Miyasaka, Adv. Energy Mater. 2020,10,1903299.
[8] H. Zhu, Y. Liu, F.T. Eickemeyer, L. Pan, D. Ren, M.A. Ruiz‐Preciado, B. Carlsen, B. Yang, X. Dong, Z. Wang, H. Liu, S. Wang, S.M. Zakeeruddin, A. Hagfeldt, M. I. Dar, X. Li, M. Grätzel, Adv. Mater. 2020, 32,1907757.
[9] Y. H. Liu, S. Akin, L. F. Pan, R. Uchida, N. Arora, J. V. Milic, A. Hinderhofer, F. Schreiber, A. R. Uhl, S. M. Zakeeruddin, A. Hagfeldt, M. I. Dar, M. Gratzel, Sci. Adv.