HAL Id: cea-01883311
https://hal-cea.archives-ouvertes.fr/cea-01883311
Submitted on 27 Sep 2018
HAL is a multi-disciplinary open access
archive for the deposit and dissemination of
sci-entific research documents, whether they are
pub-lished or not. The documents may come from
teaching and research institutions in France or
abroad, or from public or private research centers.
L’archive ouverte pluridisciplinaire HAL, est
destinée au dépôt et à la diffusion de documents
scientifiques de niveau recherche, publiés ou non,
émanant des établissements d’enseignement et de
recherche français ou étrangers, des laboratoires
publics ou privés.
Interpretable and stable prediction of schizophrenia on a
large multisite dataset using machine learning with
structured sparsity
Amicie de Pierrefeu, Tommy Lofstedt, Charles Laidi, Fouad Hadj-Selem,
Marion Leboyer, Philippe Ciuciu, Josselin Houenou, Edouard Duchesnay
To cite this version:
Amicie de Pierrefeu, Tommy Lofstedt, Charles Laidi, Fouad Hadj-Selem, Marion Leboyer, et al..
Interpretable and stable prediction of schizophrenia on a large multisite dataset using machine
learn-ing with structured sparsity. 2018 International Workshop on Pattern Recognition in Neuroimaglearn-ing
(PRNI), Jun 2018, Singapore, Singapore. �10.1109/PRNI.2018.8423946�. �cea-01883311�
Interpretable and stable prediction of schizophrenia
on a large multisite dataset using machine learning
with structured sparsity
Amicie de Pierrefeu
1, Tommy L¨ofstedt
2, Charles Laidi
1, 3, 4, 5, Fouad Hadj-Selem
6,
Marion Leboyer
3, 4, 5, Philippe Ciuciu
1, Josselin Houenou
1, 3, 4, 5and Edouard Duchesnay
11NeuroSpin, CEA, Paris-Saclay, France
2Department of Radiation Sciences, Ume˚a University, Ume˚a - Sweden 3 Institut National de la Sant´e et de la Recherche M´edicale (INSERM),
U955, Institut Mondor de Recherche Biom´edicale, Psychiatrie Translationnelle, Cr´eteil, France
4Fondation Fondamental, Cr´eteil, France
5Pˆole de Psychiatrie, Assistance Publique Hˆopitaux de Paris (AP-HP),
Facult´e de M´edecine de Cr´eteil, DHU PePsy, Hˆopitaux Universitaires Mondor, Cr´eteil, France
6Energy Transition Institute: VeDeCoM - France
Abstract—The use of machine-learning (ML) in neuroimaging offers new perspectives in early diagnosis and prognosis of brain diseases. Indeed, ML algorithms can jointly examine all brain features to capture complex relationships in the data in order to make inferences at a single-subject level. To deal with such high dimensional input and the associated risk of overfitting on the training data, a proper regularization (or feature selection) is required. Standard `2-regularized predictors, such as Support
Vector Machine, provide dense patterns of predictors. However, in the context of predictive disease signature discovery, it is now essential to understand the brain pattern that underpins the prediction. Despite `1-regularized (sparse) has often been
advocated as leading to more interpretable models, they generally lead to scattered and unstable patterns. We hypothesize that the integration of prior knowledge regarding the structure of the input images should improve the relevance and the stability of the predictive signature. Such structured sparsity can be obtained by combining together `1 (possibly `2) and Total variation (TV)
penalties. We demonstrated the relevance of using ML with structured sparsity on a large multisite dataset of schizophrenia patients and controls. Using 3D maps of grey matter den-sity, we obtained promising inter-site prediction performances. More importantly, we have uncovered a predictive signature of schizophrenia that is clinically interpretable and stable across resampling. This suggests that structured sparsity provides a major breakthrough over ’off-the-shelf’ algorithms to perform a robust selection of important brain regions in the context of biomarkers discovery.
I. INTRODUCTION
Schizophrenia is a disabling chronic mental disorder char-acterized by deficits in cognition. Over the years, struc-tural MRI has been increasingly used to gain insight into the abnormalities inherent to the pathology. [12]. Recent progress in machine-learning together with the availability of large datasets now pave the way for automatic detection of schizophrenia disease based on neuroanatomical features.
[2, 8–11] However, to date, despite initial promising results, these studies have barely impacted clinical practice. Significant challenges still need to be tackled for translational implemen-tation of such findings in psychiatry. First, in the context of predictive signature discovery, it is crucial to understand the brains structural patterns that underpin a prediction. Unfortu-nately, in most cases, despite accurate prediction performance, classifiers still behave as black box models, not providing objective neuroanatomical markers and by that, ruling out the prospect of clinical applications. Second, reproducibility of the predictive model across sites is also questionable. So far, most studies used individuals scanned at a single acquisition site. Such results are difficult to generalize to large-scale clinical settings, with subjects scanned in multiple sites. Consequently, multi-site populations are instrumental to achieve consistency and reproducibility in the results. To our knowledge, only a few studies have relied on a completely independent validation cohort to estimate prediction performances of a classifier [8, 10, 11].
In this work, we intended to address those important ques-tions in a large multi-site cohort of 606 subjects. We propose to evaluate the inter-site prediction performance of schizophrenia patients using sMRI-based features. Different state-of-the-art classifiers were compared to assess their performance replica-bility across sites and the interpretareplica-bility and stareplica-bility of their predictive weight maps.
II. METHODS
A. Participants
Brain imaging data from 4 independent studies with no prior coordination were gathered in the current analysis (COBRE, NMorphCH and NUSDAST from the public repository Schiz-connect and VIP cohort). The full dataset included 276 patients
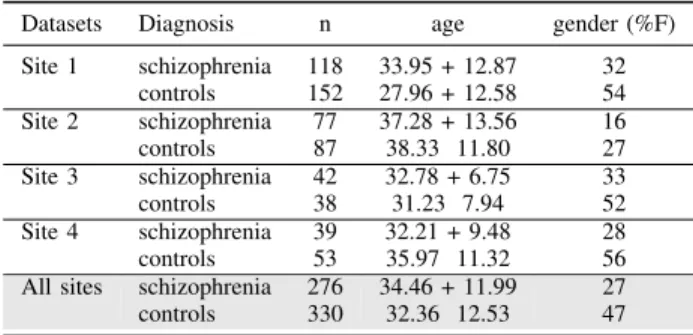
TABLE I: Demographic characteristics of the dataset.
Datasets Diagnosis n age gender (%F) Site 1 schizophrenia 118 33.95 + 12.87 32 controls 152 27.96 + 12.58 54 Site 2 schizophrenia 77 37.28 + 13.56 16 controls 87 38.33 11.80 27 Site 3 schizophrenia 42 32.78 + 6.75 33 controls 38 31.23 7.94 52 Site 4 schizophrenia 39 32.21 + 9.48 28 controls 53 35.97 11.32 56 All sites schizophrenia 276 34.46 + 11.99 27 controls 330 32.36 12.53 47
with strict schizophrenia, according to DSM-IV criteria, and 330 healthy controls. Subjects provided informed consent to participate in their respective studies. Demographic details of all four datasets are summarized in Table 1.
B. MRI preprocessing and features extraction
Prior to training classifiers, the first step was to compute samples from the structural MRI scans. Grey matter voxel-based morphometry (VBM) maps were computed for each subject using the procedure described in [1] using SPM12. The MNI brain mask was used to restrict voxels considered in the subsequent steps to 125,959 features representing the local grey matter volume (tissue probability with Jacobian intensity modulation) at each voxel.
C. Machine learning algorithms
Machine Learning applied to whole brain neuroimaging data faces an imbalance situation where the large number of features (usually voxels) exceeds the number of sam-ples. Learning with hundreds of samples using such high-dimensional data is associated with a high risk of overfitting on the training set, leading to poor performances on independent subjects. Such issues of replicability can also be addressed using state-of-the-art regularized learning algorithms, such as linear SVM with a ridge penalty, or with elastic net [13], a combination of a sparsity-inducing (`1) penalty and a ridge
penalty `2. We compared several different linear classifiers for
binary classification. First, we used a regular linear SVM that produces dense patterns of predictors. In the context of pre-dictive signature discovery, it is crucial to understand the brain structural patterns that underpin the prediction. We, therefore, seek an approach that selects a reduced number of predictive regions. Feature selection methods, such as recursive feature elimination (RFE) [7], have been used to select a reduced set of predictors [3]. However, since wrappers are prone to local minima, those ad hoc heuristics tend to be replaced by sparse models, based on convex minimization problems, that optimize the prediction performance and simultaneously performs feature selection.
Despite the fact that `1-regularized (sparse) classifiers often
have been advocated as leading to more interpretable models, they appear to lead to scattered and unstable patterns in practice [6]. One solution to obtain more interpretable models
is to take benefit of the known structure of brain MRI images in order to force the solution to adhere to biological priors, thereby producing more plausible and interpretable solutions. Indeed, MRI data is naturally encoded on a 3-dimensional grid where some voxels are neighbors, and others are not. Structured sparsity can be obtained with several different penalties. The GraphNet (GN) penalty, described in [6]. GN combines `1 with a squared `2 penalty. It promotes
local smoothness of the weight map by forcing adjacent voxels/vertices to have similar weights, and it does this by imposing a squared `2 penalty on the gradient of the weight
map. Nonetheless, we hypothesized that GN would provide smooth solutions rather than clearly identified regions. On the basis of this hypothesis, we propose to use an alterna-tive to the GN penalty: The Enet-TV penalty [5]. Enet-TV combines `1, `2 and the total variation (TV) penalties. This
combination of penalties enforces spatial smoothness of the solution while simultaneously segmenting predictive regions from the background. The `1 and `2 penalties served the
purpose of addressing overfitting induced from the MRI data’s high intrinsic dimensionality. Meanwhile, the TV penalty also regularizes the solution, but also take advantage of the spatial 3D structure. It has been demonstrated that these penalties, together, generate a coherent, parsimonious, and interpretable weight map. Moreover, these penalties provide a segmentation of the predictive weight map into spatially contiguous parcels with almost constant values, a highly desirable characteristic in the scope of predictive signature discovery. Enet-TV has been successfully used, recently, in the prediction of pre-hallucination functional MRI patterns in a clinical population of schizophrenia patients [4]
D. Cross-validation and model-selection
The performance was assessed through a double validation pipeline. Such process consists of two nested cross-validation loops. In the outer (external) loop, a set of subjects is considered as the training data, while the remaining subjects are held out and used as the test data. The test sets were exclusively used for model assessment while the train sets were used in inner five loops for model fitting and model selection. Any hyper-parameters of the methods were set internally in the nested 5-fold cross-validation loop.
Fig. 1: Leave-one-site-out procedure
The splitting process of the samples into train and test subsets is crucial for performance evaluation. In order to in-vestigate the reproducibility of prediction performance across sites, we chose to carry out a leave-one-site-out procedure (Figure 1). Subjects from all sites except one are referred as the training data, while all subjects of the remaining site were held out and used as the test data. This strategy was repeated
four times, with each site being held out once. Such inter-site strategy is essential to evaluate the reproducibility of a prediction model on completely independent datasets. E. Performance assessment
The classifier performances were assessed by computing the balanced accuracy, sensitivity and specificity using the test samples. We also implemented the receiver operating characteristic (ROC) curve for each classifier, from which the area under the curve (AUC) was computed.
Along with the prediction performances, we also targeted a more important goal: the estimation of reproducible weight maps against variations of the learning samples. Indeed, clin-icians expect that the identified markers, i.e. the non-null weights of the weight map, to be similar if other patients, with identical clinical conditions, would have been used. We therefore used a similarity measure to assess the stability of those weights maps across re-sampling in the cross-validation scheme: The mean correlation between pairs of weights maps computed across the four folds and denoted rβ.
We also investigated the prediction performance behavior when varying number of subjects in the training set, while keeping the testing set identical. The goal is to evaluate the number of subjects required to reach the optimal prediction accuracy possible.
III. RESULTS
A. Performance
All four classifiers were able to significantly distinguish patients from healthy controls using grey matter VBM features (Table 2). However, the stability across folds of the weight maps (rβ) is much higher with TV-Enet than with other sparse
classifiers (Table II).
TABLE II: Prediction accuracies: Sensitivity (Sen, recall rate of trans samples), Specificity (Spe, recall rate of off samples) and Balanced accuracy (Acc): (Sen+Spe)/2; AUC indicates area under the curve, rβ (Mean correlation between pairs of
weights maps)
Classifier AUC Acc Spe Sen rβ
SVM 0.74 0.69 0.68 0.69 -ElasticNet 0.76 0.71 0.68 0.73 0.34 GraphNet 0.75 0.70 0.71 0.69 0.42 TV-Enet 0.74 0.68 0.68 0.68 0.74
B. Predictive weight maps
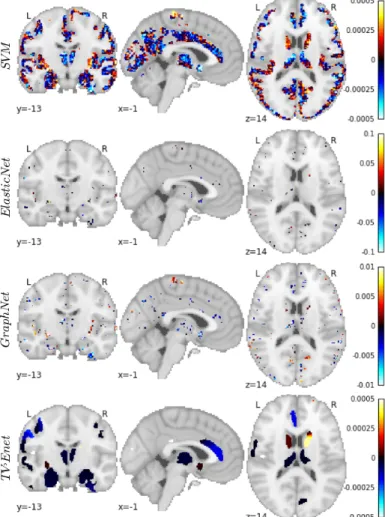
Predictive weights maps yielded by each classifier are pre-sented in Figure 2. When using the regular SVM classifier, the relevance of the obtained discriminative weight map appears limited. It is very dense and all grey-matter voxels seem to contribute to the prediction: it is clinically challenging to interpret. When using ElasticNet and GraphNet classifiers, the predictive patterns are very sparse and scattered across the
brain. Despite the fact that the prediction performance is rel-atively good, in a clinical setting, a physician will never draw a conclusion from such a black-box model. Understanding the structural brain patterns that drive the prediction is crucial. Meanwhile, the predictive map obtained with TV-Enet appears much more interpretable, since it provides a smooth map made of several clearly identifiable regions.
Fig. 2: VBM weight maps yielded by SVM, ElasticNet, GraphNet and TV-Enet classifiers
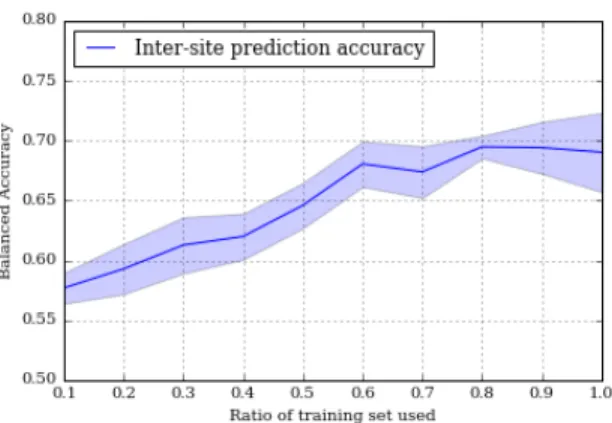
C. Learning curve
Figure 3 represents the inter-site prediction accuracy yielded when varying the number of subjects in the training set while holding a fixed testing set. The accuracy of prediction improves until 80% of the samples of training set are used.
IV. DISCUSSION
The inter-site prediction score (around 70-75%) obtained in this current study is consistent with the average performance reported in the literature [10, 11]. The predictive models developed on such heterogeneous data can reliably learn inter-site markers of schizophrenia that have the ability to generalize to the prediction of subjects from unseen site.
In term of prediction score, all classifiers under study perform similarly. However, besides the prediction scores,
Fig. 3: Learning curve: Performance of the predictive model over a varying number of training instances. The colored band represents the standard error of the prediction.
we are also interested in the interpretability and stability of the discriminative weight map. The predictive weight map provided by TV-Enet is much more interpretable than the maps yielded by the other classifiers. Indeed, a clearly defined predictive signature of schizophrenia is provided by TV-Enet, composed of areas such as the thalamus, hippocampus, amyg-dala, cingulate gyrus and striatum. Those markers are largely consistent with the current understanding of the neural basis of schizophrenia [12]. Moreover, the weight maps yielded by TV-Enet at each fold of the cross validation are very similar (rβ = 0.74). Indeed, when different subjects are used in the
training set, the identified markers that discriminate between schizophrenia patients and controls are almost identical. There-fore, the incorporation of spatial constraint in the learning scheme, through the TV penalty, has the ability to provide an interpretable predictive signature of the disease while having minimal impact on the predictive performance.
V. CONCLUSION
We developed effective predictive models of schizophrenia relying on MRI-based features. Leveraging spatial constraints with the TV penalty, we obtained promising inter-site predic-tion accuracy together with an interpretable and stable pre-dictive signature of schizophrenia. Such results are promising given the heterogeneity of the datasets. Future work would benefit from the aggregation of large independent cohorts.
REFERENCES
[1] J. Ashburner. Computational anatomy with the spm software. Magnetic resonance imaging, 27(8):1163– 1174, 2009.
[2] C. Davatzikos, D. Shen, R. C. Gur, X. Wu, D. Liu, Y. Fan, P. Hughett, B. I. Turetsky, and R. E. Gur. Whole-brain morphometric study of schizophrenia revealing a spatially complex set of focal abnormalities. Archives of general psychiatry, 62(11):1218–1227, 2005.
[3] F. De Martino, G. Valente, N. Staeren, J. Ashburner, R. Goebel, and E. Formisano. Combining multivariate
voxel selection and support vector machines for mapping and classification of fmri spatial patterns. Neuroimage, 43(1):44–58, 2008.
[4] A. de Pierrefeu, T. Fovet, F. Hadj-Selem, T. L¨ofstedt, P. Ciuciu, S. Lefebvre, P. Thomas, R. Lopes, R. Jardri, and E. Duchesnay. Prediction of activation patterns preceding hallucinations in patients with schizophrenia using machine learning with structured sparsity. Human brain mapping, 2018.
[5] M. Dubois, F. Hadj-Selem, T. Lofstedt, M. Perrot, C. Fis-cher, V. Frouin, and E. Duchesnay. Predictive support re-covery with tv-elastic net penalty and logistic regression: an application to structural mri. In Pattern Recognition in Neuroimaging, 2014 International Workshop on, pages 1–4. IEEE, 2014.
[6] L. Grosenick, B. Klingenberg, K. Katovich, B. Knutson, and J. E. Taylor. Interpretable whole-brain prediction analysis with graphnet. NeuroImage, 72:304–321, 2013. [7] I. Guyon, J. Weston, S. Barnhill, and V. Vapnik. Gene selection for cancer classification using support vector machines. Machine learning, 46(1-3):389–422, 2002. [8] Y. Kawasaki, M. Suzuki, F. Kherif, T. Takahashi, S.-Y.
Zhou, K. Nakamura, M. Matsui, T. Sumiyoshi, H. Seto, and M. Kurachi. Multivariate voxel-based morphometry successfully differentiates schizophrenia patients from healthy controls. Neuroimage, 34(1):235–242, 2007. [9] N. Koutsouleris, E. M. Meisenzahl, C. Davatzikos,
R. Bottlender, T. Frodl, J. Scheuerecker, G. Schmitt, T. Zetzsche, P. Decker, M. Reiser, et al. Use of neu-roanatomical pattern classification to identify subjects in at-risk mental states of psychosis and predict disease transition. Archives of general psychiatry, 66(7):700– 712, 2009.
[10] M. Nieuwenhuis, N. E. van Haren, H. E. H. Pol, W. Cahn, R. S. Kahn, and H. G. Schnack. Classification of schizophrenia patients and healthy controls from struc-tural mri scans in two large independent samples. Neu-roimage, 61(3):606–612, 2012.
[11] M. Rozycki, T. D. Satterthwaite, N. Koutsouleris, G. Erus, J. Doshi, D. H. Wolf, Y. Fan, R. E. Gur, R. C. Gur, E. M. Meisenzahl, et al. Multisite machine learning analysis provides a robust structural imaging signature of schizophrenia detectable across diverse patient pop-ulations and within individuals. Schizophrenia bulletin, 2017.
[12] T. G. van Erp, D. P. Hibar, J. M. Rasmussen, D. C. Glahn, G. D. Pearlson, O. A. Andreassen, I. Agartz, L. T. Westlye, U. K. Haukvik, A. M. Dale, et al. Subcortical brain volume abnormalities in 2028 individuals with schizophrenia and 2540 healthy controls via the enigma consortium. Molecular psychiatry, 21(4):547, 2016. [13] H. Zou and T. Hastie. Regularization and variable
selec-tion via the elastic net. Journal of the Royal Statistical Society: Series B (Statistical Methodology), 67(2):301– 320, 2005.