Determination of Moisture Diffusivity during Drying of
Mortar Cement: Experimental and Modeling Study
Lyes Bennamoun
1,*, Loubna Kahlerras
1,2, Frédéric Michel
3, Luc Courard
3, Thierry Salmon
1,
Laurent Fraikin
1, Azeddine Belhamri
2, Angélique Léonard
11Laboratory of Processing and Sustainable Development, Department of Applied Chemistry, University of Liège, B6C Sart-Tilman, 4000,
Liège, Belgium
2Département de Génie Climatique, Faculté des Sciences de l’Ingénieur, Université Mentouri, Constantine, 25000, Algeria 3GeMMe Building Materials Laboratory, University of Liège, 4000, Liège, Belgium
Abstract
The aim of this study is the experimental characterization of the behaviour of a mortar during convective drying. We focalise on mortar that has a rate water-cement of 0.5. The drying tests are developed in a micro-convective dryer that can use samples weighing from 0 to 8g. The advantage of these experiments is to reproduce the natural conditions that can be found during the treatment of the mortar-atmosphere problems. The response of the drying curve or the drying kinetic depends on the applied drying conditions. So, the temperature of the air varies from 60℃ to 130℃, the velocity of the air is changed from 2 m.s-1 to 5 m. s-1and the relative humidity is kept less than 1.7%. The comparison between the experimentalresults and the proposed analytical solutions of the equation of diffusion represented by Fick’s law, applied for a finite shape, allows determination of the values of the diffusion coefficient. It has a value of 1.71×10⁻¹⁰ m2.s-1 at 60℃, 13.69×10⁻¹⁰ m2.s-1 at
90℃ and 16.27×10⁻¹⁰ m2.s-1 at 130℃. Calculation of the activation energy and the D
0 constant are also possible.
Keywords
Thermal Energy, Convective Drying, Diffusion Coefficient, Operating Conditions1. Introduction
Materials based on cement, such as mortar, and cement pastes are still widely used in several construction sectors such as buildings and road constructions. This intensive use of mortar cement is due to its good mechanical properties, low cost but also can be reported to its durability which is one of the important parameters. The knowledge of the micro-structural changes and the interaction between water and solid, in particular during drying process, is one of the keys for durability studies of cement products. The application of non-controlled conditions can lead to the appearance of shrinkage, deformations and cracks, as it is reported in many studies[1-4]. So, deep studies dealing with happening transfers during the process could be necessary to have a final marketable material. Several works are focused on studying heat and mass transfer during drying of different materials, such as Gypsum board and wood[5], Bricks, plasters and stones[6] and the effect of the operating conditions[5] with determination of the moisture profile[6] and the drying kinetic changes[7]. The effect of the application of other parameters such as pressure[8], external wind velocity[9] and application of constraint stress[10] are
* Corresponding author:
[email protected] (Lyes Bennamoun) Published online at http://journal.sapub.org/ijee
Copyright © 2013 Scientific & Academic Publishing. All Rights Reserved
also studied. For mathematical modeling, two approaches are generally used; the first is by considering the materials as a porous media. In this first approach, heat and mass balances are applied for the different components of the material represented by gas, and solid phases[11-13]. It allows following, for the two phases, the variations of the humidity and the temperature of the media. The second approach consists on the use of the equation of diffusion. Numerous solutions and approximations of this equation are proposed leading to easily have the moisture profile inside the material and its variation with time. Diffusion coefficient is the most important parameter that can be calculated using this approach[14-19].
The objective of this work is the determination, based on experiments, of the moisture evolution during convective drying of a sample of mortar cement, the effect of the operating conditions on this profile and finally the calculation of the diffusion coefficient using analytical solutions of diffusion equation.
2. Materials and Methods
Samples are prepared at the Laboratory of Building Materials of the University of Liege. The samples are kept in a climatic room at 20.1℃ and 90% relative humidity (according to the recommendations of CEN[20]), until their utilization.
Figure 1. Detailed scheme of the convective dryer[22]
The mortar is constituted of three components: one part of Ordinary Portland Cement, three parts of normalized sand that contains 98% of silica and a half part of water. The Water to Cement ratio is 0.5. The mix portions are presented in Table 1.
The samples have a cylindrical shape with a diameter of 13mm and a height of 17mm.
Table 1. Mix portions of the mortar
Component Reference Weight (g) Sand EN 196 1350.5 Cement CEM I 52.5 R HES 450.2 Water Tap water 225.1
Water/Cement ratio = 0.5
2.1. Presentation of the Drying System
Drying tests are realized in a micro-convective dryer that can dry small samples whose weight cannot exceed 8g. The micro-dryer was initially developed to undertake samples of wastewater sludge[21]. A representative schema of the convective dryer is shown in Figure 1. The micro-dryer is divided into two parts: the air conditioning and feeding system and the drying chamber. Air is fed from the laboratory compressed air network. A pneumatic valve connected to a mass flowmeter controls the flow rate. The air can be humidified or heated by passing through respectively the steam generation zone or the heating channel. Then the air is directed to the drying chamber. So, the air humidity, temperature and flowrate are continuously controlled. Inside the drying chamber, the sample is linked to a precision weighting device (BP 150 from Sartorius, accuracy: 0.001 g)
connected to a PC that records the mass of the sample. The micro-dryer can operate between 20℃ and 180℃ and from 0.3 m.s-1 to 5 m. s-1.
3. Mathematical Modeling
As exposed previously, moisture profile of a building material during drying can be well described using Fick’s law represented by the equation of diffusion written under the following form, for an unsteady state and one dimensional case:
𝜕𝜕𝜕𝜕
𝜕𝜕𝜕𝜕 = 𝐷𝐷𝑒𝑒𝑒𝑒𝑒𝑒 � 1
𝑦𝑦𝑛𝑛� �𝜕𝜕𝑦𝑦𝜕𝜕��𝑦𝑦𝑛𝑛 𝜕𝜕𝜕𝜕 (𝑦𝑦,𝜕𝜕)𝜕𝜕𝑦𝑦 � (1)
“n” takes the value of “0” for a plate, “1” for a cylinder and “2” for a sphere. Crank[23] proposed analytical solutions of this equation for various applied conditions and for multiple dimensional studies. But due to the complexity of the proposed solutions some simplifications are generally used, such as considering the sample having an infinite shape.
For convective conditions, the solution for an infinite plate is written:
𝜕𝜕∗= ∑ 2 𝑠𝑠𝑠𝑠𝑛𝑛2λ𝑛𝑛
λ𝑛𝑛(λ𝑛𝑛+𝑠𝑠𝑠𝑠𝑛𝑛 λ𝑛𝑛𝑐𝑐𝑐𝑐𝑠𝑠 λ𝑛𝑛) ∞
𝑛𝑛=1 𝑒𝑒𝑒𝑒𝑒𝑒�−λ𝑛𝑛2𝐹𝐹𝑐𝑐� (2)
Where λ is given by:
(3) “Fo” is Fourier dimensional number
For an infinite cylinder and convective drying conditions, the solution of the diffusion equation is written:
𝜕𝜕∗= ∑ 4 𝐽𝐽12(λ𝑛𝑛)
𝐽𝐽02(λ𝑛𝑛)+𝐽𝐽12(λ𝑛𝑛)
∞
With:
𝐵𝐵𝑠𝑠 = λ𝐽𝐽1(λ)
𝐽𝐽0(λ) (5)
In our case, it is clear that the value of the diameter of the sample is almost equal to its height. So, we cannot consider the sample as an infinite cylinder or as an infinite plate. One of the proposed approaches to study finite dimensions is the method called super-imposition technique[24-27]. It considers the solution for a finite cylinder as the product of the infinite slab and the infinite cylinder.
Crank[23] has proposed another solution of the diffusion equation, this solution is reported and use by other authors[28-29]. The solution can be written:
𝜕𝜕∗= 𝜕𝜕 𝜕𝜕0= 8𝑟𝑟2 𝑙𝑙2 ∑ ∑ 1 λ𝑠𝑠2β𝑗𝑗2 𝑛𝑛 𝑗𝑗 =1 𝑛𝑛 𝑠𝑠=1 𝑒𝑒𝑒𝑒𝑒𝑒�−�λ𝑠𝑠2+ β𝑠𝑠2�� 𝐷𝐷𝑒𝑒𝑒𝑒𝑒𝑒 𝑟𝑟2 𝜕𝜕 (6) With: 𝛽𝛽𝑗𝑗 =(2𝐽𝐽 −1)2𝑙𝑙 𝜋𝜋𝑟𝑟 (7)
λi is the root of the Bessel function.
For long drying times (X*<0.6) only the first term of the series solution is taken into account and it gives:
𝜕𝜕∗= 32
λ12𝜋𝜋2𝑒𝑒𝑒𝑒𝑒𝑒�−�λ𝑠𝑠2+ β𝑠𝑠2��𝐷𝐷𝑒𝑒𝑒𝑒𝑒𝑒𝑟𝑟2 𝜕𝜕 (8)
The plot of the experimental results in term on -ln(X*) versus drying time gives a straight line with a slope:
𝑠𝑠𝑙𝑙𝑐𝑐𝑒𝑒𝑒𝑒 = �5.7831 + 𝛽𝛽12� 𝑫𝑫𝒆𝒆𝒆𝒆𝒆𝒆
𝒓𝒓𝟐𝟐 (9)
4. Results and Discussion
The experiments are realized under temperatures of 60℃, 90℃ and 130℃. Increased velocities of 2 m.s-1, 3 m s-1 and 5
m.s-1 are also used. The relative humidity of the air is less than 1.7%.
Drying process is well represented by the drying curve that gives information about the variation of the moisture content inside the product with time. Figure 2 shows the general trend of the curves with the influence of the operating conditions.
Figure 2. Drying curves during drying of mortar cement
X* is the dimensionless moisture. It is equal to the ratio of the actual moisture content to the initial moisture content.
As shown in the figure, the quantity of water existing in the product decreases with time. On the other hand, increasing energy (represented by air temperature increase) is considerably reducing drying time.
Figure 3. Krisher’s curve[21]
0 0.2 0.4 0.6 0.8 1 1.2 0 20 40 60 X* Time (hours) 60°C 90°C Time Increase Humidity decrease
Generally, convective drying process passes by several phases, commonly divided into 3 phases. The first phase; is a short period called adaptation period. During this phase, the product adapts its comportment to the new applied conditions. The second period is also called constant drying rate period, provided no shrinkage occurs. During this period the supplied heat serves essentially to the evaporation of the product water. The operation is done at constant surface product temperature. The last phase is the falling drying rate period. In this last period, the energy serves both to evaporate the product water and to increase its temperature. The best representation allowing illustrating the different drying phases is the so-called Krisher’s curve, i.e. the drying rate, or flux, versus the product water content. Figure 3 gives Krisher’s representation in the case of wastewater sludge drying[21].
Determining the influent parameters that affect drying plays an important role to have an optimum procedure. According to previous studies done for food stuffs[31-32], wastewater sludge[30] and some building materials[19]; temperature of the air and its velocity are found as the most influent parameters. Figures 4 and 5 show the influence of respectively the temperature of the heated air and its velocity on the drying kinetics for mortar samples. The experimental results of figure 4 are obtained at a velocity of 2 m.s-1. Those of figure 5 are obtained at a temperature of 130℃.
Figure 4. Influence of the air temperature on the total evaporated water
Figure 5. Influence of the air velocity on the total evaporated water
The two figures show the existence of the adaptation phase, the short constant drying rate period and a dominant falling drying rate phase. It is clear that increasing the temperature or the velocity of the air increases transfer and in
consequence the increase of the quantity of the evaporated water. For the same drying time, the quantities have been doubled values when the temperature increased from 90℃ to 130℃ and also when the velocity was increased from 3 m. s-1 to 5 m.s-1. It is important to note that surface change was followed using microtomography and it was found that it remained constant; i.e. no shrinkage was observed.
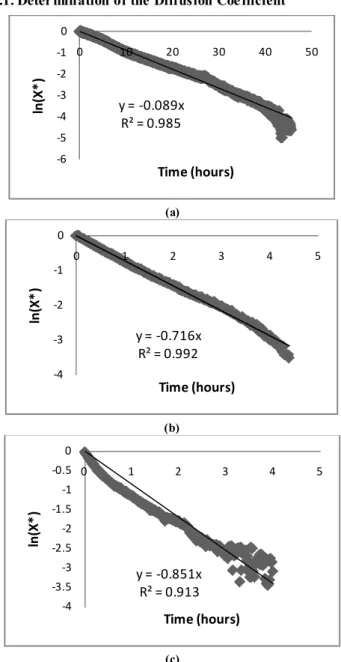
4.1. Determination of the Diffusion Coefficient
(a)
(b)
(c)
Figure 6. Variation of the moisture with time for different temperatures.
(a):60°C, (b): 90°C, (c)=130 °C
The plots of the experimental results as ln(X*) vs. time, for different temperatures, are shown in Figure 6.
The results of the comparison of the experimental results and equation 9 give the values of the diffusion coefficient for different temperatures summarized in table 2:
Table 2. Influence of the temperature on diffusion coefficient
Temperature (°C) 60 90 130 Deff (m2.s-1)*1010 1.71 13.69 16.27 y = -0.089x R² = 0.985 -6 -5 -4 -3 -2 -1 0 0 10 20 30 40 50 ln (X *) Time (hours) y = -0.716x R² = 0.992 -4 -3 -2 -1 0 0 1 2 3 4 5 ln (X *) Time (hours) y = -0.851x R² = 0.913 -4 -3.5 -3 -2.5 -2 -1.5 -1 -0.5 0 0 1 2 3 4 5 ln (X *) Time (hours) W[Kg/Kg] W[Kg/Kg]
The relation is written under the following form:
𝐷𝐷𝑒𝑒𝑒𝑒𝑒𝑒 = 𝐷𝐷0 𝑒𝑒𝑒𝑒𝑒𝑒 �−𝑅𝑅𝑅𝑅𝐸𝐸� (10)
R is the perfect gas constant, it is equal to 8.314 J/ K..mol). The plot of ln(Deff) vs. the inverse of the temperature is
illustrated in figure 7.
Figure 7. Determination of the coefficient diffusion parameters
An activation energy of about 35.39 kJ.mol-1 is then
obtained and the value of the constant D0 is ln(D0) = -9.3546
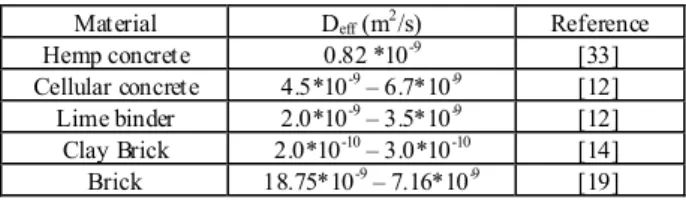
Table 3 presents the results of the diffusion coefficient calculus presented by other works and for several building materials.
Table 3. Values of diffusion coefficient for different materials
Material Deff (m2/s) Reference
Hemp concrete 0.82 *10-9 [33]
Cellular concrete 4.5*10-9 – 6.7*10-9 [12]
Lime binder 2.0*10-9 – 3.5*10-9 [12]
Clay Brick 2.0*10-10 – 3.0*10-10 [14]
Brick 18.75*10-9 – 7.16*10-9 [19]
The studied product shows a diffusion coefficient higher than hemp concrete and clay brick and lower than cellular concrete, lime binder and brick.
5. Conclusions
The experiments permit to have more information about drying of cement mortar with study of the influence of the operating conditions which are commonly, the temperature and the velocity of the air. During application of drying to cement mortar three phases can be identifiable by using Krisher’s curve. The use of the microtomography shows that no changes are happening to the samples and a constant surface is registered in all studied cases. It is evident to find that increasing temperature or velocity of the air conducts to the increase of the evaporated quantity of water. The maximum value reached at 60℃ is 0.00015 kg.m-2.s-1, this value increases to 0.00030 kg.m-2.s-1 at 130℃. On the other side, the increase of the air velocity from 1 m.s-1 to 5 m.s-1 causes an increase of the maximum value from 0.00030 to 0.00070 kg.m-2.s-1. The modelling part of this work allows calculation of the diffusion coefficient. The value of this coefficient increases with temperature from 1.71 ×10⁻¹⁰
m2.s-1 at 60℃ to 16.27 ×10⁻¹⁰ m2.s-1 at 130℃. The constant coefficient and the activation energy are then easily calculated. The activation energy is equal to 35.39 kJ.mol-1.
ACKNOWLEDGEMENTS
Lyes Bennamoun is grateful to the F.R.S-FNRS, the Fund for Scientific Research (Belgium) for his short term Foreign Postdoctoral Fellow position.
Nomenclature
Bi Biot dimensionless number D diffusion coefficient (m2/s)
E activation energy (J/mol) Fo Fourier dimensionless number R perfect gas constant (=8.314 J/K..mol). r radius (m)
Q or F evaporation flux (kg/m2s)
T temperature (°C or K) t time (hours)
X or W moisture content (kg/kg dry basis) X0 initial moisture content (kg/kg dry basis)
X* dimensionless moisture content y dimension (m)
REFERENCES
[1] P. Gérard, “Impact des transferts de gaz sur le comportement poro-mécanique des matériaux argileux”, PhD Thesis, University of Liege, Belgium, 2011.
[2] T. Rougelot, “Etude expérimentale multi-échelle des couplages hydriques, mécaniques et chimiques dans des matériaux cimentaires ”, PhD Thesis, University of Lille, France, 2008.
[3] S.D. Beyea, B.J. Balcom, T.W. Bremner, P.J. Prado, A.R. Cross, R.L. Armstrong, P.E. Grattan-Bellew, “The influence of shrinkage-cracking on the drying behaviour of White Portland cement using single-point imagining (SPI)”, Solie State Nuclear Magnetic Resonance, vol. 13, pp. 93-100, 1998. [4] C.M. Tam, V.W.Y. Tam, K.M. Tg, “Assessing drying
shrinkage and water permeability of reactive powder concrete produced in Honk Kong”, Construction and Building Materials, vol. 26, pp. 79-89, 2012.
[5] A.L. Pasanen, J.P. Kasanen, S. Rautiala, M. Ikäheimo, J. Rantamäki, H. Kääriäinen, P. Kalliokoski, “Fungal growth and survival in building materials under fluctuating moisture and temperature conditions”, International Biodeterioration and biodegradation, vol. 46, pp. 117-127, 2000.
[6] M. Karoglou, A. Moropoulou, M.K. Krokida, Z.B. Maroulis, “A powerful simulation for moisture transfer in buildings”, Building and Environment, vol. 42, pp. 902-912, 2007. [7] A. Moropoulou, M. Karoglou, A. Giakoumaki, M.K. Krokida,
Z.B. Maroulis, G.D. Saravacos, “Drying kinetics of some
y = -4256.x - 9.354 R² = 0.784 -23 -22.5 -22 -21.5 -21 -20.5 -20 -19.5 0.002 0.0022 0.0024 0.0026 0.0028 0.003 0.0032 ln (De ff ) 1/T (K-1)
building materials”, Brazilian Journal of Chemical Engineering, vol. 22, pp. 203-208, 2005.
[8] J.H. Yoo, H.S. Lee, M.A. Ismail, “An analytical study on the water penetration and diffusion into concrete under water pressure”, Construction and Building Materials, vol. 25, pp. 99-108, 2011.
[9] S. Jacobsen, L.I. Aarseth, “Effect of wind on drying from wet porous building materials surfaces – A simple model in steady state”, Materials and Structures, vol. 32, pp. 38-44, 1999. [10] D.C. Park, J.C. Ahn, S.G. Oh, H.C. Song, T. Noguchi,
“Drying effect of polymer-modified cement for patch - repaired mortar on constraint stress”, Construction and Building Materials, vol. 23, pp. 434-447, 2009.
[11] Q. Deng, X. Yang, j. Zhang, “Study of a new correlation between diffusion coefficient and temperature in porous building materials”, Atmospheric Environment, vol. 43, pp. 2080-2083, 2009.
[12] A. Zaknoune, P. Glouannec, P. Salagnac, “Estimation of moisture transport coefficient in porous materials using experimental drying kinetics”, Heat Mass Transfer, vol. 48, pp. 205-215, 2012.
[13] G. Chéné, G. Bastian, C. Brunjail, J. P. Laurent, “ Vieillissement accéléré de blocs de tuffeau en laboratoire sous l’effet de cycles d’imbibition-séchage ”, Materials and structures, vol. 32, pp. 525-532, 1999.
[14] I.R. Dalgaard, L.M. Ottosen, K.K. Hansen, “Diffusion and electromigration in clay bricks influenced by differences in the pore system resulting from firing”, Construction and Building Materials, vol. 27, pp. 390-397, 2012.
[15] L.Y. Li, J. Xia, S.S. Lin, “A multi-phase model for predicting the effective diffusion coefficient of chlorides in concrete”, Construction and Building Materials, vol. 26, pp. 295-301, 2012.
[16] T.S. Nguyen, S. Lorente, M. Carcasses, “Effect of the environment temperature on the chloride diffusion through CEM-I and CEM-V: An experimental study”, Construction and Building Materials, vol. 23, pp. 795-803, 2009.
[17] J. Drchalová, R. Černý, “A simple gravimetric method for determining the moisture diffusivity of building materials”, Construction and Building Materials, vol. 17, pp. 223-228, 2003.
[18] D.A. Lockington, J.Y. Parlange, D.A. Barry, C.A. Leech, “Drying of porous materials: hydraulic diffusivity and front propagation, Materials and structures, vol. 36, pp. 448-452, 2003.
[19] L. Bennamoun, A. Belhamri, A. Ali Mohamed, “Application of a diffusion model to predict drying kinetics changes under variable conditions: experimental and simulation study”, Fluid Dynamics and Materials Processing, vol. 5, pp. 177-191, 2009.
[20] Norme Européenne EN 196-1: 2005 F.,”Méthode d’essais des ciments-partie 1: détermination des résistances mécaniques ”, Comité Européen de Normalisation CEN.
[21] A. Léonard, “Etude du séchage convectif de boues de station d’épuration – Suivi de la texture par micotomographie à rayons X”, PhD Thesis, University of Liege, Belgium, 2003. [22] A. Léonard, S. Blacher, P. marchot, M. Crine, “Use of X-ray
microtomography to follow the convective heat drying of wastewater sludges”, Drying Technology, vol.20, pp. 1053-1069, 2002.
[23] J. Crank, “The mathematics of diffusion”, Oxford, U.K., 1975.
[24] N. Rahman, S. Kumar, “Evaluation of moisture diffusion coefficient of cylindrical bodies considering shrinkage during natural convection drying”, International Journal of Food Engineering, vol.7, article 4, 2011.
[25] N. Rahman, S. Kumar, “Thermal analysis of natural convective air drying of shrinking bodies”, International Journal of Energy Research, vol. 31, pp. 204-217, 2007. [26] M. Turhan, F. Erdoğdu, “Error associated with assuming a
finite regular geometry as an infinite one for modeling of transient heat and mass transfer processes”, Journal of Food Engineering, vol.59, pp. 291-296, 2003.
[27] C. Rosselló, S. Simal, N. San Juan, A. Mulet, “Nonisotropic mass transfer model for green bean drying », Journal of Agricultural Food Chemistry, vol. 45, pp. 337-342, 1997. [28] T. Usub, C. Lertsatitthankorn, N. Poomsa-ad, L. Wiset, S.
Siriamornpun, S. Soponronnarit, “Thin layer solar drying characteristics of silkworm pupae”, Food and Bioproducts Processing, vol. 88, pp. 149–160, 2010.
[29] W.A.M. McMinn, T.R.A. Magee, “Principals, methods and applications of the convective drying of foodstuffs”, Food and Bioproducts Processing, vol. 77, pp175-193. , 1999.
[30] A. Léonard, S. Blacher, P. Marchot, J.P. Pirard, M. Crine, “Convective drying of wastewater sludges: Influence of air temperature, superficial velocity, and humidity on kinetics”, Drying Technology, vol. 23, pp. 1667-1679, 2005.
[31] L. Bennamoun, A. Belhamri, “Numerical simulation of drying under variable external conditions: Application to solar drying of seedless grapes”, Journal of Food Engineering, vol. 76, pp. 179-187, 2006.
[32] L. Bennamoun, A. Belhamri, “Design and simulation of a solar dryer for agriculture products”, Journal of Food Engineering, vol. 59, pp. 259-266, 2003.
[33] T. Colinart, P. Glouannec, P. Chauvelon, “Influence of the setting process and the formulation on the drying of hemp concrete”, Construction and Building materials, vol. 30, pp. 272-280, 2012.
![Figure 1. Detailed scheme of the convective dryer[22]](https://thumb-eu.123doks.com/thumbv2/123doknet/6646025.181582/2.893.144.773.112.554/figure-detailed-scheme-convective-dryer.webp)
![Figure 3. Krisher’s curve[21]](https://thumb-eu.123doks.com/thumbv2/123doknet/6646025.181582/3.893.156.756.681.1074/figure-krisher-s-curve.webp)