HAL Id: hal-01374287
https://hal.archives-ouvertes.fr/hal-01374287
Submitted on 30 Sep 2016
HAL is a multi-disciplinary open access
archive for the deposit and dissemination of
sci-entific research documents, whether they are
pub-lished or not. The documents may come from
teaching and research institutions in France or
abroad, or from public or private research centers.
L’archive ouverte pluridisciplinaire HAL, est
destinée au dépôt et à la diffusion de documents
scientifiques de niveau recherche, publiés ou non,
émanant des établissements d’enseignement et de
recherche français ou étrangers, des laboratoires
publics ou privés.
A poly-epoxy surface explored by Hartree-Fock ∆SCF
simulations of C1s XPS spectra
Andreas Gavrielides, Thomas Duguet, Jérôme Esvan, Corinne
Lacaze-Dufaure, Paul S. Bagus
To cite this version:
Andreas Gavrielides, Thomas Duguet, Jérôme Esvan, Corinne Lacaze-Dufaure, Paul S. Bagus. A
poly-epoxy surface explored by Hartree-Fock ∆SCF simulations of C1s XPS spectra. Journal of
Chemical Physics, American Institute of Physics, 2016, vol. 145 (n° 7), pp. 074703-1-074703-7.
�10.1063/1.4960762�. �hal-01374287�
O
pen
A
rchive
T
OULOUSE
A
rchive
O
uverte (
OATAO
)
OATAO is an open access repository that collects the work of Toulouse researchers and
makes it freely available over the web where possible.
This is an author-deposited version published in :
http://oatao.univ-toulouse.fr/
Eprints ID : 16034
To link to this article : DOI : 10.1063/1.4960762
URL :
http://dx.doi.org/10.1063/1.4960762
To cite this version :
Gavrielides, Andreas and Duguet, Thomas and
Esvan, Jérôme and Lacaze-Dufaure, Corinne and Bagus, Paul S. A
poly-epoxy surface explored by Hartree-Fock ∆SCF simulations of
C1s XPS spectra. (2016) Journal of Chemical Physics, vol. 145 (n°
7). pp. 074703-1-074703-7. ISSN 0021-9606
Any correspondence concerning this service should be sent to the repository
administrator:
staff-oatao@listes-diff.inp-toulouse.fr
A poly-epoxy surface explored by Hartree-Fock ∆SCF simulations
of C1s XPS spectra
A. Gavrielides,1T. Duguet,1,a)J. Esvan,1C. Lacaze-Dufaure,1and P. S. Bagus2,a)
1CIRIMAT, Université de Toulouse, CNRS–INPT–UPS, 4 Allée Emile Monso, BP 44362,
31030 Toulouse, France
2Department of Chemistry, Center for Advanced Scientific Computing and Modeling, University of North Texas,
1155 Union Circle, #305070, Denton, Texas 76203, USA
Whereas poly-epoxy polymers represent a class of materials with a wide range of applications, the structural disorder makes them difficult to model. In the present work, we use good experimental model samples in the sense that they are pure, fully polymerized, flat and smooth, defect-free, and suitable for ultrahigh vacuum x-ray photoelectron spectroscopy, XPS, experiments. In parallel, we perform Hartree-Fock, HF, calculations of the binding energies, BEs, of the C1s electrons in a model molecule composed of the two constituents of the poly-epoxy sample. These C1s BEs were determined using the HF ∆SCF method, which is known to yield accurate values, especially for the shifts of the BEs, ∆BEs. We demonstrate the benefits of combining rigorous theory with careful XPS measurements in order to obtain correct assignments of the C1s XPS spectra of the polymer sample. Both the relative binding energies—by the ∆SCF method—and relative intensities—in the sudden approximation, SA, are calculated. It results in an excellent match with the experimental spectra. We are able to identify 9 different chemical environments under the C1s peak, where an exclusively exper-imental work would have found only 3 contributions. In addition, we observe that some contributions are localized at discrete binding energies, whereas others allow a much wider range because of the variation of their second neighbor bound polarization. Therefore, HF-∆SCF simulations significantly increase the spectral resolution of XPS and thus offer a new avenue for the exploration of the surface of polymers. [http://dx.doi.org/10.1063/1.4960762]
I. INTRODUCTION
The reactivity of poly-epoxy surfaces is of major concern regarding functionalization pretreatments or treatments. The lack of simulations and models is an obstacle for efficient technology developments which, nowadays, rely exclusively on empirical studies. A good illustration can be found in the field of metallization of poly-epoxies and adhesion of metallic films in the sample list in Ref.1. Therefore, the development of an accurate model for the surface of poly-epoxies can help in the design of tailored surfaces with a good control of the chemical reactivity. While the family of poly-epoxy materials is strategic in many industrial applications, there have, until now, been very few attempts to develop accurate and reliable models on their surfaces or interfaces with other materials.2,3
X-ray photoelectron spectroscopy, XPS, is an excellent experimental technique for assessing the composition and also the properties of the polymer surface, especially when the shifts of core-level binding energies, ∆BEs, can be interpreted in terms of the electronic structure of the polymer.4 In
particular, we show in this paper that the information gained from XPS studies could be a powerful tool to assess the reactivity of polymer surfaces. The XPS 1s binding energies, BEs, of carbon, nitrogen, and oxygen atoms are good probes
a)Authors to whom correspondence should be addressed. Electronic
addresses: thomas.duguet@ensiacet.fr and Paul.Bagus@unt.edu
of the structure of the polymer because they are sensitive to the environment of the core-ionized atom. This is particularly important since it is often possible to have an unambiguous resolution, or decomposition, of the XPS 1s spectra into contributions from one or from a few atoms in different functional units. However, in order to draw correct inferences about the polymer structure, it is necessary to have definitive assignments of the various BEs to their origins in the different inequivalent atoms in the polymer. The simulation of the XPS spectra based on rigorous and accurate ab initio Hartree-Fock, HF, calculations provides theoretical support for making such definitive assignments. Thus, it represents an important step in our goal of better understanding the character of poly-epoxy surfaces.
To our knowledge, there is no model for polymer surfaces but rather models derived from calculations on model molecules. For instance, polymers5–9 and related organic
materials10have all been modeled from the properties of one
or a few constituent molecules. The numerous studies using this method prove statistically that such an approximation is globally correct. Some authors have tried to go a step beyond and dealt with the calculations of the adsorption of atoms or molecular species on these model molecules, e.g., in the study of the adsorption of Al on polyethylene terephthalate (PET).11
The interpretation of XPS spectra of a wide range of materials based on rigorous calculations of the electronic wavefunctions of the materials has been studied extensively;
see, for example, the recent review of Bagus et al.4 In the
present paper, we will use the HF, ∆SCF method where the BEs are taken as the difference in the HF self-consistent field, SCF, energies of the ground state (GS) and the core-ionized state.4
The ∆SCF method includes the initial state contributions due to the charge distribution in the ground state and the final state contributions due to the electronic relaxation in response to the core-hole. It is necessary to include the final state effects since the relaxation may be different for the ionization of different inequivalent atoms.12 The accuracy of the HF
∆SCF method is adequate for our purposes. This adequacy has been documented in the review of Ref. 4 and in three recent papers,12–14where the XPS BEs have been studied for
a large number of molecules containing C, N, and O atoms. In these latter works,12–14 HF and density functional theory,
DFT, BEs, and BE shifts, ∆BEs, have been compared to experimental data. For the HF ∆SCF results, the C1s, N1s, and O1s BEs of these molecules have an absolute accuracy of ∼1 eV but, most important for our purposes, the error of the ∆BEs, between an atom in different molecules or in different environments is much smaller, ∼0.2 eV.12–14In this context, it
is worth noting that, especially for insulating surfaces, it may be difficult to determine an absolute value of the BEs with respect to vacuum zero of energy,4,15but it is straightforward
to obtain accurate shifts of the BEs for different atoms in the same material. For this reason, the focus of our discussion will be concerned with the ∆BE. Furthermore, our concern is for the main 1s peaks and we do not focus on the shake satellites that steal intensity from these main peaks.16–18However, it is
necessary to consider the losses to shake peaks in determining the main peak intensities, since these losses may not be the same for all inequivalent atoms; in other words, the relative intensities of the 1s BEs of inequivalent atoms are not exactly given by the stoichiometry of the compound.19An advantage
of using HF wavefunctions is that they provide a natural way to determine the relative intensities, Irel, of the main 1s peaks.
These Irelare discussed in more detail later in the paper.
It is appropriate to note that there have been recent work where the interpretations of the N(1s)20and the C(1s)21XPS
spectra of organic molecules that involve only the use of the electronic structure of the initial configuration as given by DFT20,21and by Moller-Plesset perturbation theory.21On the
other hand, the separate calculation of wavefunctions for both the initial and final, core-hole, configurations is required with the ∆SCF method that we have used. This one configuration approach is described as being in the spirit of Koopmans’ theorem20,21 and has the computational advantage that only
a single electronic structure DFT calculation is needed. However, this approach neglects final state relaxation.4 For
the BEs, the only important concern is for the differential relaxation energies of the XPS BEs of interest since the main concern in the present and in the prior work20,21 is for BE
shifts, ∆BE. For the N(1s) BEs of 15 molecules,12,14 the
relaxation energies differed by 1.7 eV, for HF, and 1.8 eV, for DFT, between the largest and smallest relaxation energies. For the molecules used in our models, this differential relaxation was somewhat smaller, 1.1 eV, but still large enough to be of concern for the analysis of the spectra. It is possible, as pointed out in Refs.20and21, to make adjustments to partially account
for these differential relaxation effects, but the adjustment parameters limit the ab initio character of the theoretical analysis. Another factor that is missing in Koopmans’ theorem approach is differential losses to shake satellites for the different C(1s) ionizations in the model dimer. Of course, these losses to shake satellites are at the expense of intensity that appears in the main peak.17,18For our model dimer, these
losses range between a smallest loss of 25% to a largest loss of 35%. Neglecting these differential losses, which we take fully into account, introduces an uncertainty of ∼15% in the intensity assignments and in the theoretical modelling of the XPS spectra. An important computational reason for avoiding calculation for the final states is the difficulty of convergence to electronic structure of the hole-state configurations in a complex molecule. However, as we will discuss in Sec.II, we have developed a methodology that avoids the convergence problems and makes the calculation of the final, hole-state, electronic structure routine and automatic. Given this development in methodology, we feel that it is worth carrying out ∆SCF calculations to avoid the uncertainties of the Koopmans’ theorem approach that we have described above.
For our XPS studies of the origins of the C(1s) ∆BEs, we have chosen to study a model molecule as representative of the epoxy used in the XPS experiments. We choose a poly-epoxy polymer that is synthesized in such conditions that its surface is smooth, its chemical composition is homogeneous and that it is fully polymerized. Details about synthesis and surface characterizations can be found elsewhere.3
Whereas it is experimentally obtained from the stoichio-metric mixture of 2 DGEBA + 1 ethylene diamine (EDA), the model molecule consists in a dimer of 1 diglycidylether of bisphenol A (DGEBA) + 1 EDA, as shown in Fig. 1. Hence, the model contains all the possible bonds in the solid surface while minimizing the number of atoms (61 including the H atoms). ∆SCF calculations are performed at the HF level and, hence, include fully the final state relaxation of the electronic wavefunction in response to the core-hole. There have been previous calculations of the core-level spectra of large molecules; see, for example, Refs. 22–24. However, the present case is somewhat special in that the molecular model that we use has no symmetry and, in consequence, we have had to determine the wavefunctions for 29 distinct and different C1s core-hole states as well as the wavefunction for the ground state.
FIG. 1. Model dimer made of 1 diglycidylether of bisphenol A (DGEBA) and 1 ethylene diamine (EDA) molecules, through the reaction of one NH2
proton of EDA that opens one epoxy ring of DGEBA. H atoms are not shown for clarity.
The paper is organized as follows. Experiments and calculation details are presented. Then, we present ∆SCF results from HF calculations for both binding energy shifts and intensities derived from the sudden approximation17,18
and show the advantages of such a careful analysis in contrast with an “empirical” decomposition of the XPS spectra. Finally, results are discussed and emphasis is placed on the need to extend our present strategy.
II. COMPUTATION AND THEORETICAL DETAILS
We use the model molecule shown in Fig. 1, which geometry was optimized at the B88PW91/TZVP level of theory using the DeMon2k software.25
For this large system, we made these initial HF calculations with a modest basis set that is slightly more extended that double zeta, DZ+; see, for example, Ref. 26. The basis set is made with contracted Cartesian Gaussian functions. For the C, N, and O atoms, the basis set was based on the 9s and 5p basis set of van Djinevelt27 contracted to
4s and 3p functions, (9,5/4,3). For the H atoms, the basis set was (4,1/2,1) where the s basis function exponents were taken from van Djineveldt27 supplemented by a p function with
exponent 1.0. Calculations of Hartree-Fock wavefunctions for the ground state of the molecule and for configurations where the 1s shell of each of the C atoms was singly occupied. Convergence to the hole-states where the singly occupied orbital had the proper localized 1s character was assured by selecting the occupied orbitals at each SCF iteration according to a criterion of maximum overlap with the starting guess for that iteration.4However with an overlap criterion for selecting
occupied orbitals, there is a danger of converging to an excited state, especially if the changes from the initial trial guess are large. When this occurs, it is necessary to change the order of the occupied and virtual orbitals, perhaps in several steps, until one converges to the lowest energy state for the core-hole configuration. This is an arduous manual procedure. We have implemented a procedure to avoid this manual effort and to insure automatic convergence to the desired state.28 In the
spirit of Jolly’s equivalent core approximation,29,30we replace
the C atom to be core ionized with a N atom and determine the HF ground state orbitals for the closed shell positive ions for this equivalent core molecule where it is not necessary to use the overlap criterion to select the occupied orbitals. For the calculations on this equivalent core molecule, we use the same basis set as for the real molecule of interest so that the orbitals for the fictitious molecule can be used as the initial trial functions for the calculations on the core-hole state of the real molecule. For these latter calculations, it is only necessary to specify that the 1s orbital centered on the equivalent core atom is singly occupied. Since the equivalent core orbitals are a good approximation to the orbitals of the lowest core-hole state,4there is no difficulty in converging to the desired state
without manual intervention except for the preparation of the input files.
The XPS intensities for these main peaks were determined on the basis of the Sudden Approximation, SA.4,17In the SA,
the electronic wavefunction at the instant of photoionization, time t = 0, is taken as the wavefunction where an electron is
removed from an occupied C(1s) orbital but all orbitals are fixed, frozen, as they were variationally determined for the ground state. In other words, no relaxation is allowed at the instant of photoionization. However, this wavefunction is not an eigenfunction of the Hamiltonian and the intensity that is obtained for one of the fully relaxed and screened core-hole wavefunctions is determined, within the SA, by taking the overlap of the t = 0 wavefunctions with the various ∆SCF wavefunctions where the removed C(1s) electrons have been fully screened.4 Since the orbitals of the set optimized for
the hole-states are not orthogonal to the orbitals of the set optimized for the ground state, GS, it is necessary to use a sum over overlap integrals times a minor of the overlap determinant between the GS and the core-hole orbitals.31 A
cofactor method was used to determine these many electron overlap integrals.32 All calculations of the XPS hole-states
and SA intensities were performed using the CLIPS program system.33
III. EXPERIMENTAL DETAILS
Poly-epoxy samples are synthesized in an Ar glovebox from the stoichiometric mixture of 2 moles of DGEBA and 1 mole of EDA. After 7 min of stirring, a thin droplet is deposited on a 10 × 10 mm2Si coupon. The first step of polymerization
is performed at ambient temperature, for 48 h. Post-curing is also performed in the glovebox at 140◦C for 2 h. With this
protocol, IR spectroscopy analysis shows a polymerization rate of more than 93 ± 3%, consistently. Samples are then stored in a load-lock transfer chamber at 5 × 10⁻⁸ mbar in
order to outgas overnight at room temperature. Then, they are transferred directly to the XPS chamber for analysis of the as-synthesized poly-epoxy surface, including a short exposure to air.
X-ray photoelectron spectroscopy is performed with a K-alpha apparatus (Thermo Scientific) equipped with a monochromatic Al Kα source (hν = 1486.6 eV), at a pass energy of 30 eV which results in a FWHM of 0.7 eV on the Ag3d5/2 peak of a silver standard. The FWHM of the
Ag peak is commonly taken as providing an estimate of the experimental resolution of the XPS spectra. There is also a Franck-Condon, FC, broadening related to changes in the equilibrium geometry for the core-hole state that leads to an additional broadening due to excitations to vibrationally excited states for the core-hole final state; see Ref. 34. The vibrational spacing of C(1s) hole states of CO has been measured to be 0.3 eV,35 and it is reasonable to take
the Gaussian broadening for the C(1s) hole state as being the experimental resolution plus a conservative estimate of the FC vibrational broadening of 0.2 eV for a total of 0.9 eV.
IV. RESULTS
The left frame of Table I shows results obtained from ∆SCF calculations. C1s orbitals can be identified from the atom numbering of the first column derived from the model dimer shown in Fig. 1. Chemical shifts (∆BEs)
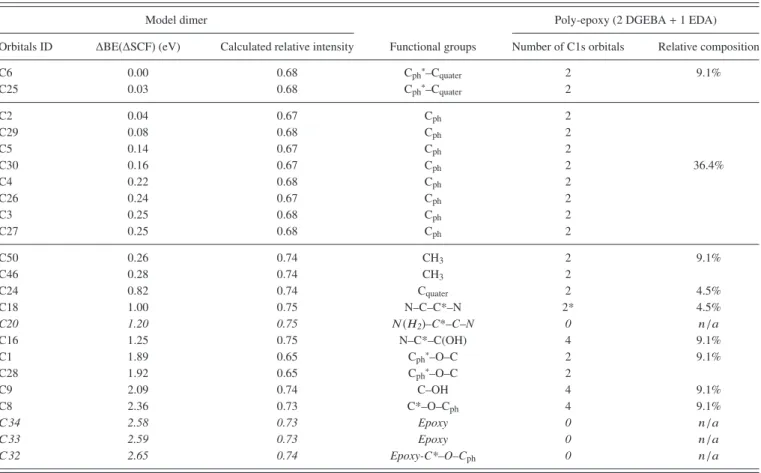
TABLE I. Left: Calculated chemical shift (∆BE) and intensities for each orbitals of the dimer molecule shown in Fig.1. Center: Functional group identification (the orbital of interest belong to atoms marked with an asterisk). Right: The number and relative concentration of C1s orbitals in the solid poly-epoxy from the stoichiometric ratio 2DGEBA:1EDA. Italic rows correspond to the orbitals which are present in the model dimer, but no longer present in the fully polymerized solid.
Model dimer Poly-epoxy (2 DGEBA + 1 EDA)
Orbitals ID ∆BE(∆SCF) (eV) Calculated relative intensity Functional groups Number of C1s orbitals Relative composition
C6 0.00 0.68 Cph∗–Cquater 2 9.1% C25 0.03 0.68 Cph∗–Cquater 2 C2 0.04 0.67 Cph 2 C29 0.08 0.68 Cph 2 C5 0.14 0.67 Cph 2 C30 0.16 0.67 Cph 2 36.4% C4 0.22 0.68 Cph 2 C26 0.24 0.67 Cph 2 C3 0.25 0.68 Cph 2 C27 0.25 0.68 Cph 2 C50 0.26 0.74 CH3 2 9.1% C46 0.28 0.74 CH3 2 C24 0.82 0.74 Cquater 2 4.5% C18 1.00 0.75 N–C–C*–N 2* 4.5% C20 1.20 0.75 N(H2)–C*–C–N 0 n/a C16 1.25 0.75 N–C*–C(OH) 4 9.1% C1 1.89 0.65 Cph∗–O–C 2 9.1% C28 1.92 0.65 Cph∗–O–C 2 C9 2.09 0.74 C–OH 4 9.1% C8 2.36 0.73 C*–O–Cph 4 9.1% C34 2.58 0.73 Epoxy 0 n/a C33 2.59 0.73 Epoxy 0 n/a C32 2.65 0.74 Epoxy-C*–O–Cph 0 n/a
are all obtained from the orbital with the lowest energy (C6), fixed at 0 eV. The third column shows the theoretical intensities calculated in the framework of the SA. The relative SA intensities range between 0.65 and 0.75 meaning that depending on the C atom, 25%–35% of the XPS intensity is lost from the main peak to shake satellites. These data are used to build the theoretical C1s spectrum by computing a Voigt convolution for each individual contribution. The Voigt convolution consists in the convolution of a Gaussian and a Lorentzian function,36 with FWHM of 0.9 eV and
0.1 eV,37 respectively. The spectrum envelope is the sum of
all contributions.
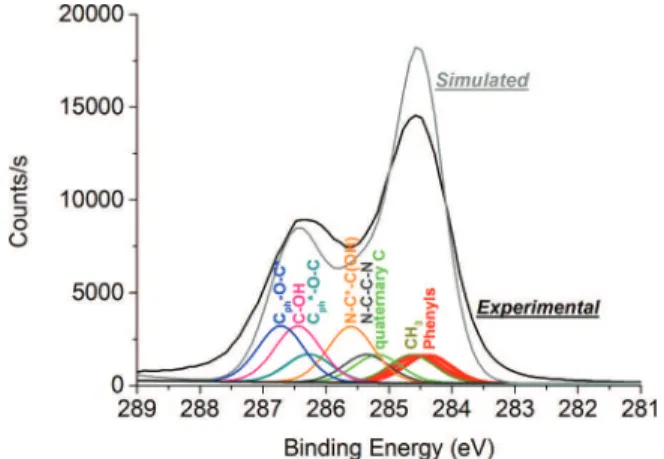
Fig.2(a)shows an experimental result with an empirical peak decomposition based on literature data, experience, and knowledge about the polymer composition. After the fitting procedure, a fair assessment of the poly-epoxy surface is possible with 3 contributions plus the shake-up satellite, only. These 3 contributions correspond to C–C/C–H, C–N, and oxygenated bonds. Whereas it is correct in terms of composition (in conjunction with O1s and N1s decomposition, not shown) and chemical shifts, the accuracy is limited for the description of the surface chemistry, i.e., peaks are broad (e.g., 1.6 eV FWHM for the C–O–C, C–OH peak) and hide finer details. ∆BE(∆SCF) and SA results are presented in Fig. 2(b) with the comparison of the experimental (blue dotted line) and simulated (black full line) spectra. It helps distinguishing 9 contributions instead of 3 as the “empirical
case”; hence it provides more information than is obtained from the imperfect resolution of the XPS experimental data.
In Fig.2(b), a Tougaard background38is subtracted from
the experimental spectrum and the simulated spectrum is positioned by applying a rigid shift until the maximum intensity matches the maximum experimental intensity (normalized to 1.0). The agreement between the experiment and the theory is rather good. The most serious limitation is that the theoretical energy of the second peak at approx. 2.3 eV is too high with respect to experiment by 0.3 eV. The intensity of this peak is also too low by 25%. Finally, there is a difference at the leading, low BE edge of the spectra.
The identification of the bond responsible for the chemical shift of the atomic orbitals BEs is shown in the central column of TableI. Some mixing was present for the C(1s) orbitals in the initial, GS, state calculations where some of these orbitals were not localized exclusively on a single C atom but were distributed over a few of the C atoms; this occurred especially when the C(1s) orbital energies were nearly degenerate. However, the singly occupied C(1s) orbitals of the ionic state HF wavefunctions were all localized on a single C atom. The fact that the initial state C(1s) orbitals were sometimes not localized was taken into account in our calculation of the SA relative XPS intensities. Nine different environments can be identified from the data in TableIand the model molecule in
FIG. 2. (a) Experimental C1s spectrum decomposed empirically. (b) Com-parison of the experimental and simulated C1s spectra obtained from the sum of the calculated contributions of each orbitals.
Fig.1(the relevant C atom orbital is marked with an asterisk), with the following method.
1. Cph∗–Cquater: C6 and C25 of the phenyl ring bonded to the
unique quaternary carbon, C24.
2. Cph: C atoms of the 2 phenyl rings (C2-5, C26, C27, C29,
and C30). 3. CH3: C46, C50.
4. Cquater: quaternary C (C24).
5. N–C–C*–N: C–N bond within the EDA molecule (C18). C20 is discarded because it is bonded to a primary N(H2)
which shifted its 1s electron BE by +0.2 eV as compared to C18, whereas it is absent of the real surface. As a consequence, C18 is counted twice (C18 + “actual” C20). 6. N–C*–C(OH): C–N bond of the DGEBA molecule (C16)
somehow shifted by the neighboring C–OH.
7. Cph∗–O–C: C atoms of the phenyl rings (C1 and C28)
bonded to O (O7 and O31). 8. C–OH: C9.
9. C*–O–Cph: C atom from the DGEBA chain (C8). C32 is
discarded because the neighboring epoxy ring shifts its 1s electron BE by 0.29 eV as compared to C8, whereas it is absent of the actual surface.
Therefore a first consequence of using theoretical modeling is that it offers the possibility to decompose the XPS spectra with many contributions that are guaranteed by
the theory. In that sense, the 3 broad contributions of Fig.2(a) now decompose into
• C–C, C–H → phenyls C (∆BE = +0 to 0.25 eV) + CH3
(∆BE = +0.26 to 0.28 eV);
• C–C*–N → C–C*–N within EDA (∆BE = +1.00 eV), C–C*–N within DGEBA (∆BE = +1.25 eV), and an additional non-negligible quaternary C atom contribution (∆BE = +0.82 eV); and
• C–O–C, C–OH → C–O–C (∆BE = +1.89 to 2.36 eV), C–OH (∆BE = +2.09 eV).
Therefore, to finely decompose the XPS experimental details of the C1s peaks of a polymer composed of similar bonds, acquired in similar conditions (e.g., pass energy and apparatus resolution), it may be appropriate to use a small FWHM broadening for localized contributions (such as CH3,
C–C*–N, quaternary C, and C–OH), and a larger broadening when an apparently similar environment allows a modest variation of the BE shifts from these C atoms as, for example, for the phenyls and the C–O–C, in the present work. We describe such variation of the ∆BE as a ∆(∆BE).
Overall, from the interpretation of both spectra in Figs.2(a)and2(b), we state that the assignment of each bond at specific ∆BE is correct and can be used to describe the poly-epoxy surface. Limitations and perspectives are discussed in Sec.V.
V. DISCUSSION
In Fig.2(b), we observe discrepancies between experi-ment and theory in terms of position of the higher-BE peak, relative intensities, and at the low-BE edge of the spectra.
Improvement to the HF calculations could include using larger basis sets than the DZ + basis sets we have used which may be responsible for the positioning of the second peak at a too high BE. In particular, we could consider increasing the size of the s basis set and adding a d polarization function for the C, N, and O atoms, i.e., a (5,4,1) contracted basis set for these atoms and, possibly, a (3,1) contracted basis set for the H atoms. The larger basis sets for C, N, and O atoms might allow better screening of the core-holes that could shift the energies and intensities of the different C(1s) peaks and correct the actual difference. Another possible limitation is that HF calculations do not include static electron correlation effects; such static correlation effects, especially those involving promotion from occupied bonding pi orbitals to unoccupied anti-bonding pi orbitals could change energies and intensities. In the study of the much simpler CO,39 the
static correlation from promoting 1pi(2) to 2pi(2) appears to have a significant effect on the 1s BEs. However, treating this static correlation would be much more complex in the large systems presented here than for the much simpler case of CO. Another improvement of the fit could be the use of a different Voigt function with a larger Gaussian width. But, we are reluctant to use the Gaussian broadening as a free parameter since it would introduce an empirical character into the study. Anyway, before any of the theoretical parameter is modified, there is another limitation that surpasses all the
FIG. 3. C1s spectra decomposed using the ∆BE(∆SCF) results along with the actual stoichiometry.
others which is the size of the dimer model; although it allows a correct description of the chemistry of the system, it is not correct for the estimation of intensities because it does not respect the actual stoichiometry. Supporting evidence for this assertion is shown in Fig. 3 where the C1s peak decomposition is obtained by using ∆BE (∆SCF) corrected from the stoichiometric composition obtained by dividing the number of orbitals in a particular family (see TableI, LEFT) over the total number of C1s orbitals, 44, in the bulk solid.
We observe a better positioning of the second peak at about 286.5 eV. Nevertheless, discrepancies remain in the BE region between 285.5 and 286 eV, and at the leading low-BE edge of the spectra. Additionally, the total intensity of the phenyls and CH3contributions is higher than
experiment by about 20%. Nevertheless, intensities corrected from stoichiometry indicate that the poly-epoxy surface is close to a bulk truncation. The surface may be enriched in oxygenated species since the second higher-BE peak relative intensity is higher in experiment than in theory.
The only way to further improve our results would be to start from a different model that could take into account the neighboring chains and the presence of vacuum, i.e., moving towards a semi-infinite model mimicking a surface instead of a molecular model. This is a long-term objective since it involves creating such a surface by cutting a small cluster into a large model surface obtained, for instance, by classical molecular dynamics and Monte Carlo calculations. With this strategy, a large system is allowed to relax in the presence of vacuum at a given temperature, and a slab can be extracted for electronic structure calculations with a limited number of atoms.
VI. CONCLUSIONS
We have presented a detailed description of the C1s spectrum of a poly-epoxy surface with the aid of theoretical calculations of the relative binding energies and intensities of the peak components. Whereas HF calculations have proven their robustness in the framework of the ∆SCF methodology for small molecules,4,12–14 we have extended
these applications to a molecule of poly-epoxy, which contains
61 distinct and symmetry inequivalent atoms, with a fairly good success. A decomposition of the C1s peak by an experienced experimentalist yields to only three environments for the C atoms, i.e., C–C/C–H, C–N, and C–OH/C–O–C, plus the shake satellite. Supported by HF calculations, one now decomposes the same peak into 9 contributions with well-defined origins, some of them being traditionally lost in a larger global contribution (e.g., the quaternary C atom where we usually attribute C–N contributions). In addition, we notice that whereas some contributions are found at specific ∆BE with regards to the reference peak, and others allow more or less large ∆(∆BE). For instance, in the present study, C–O–C environments spread from ∆BE = +1.89 eV to ∆BE = +2.36 eV because of the variation of the polarization of neighboring bonds. In this specific case, one should add ∆(∆BE) = 0.47 eV to the FWHM of the contribution in order to account for the uncertainty about its relative position. This additional broadening is naturally taken into account in the analysis of the ∆SCF wavefunctions; nevertheless, with the theoretical guidance that we have provided, it could also be included in the empirical analysis and assignments of the experimental XPS data.
In order to improve the matching between experimental and simulated spectra, we have proposed several directions including the increase of the size of the basis sets used in the HF calculations and the involvement of electronic correlation effects. However, perhaps the most immediate and pressing need is to develop an improved model for the surface of the polymer.
ACKNOWLEDGMENTS
T.D. and A.G. acknowledge the Agence Nationale de la Recherche for financial support in the framework of the LabCom program COCOON, under Contract No. ANR-14-LAB3-0010-01. P.S.B. acknowledges the support from the U.S. Department of Energy, Office of Science, Office of Basic Energy Sciences, Chemical Sciences, Geosciences, and Biosciences (CSGB) Division through the Geosciences program at Pacific Northwest National Laboratory.
1J. Kanzow et al.,Appl. Surf. Sci.239(2), 227–236 (2005); J. Ge et al.,Thin
Solid Films 440(1–2), 198–207 (2003); C. v. Bechtolsheim et al.,Appl.
Surf. Sci.151(1–2), 119–128 (1999); V. Zaporojtchenko et al.,
Microelec-tron. Eng.50(1–4), 465–471 (2000); T. Strunskus et al., Mater. Corros. 49(3), 180–188 (1998); D. Schaubroeck et al.,Appl. Surf. Sci.255(21), 8780–8787 (2009); 256(21),6269–6278(2010); 305,321–329(2014); 303,
465–472(2014);J. Adhes. Sci. Technol.26(18–19), 2301–2314 (2012); M. Charbonnier and M. Romand, Int. J. Adhes. Adhes. 23(4), 277–285 (2003); K. Demirkan et al.,J. Appl. Phys.103(3), 034505 (2008); A. Meiser et al.,Int. J. Adhes. Adhes.30(3), 170–177 (2010); N. Li et al.,J. Adhes.
Sci. Technol.26(10–11), 1407–1417 (2012); S. Siau et al.,J. Electrochem.
Soc. 152(6), C442–C455 (2005);Appl. Surf. Sci. 237(1–4), 457–462 (2004); G. Z. Xiao et al.,J. Appl. Polym. Sci.65(3), 449–458 (1997); H. Y. Lee and J. Yu,Mater. Sci. Eng.277(1–2), 154–160 (2000); S. Vidal et al.,
Plasmas Polym. 5(1), 15–29 (2000); A. Meiser et al., J. Adhes. 84(4), 299–321 (2008); J. F. Coulon et al.,Appl. Surf. Sci.283, 843–850 (2013); E. Njuhovic et al.,Surf. Coat. Technol.232, 319–325 (2013); V. Prysiazhnyi et al.,ibid.258, 1082–1089 (2014); T. Duguet et al.,ibid.230, 254–259 (2013).
2T. Semoto, Y. Tsuji, and K. Yoshizawa,J. Phys. Chem. C115, 11701 (2011).
3T. Duguet, C. Bessaguet, M. Aufray, J. Esvan, C. Charvillat, C. Vahlas, and
4P. S. Bagus, E. S. Ilton, and C. J. Nelin,Surf. Sci. Rep.68, 273 (2013). 5T. Otsuka, K. Endo, M. Suhara, and D. P. Chong,J. Mol. Struct.522, 47
(2000).
6K. Endo, S. Shimada, T. Ida, M. Suhara, E. Z. Kurmaev, A. Moewes, and
D. P. Chong,J. Mol. Struct.561, 17 (2001).
7K. Endo, Y. Kaneda, H. Okada, D. P. Chong, and P. Duffy,J. Phys. Chem.
100, 19455 (1996).
8K. Endo, S. Maeda, and Y. Kaneda,Polym. J.29, 255 (1997).
9K. Endo, S. Maeda, and M. Aida,Polym. J.29, 171 (1997).
10J. Lüder, M. de Simone, R. Totani, M. Coreno, C. Grazioli, B. Sanyal, O.
Eriksson, B. Brena, and C. Puglia,J. Chem. Phys.142, 074305 (2015).
11Y. Travaly, P. Bertrand, G. M. Rignanese, and X. Gonze,J. Adhesion66, 339 (1998).
12N. Pueyo Bellafont, F. Illas, and P. S. Bagus,Phys. Chem. Chem. Phys.17, 4015 (2015).
13N. Pueyo Bellafont, F. Viñes, and F. Illas,J. Chem. Theory Comput.12, 324
(2016).
14N. Pueyo Bellafont, P. S. Bagus, and F. Illas,J. Chem. Phys.142, 214102 (2015).
15T. L. Barr, The Principles and Practice of X-Ray Photoelectron Spectroscopy
(Taylor and Francis, London, 1994).
16P. S. Bagus, M. Schrenk, D. W. Davis, and D. A. Shirley,Phys. Rev. A9, 1090 (1974).
17T. Åberg,Phys. Rev.156, 35 (1967).
18R. Manne and T. Åberg,Chem. Phys. Lett.7, 282 (1970).
19P. S. Bagus, D. Coolbaugh, S. P. Kowalczyk, G. Pacchioni, and F. Parmigiani,
J. Electron Spectrosc. Relat. Phenom.51, 69 (1990).
20T. R. Leftwich and A. V. Teplyakov,J. Electron Spectrosc. Relat. Phenom.
175, 31 (2009).
21M. Giesbers, A. T. M. Marcelis, and H. Zuilhof, Langmuir 29, 4782 (2013).
22O. Snezhkova, J. Lüder, A. Wiengarten, S. R. Burema, F. Bischoff, Y. He, J.
Rusz, J. Knudsen, M.-L. Bocquet, K. Seufert, J. V. Barth, W. Auwarter, B. Brena, and J. Schnadt,Phys. Rev. B92, 075429 (2015).
23J. L. Cabellos, D. J. Mowbray, E. Goiri, A. El-Sayed, L. Floreano, D. G.
de Oteyza, C. Rogero, J. E. Ortega, and A. Rubio,J. Phys. Chem. C116, 17991 (2012).
24K. Weiss, P. S. Bagus, and C. Wöll,J. Chem. Phys.111, 6834 (1999).
25A. M. Koster, G. Geudtner, P. Calaminici, M. E. Casida, V. D. Dominguez, R.
Flores-Moreno, G. U. Gamboa, A. Goursot, T. Heine, A. Ipatov, F. Janetzko, J. M. d. Campo, J. U. Reveles, A. Vela, B. Zuniga-Gutierrez, and D. R. Salahub, deMon2k, Version 3, The deMon developers, Cinvestav, Mexico-city, 2011.
26I. N. Levine, Quantum Chemistry (Prentice-Hall, Upper Saddle River, NJ,
2000).
27F. B. v. Duijneveldt, RJ94, IBM, 1971.
28We are indebted to our colleagues at the Laboratoire de Chimie Theorique,
Université Pierre et Marie Curie, Paris, France for having pointed this approach out to us.
29W. L. Jolly, in Proceedings of the International Conference on Electron
Spectroscopy(North-Holland, Amsterdam, Netherlands, 1972), p. 629.
30W. L. Jolly and D. N. Hendrickson,J. Am. Chem. Soc.92, 1863 (1970).
31P.-O. Löwdin,Phys. Rev.97, 1474 (1955).
32F. Prosser and S. Hagstrom,Int. J. Quantum Chem.2, 89 (1968). 33CLIPS is a program system to compute ab initio SCF and correlated
wavefunctions for polyatomic systems. It has been developed based on the publicly available programs in the ALCHEMY package from the IBM San Jose Research Laboratory by P. S. Bagus, B. Liu, A. D. McLean, and M. Yoshimine.
34C. J. Nelin, P. S. Bagus, M. A. Brown, M. Sterrer, and H.-J. Freund,Angew.
Chem., Int. Ed.50, 10174 (2011).
35B. Kempgens, K. Maier, A. Kivimäki, H. M. Köppe, M. Neeb, M. N.
Piancastelli, U. Hergenhahn, and A. M. Bradshaw,J. Phys. B: At., Mol. Opt. Phys.30, L741 (1997).
36J. A. Gubner,J. Phys. A: Math. Gen.27, L745 (1994).
37J. L. Campbell and T. Papp,At. Data Nucl. Data Tables77, 1 (2001).
38M. P. Seah, I. S. Gilmore, and S. J. Spencer,Surf. Sci.461, 1 (2000).