COD "LOSS" IN ENHANCED BIOLOGICAL PHOSPHORUS REMOVAL SYSTEMS
REZA SALEHI
DÉPARTEMENT DES GÉNIES CIVIL, GÉOLOGIQUE ET DES MINES ÉCOLE POLYTECHNIQUE DE MONTRÉAL
THÈSE PRÉSENTÉE EN VUE DE L’OBTENTION DU DIPLÔME DE PHILOSOPHIAE DOCTOR
(GÉNIE CIVIL) AVRIL 2016
UNIVERSITÉ DE MONTRÉAL
ÉCOLE POLYTECHNIQUE DE MONTRÉAL
Cette thèse intitulée :
COD "LOSS" IN ENHANCED BIOLOGICAL PHOSPHORUS REMOVAL SYSTEMS
présentée par : SALEHI Reza
en vue de l’obtention du diplôme de : Philosophiae Doctor a été dûment acceptée par le jury d’examen constitué de :
M. BARBEAU Benoit, Ph. D., président
M. COMEAU Yves, Ph. D., membre et directeur de recherche M. DOLD Peter L., Ph. D., membre et codirecteur de recherche Mme DORNER Sarah, Ph. D., membre
DEDICATION
ACKNOWLEDGEMENTS
I express my deepest gratitude to my research supervisor, Professor Yves Comeau for his valuable support, useful advice, critical insight, continuous trust in me and his patience over the period of this research study.
I give my special thanks to my co-supervisor and the president of EnviroSim Associates Ltd., Peter Dold, for his encouragement, immense knowledge, valuable support and excellent guidance as well as his patience throughout this research.
I thank Professor Jalal Hawari and Dr. Marc-Andre Labelle for their help and valuable guidance. Thanks also to Denis Bouchard, the technician in the environmental Lab for his endless assistance and technical support for my experimental system.
Melanie Bolduc, the technician in the environmental Lab, is thankfully acknowledged for her help with the laboratory procedures, safety concerns and ordering the chemicals needed over the period of this research.
I thank all my colleagues of the laboratory of Professor Yves Comeau for assistance and discussion over the period of this study. My research would not have been possible without their help.
Finally, thanks to my family who encouraged me to pursue my Ph.D. study in Canada and support me spiritually as always throughout this long period.
RÉSUMÉ
La validation des données observées provenant d'un procédé de traitement des eaux usées peut être réalisée en effectuant les bilans massiques en DCO et en azote. De faibles bilans massiques en DCO (environ 80%) ont été rapportés dans un certain nombre de cas pour les systèmes à boues activées incluant des zones non aérées.
L'objectif de cette recherche était d'évaluer rigoureusement les bilans de masse en DCO et en azote sous différentes conditions environnementales, consitutés de systèmes aérobie-aérobie (OX-OX), anoxie-aérobie (AX-OX) et anaérobie- aérobie (AN-OX), ce dernier étant utilisé pour la déphosphatation biologique des eaux usées et de proposer une explication à ce phénomène de faible bilan DCO.
Dans la première phase expérimentale (identifiée système OX-OX), un procédé de boues activées membranaire de taille laboratoire, constitué de deux réacteurs OX en série a été opéré à un temps de rétention des boues (TRB) de 10 jours et à une température de 20 °C à l'aide d'une eau usée synthétique contenant du citrate comme seule source de carbone. Des temps de rétention hydraulique (TRH) de 1,1 et 2,5 heures ont été appliqués pour le premier et le second réacteur, respectivement, et le rapport débit de recirculation sur celui de l'affluent (a) était de 4.5 L/L. De bons bilans massiques en DCO et en azote (101,4% et 101,3%, respectivement) ont été observés pour ce système.
Dans la deuxième phase expérimentale (identifiéesystème AX-OX), la condition du premier réacteur de la phase # 1 a été changée d'un état aérobie à un état anoxie. De plus, la concentration en DCO et d'azote de l'affluent a été d'ajustée pour s'assurer de maintenir une concentration de nitrate provenant de la recirculation dans le réacteur AX. Les données issues de cette phase ont présenté un bilan massique en DCO de 97%, ce qui est un peu inférieur à celui observé à la phase # 1 et un excellent bilan de masse d'azote d'environ 100%.
La troisième phase (identifiée système AN-OX) a été mise en place pour évaluer la possible perte de DCO en présence de conditions anaérobies. Par conséquent, le réacteur anoxie a été changé à des conditions anaérobies par ventilation de la phase gazeuse au-dessus du liquide avec de l'azote gazeux, et en diminuant la concentration d'azote de l'affluent et le débit de recirculation. Par rapport aux phases # 1 et 2, la concentration de phosphore de l'affluent a été augmentée de 20 à 50 mg P/L pour éviter toute limitation en phosphore pouvant résulter de la croissance des organismes accumulant le phosphore en excès de leurs besoins métaboliques, les
OAP. Cette phase a été divisée en deux phases principales # 3A et 3B selon le type de source de carbone utilisée. Le citrate, qui est une source de carbone fermentable, a été utilisé comme substrat pour la phase # 3A alors que la phase # 3B a été opérée à l'aide d'acétate, un substrat non fermentable.
Les données issues de la phase # 3A pour effectuer les bilans de masse ont été classées en sous-phases # 3A.1, 3A.2, 3A.3 et 3A.4 car il a été observé que les OAP on été actifs ou inactifs au cours de la phase # 3A.
Les phases # 3A.1 et 3A.3 fonctionnaient comme un système non déphosphatant avec des teneur en phosphore dans les boues d'environ 2,0% mg P/mg MVES (matières volatiles en suspension). Ces phases ont présenté un bilan massique en DCO entre 80% et 90%, et le bilan de masse d'azote était d'environ 100%.
Les phases # 3A.2 et 3A.4 fonctionnaient comme un système déphosphatant avec des teneur en phosphore dans les boues de 5% et 13% mg P/mg MVES, respectivement. Le bilan massique en DCO au cours de ces phases a varié entre 83% et 86% avec un bilan massique en azote de 100%. La principale raison pour la bonne élimination du phosphores dans la phase # 3A.4 était liée à une charge inférieure de oxygène et nitrate dans le réacteur AN par rapport à celle des phases # 3A.1 et 3A.3.
Lorsque la source de carbone a été changée de citrate à acétate (phase # 3B) les bilans massiques en DCO et en azote ont été d'environ 90% et 100%, respectivement, avec une teneur en phosphore dans les boues de 12% mg P/mg MVES.
Ces résultats suggèrent que la perte de DCO ne semble pas être reliée à l’élimination du phosphore. Les principaux mécanismes pouvant expliquer la perte de DCO observée pourraient être reliés à la fermentation résultant en la formation de composés volatils réduits sous conditions anaérobies dans le réacteur ou à l'intérieur de flocs microbiens. Ces composés incluent les acides gras volatils, l'hydrogène, l'anhydride sulfuré et le méthane qui pourraient être dégazés soit dans le réacteur non aéré ou à leur entrée dans le réacteur aérobie, un phénomène qu'il serait plus probable d'observer dans des réacteurs peu profonds tels qu'utilisés à l'échelle de laboratoire avec des transferts de gaz très inefficaces que dans des systèmes à pleine échelle.
Les résultats d'essais discontinus à différentes valeurs de pH ont révélé que l’aération et le mélange ont produit un dégazage négligeable d’acétate. La contribution de la production de méthane à la perte de DCO observée aété estimée à 0,05%. Le soufre a pu contribuer à une perte
de DCO (0,1-2,0%) lorsque le sulfate réduit dans le réacteur anaérobie n'a pas été réoxydé dans les conditions aérobies subséquentes. L’oxydation partielle du polyhydroxybutyrate-valérate (PHBV) qui pourrait survenir lors de la détermination analytique de la DCO a été démontrée négligeable. Les tentatives de mesure de la concentration d'hydrogène dissous dans le réacteur anaérobie ont indiqué que la production d'hydrogène n'a pas contribué à expliquer la perte de DCO observée (0 %). Les résultats d'essais discontinus ont montré que l'hydrogène a été facilement dégazé d'une colonne à bulles au laboratoire dans laquelle seulement 32% de la concentration théorique de saturation a pu être atteinte. Donc, l'hypothèse de la production d'hydrogène et dégazage demeure comme une cause potentielle pour expliquer une certaine perte de DCO. La perte de DCO en l'absence de source de carbone fermentable à l’affluent a été expliquée par le mécanisme de mort-régénération de la biomasse qui permet la production de substrat biodégradable pouvant être fermenté.
Cette recherche propose les équations requises pour effectuer le bilan massique en DCO sous différentes conditions environnementales.
Enfin, les résultats de cette recherche suggèrent que la perte de DCO proviendrait de la perte de substrats volatils et réduits produits par fermentation dans des systèmes à échelle laboratoire où la faible profondeur de liquide produit un artefact qui ne serait probablement pas observé de façon significative dans des réacteurs à pleine échelle.
ABSTRACT
Validation of observed data derived from a wastewater treatment process can be performed by conducting chemical oxygen demand (COD) and nitrogen (N) mass balances. Poor COD mass balances (about 80%) have been reported in a number of instances for activated sludge systems incorporating anaerobic zone.
The objective of this research was to evaluate rigorously the COD and N mass balances under different environmental conditions including aerobic-aerobic (OX-OX), anoxic-aerobic (AX-OX) and anaerobic-aerobic (AN-OX; as found in enhanced biological phosphorus removal (EBPR)) systems and to propose an explanation for this phenomenon.
In the first experimental phase (termed OX-OX system), a laboratory scale continuous flow system consisting of two OX reactors in series was operated at a sludge retention time (SRT) of 10 days and a temperature of 20 oC using a synthetic wastewater containing citrate as sole carbon source. A hydraulic retention time (HRT) of 1.1 and 2.5 hours applied for the first and second reactors, respectively, where the recycle-to-influent flow ratio (a) was 4.5 L/L. Good COD and N mass balances (101.4% and 101.3%, respectively) were observed on this system.
In the second experimental phase (termed AX-OX system), the condition of the first reactor of phase # 1 was switched from OX to AX. No more changes made compared to phase # 1 except that the influent COD and N concentrations were adjusted to provide enough nitrate concentration in the AX reactor. Data derived from this phase exhibited a COD mass balance of 97% which was a little lower than that observed in phase # 1 and an excellent N mass balance of approximately 100%.
The third phase (termed AN-OX system) was set up to evaluate the possible COD loss expected occurring in the presence of AN conditions. Therefore, the AX reactor was switched to AN conditions by flushing the head space with nitrogen gas, and by decreasing the influent nitrogen concentration and recycle flow rate. Compared to phases # 1 and 2, the influent phosphorus concentration was increased from 20 to 50 mg P/L to prevent any phosphorus limitation that could result from the growth of phosphate accumulating organisms (PAOs). This phase was divided into two main phases # 3A and 3B depending on type of carbon source used. Citrate which is a fermentable carbon source was used as substrate for phase # 3A whereas phase # 3B was operated using acetate, a non fermentable substrate.
The data derived from phase # 3A to perform the mass balances were categorized into sub-phases # 3A.1, 3A.2, 3A.3 and 3A.4 because it was observed that PAOs were active or non-active throughout phase # 3A.
Phases # 3A.1 and 3A.3 were operating as a non-EBPR system with sludge phosphorus content of about 2.0% mg P/mg VSS. These phases exhibited a COD mass balance ranging between about 80% and 90% where N mass balance averaged approximately 100%.
Phases # 3A.2 and 3A.4 were an EBPR system with a sludge phosphorus content of about 5% and 13% mg P/mg VSS. The COD mass balance during these phases ranged between 83% and 86% with a nitrogen mass balance of 100%. The main reason for good phosphorus removal in phase # 3A.4 was related to a lower oxygen and nitrate loading to the AN reactor compared to that in phases # 3A.1-3A.3.
When carbon source was changed from citrate to acetate (phase # 3B), the COD and N mass balances averaged about 90% and 100%, respectively, with a sludge phosphorus content of 12% mg P/mg VSS.
These findings suggested that the COD mass balance did not seem to be connected with phosphorus removal. The main possible mechanisms contributing to the observed COD loss was hypothesized to be due to fermentation resulting in the formation of reduced volatile compounds formed under AN conditions in the reactor or within microbial flocs (volatile fatty acids, methane, hydrogen sulfide, hydrogen) that are stripped either in the non aerated reactor or upon entering the OX reactor, a phenomenon expected more in shallow lab scale reactors with very inefficient gas transfer than full scale systems.
Batch tests results at different pH values revealed that aeration and mixing induced stripping of acetate was negligible. The contribution of methane production to the observed COD loss was as small as 0.05%. Sulfur was shown to contribute to the COD loss (0.1-2.0%) when the anaerobic sulfate reduced was not reoxidized under aerobic conditions. Partial oxidation of polyhydroxybutyrate-valerate (PHBV) that may occur under the COD test conditions was found to be negligible. Attempts to measure dissolved hydrogen concentration in the AN reactor indicated that hydrogen production did not contribute to explain the observed COD loss (0%). The result of a batch showed that hydrogen was easily stripped in a hydrogen bubble lab scale column in which no more than 32% of the saturation concentration could be achieved. Therefore, the hypothesis of hydrogen production and stripping remains as a likely potential cause to
explain some COD loss. Death-regeneration phenomenon was hypothesized as a possible explanation for some COD loss even in the absence of a fermentable influent carbon source because the consequence of death-regeneration is the production of biodegradable substrate that can be fermented.
This research proposes an useful equation to perform the COD mass balance under different environmental conditions. The results of this research suggest that COD loss from laboratory scale systems may be enhanced due to the shallow depth resulting in this phenomenon being a lab scale artefact that may not be observed in full scale deep reactors.
TABLE OF CONTENTS
DEDICATION ... III ACKNOWLEDGEMENTS ... IV RÉSUMÉ ... V ABSTRACT ... VIII TABLE OF CONTENTS ... XI LIST OF TABLES ... XVII LIST OF FIGURES ... XX LIST OF SYMBOLS AND ABBREVIATIONS ... XXII LIST OF APPENDICES ... XXIXCHAPTER 1 INTRODUCTION ... 1
1.1 Introduction ... 1
1.2 Body of the thesis... 2
CHAPTER 2 LITERATURE REVIEW ... 4
2.1 Phosphorus removal process ... 4
2.1.1 Enhanced Biological Phosphorus Removal (EBPR) ... 4
2.1.2 EBPR process configurations ... 6
2.1.3 Sludge phosphorus content ... 9
2.2 Anaerobic digestion (AD) processes ... 9
2.2.1 Disintegration ... 9
2.2.2 Hydrolysis ... 9
2.2.3 Acidogenesis/acetogenesis ... 10
2.2.4 Methanogenesis... 18
2.2.5.1 Fate of reduced sulfur produced by SRO ... 18
2.3 Gas transfer in biological processes ... 19
2.3.1 VCs stripping by diffused aeration in an OX reactor ... 23
2.4 COD mass balance ... 24
2.4.1 Reported COD and N mass balances ... 25
2.4.2 COD “loss” ... 29
2.4.2.1 Reported COD “loss” ... 29
2.5 Parameters affecting COD mass balance ... 32
2.5.1 OUR measurement and open reactor surface ... 32
2.5.2 Denitrification stoichiometry ... 32
2.5.3 Temperature and feed COD source ... 32
2.6 Possible causes of COD “loss” ... 33
2.6.1 Experimental error and COD test limitation ... 34
2.6.2 H2 production and stripping ... 34
2.6.3 CH4 production and stripping ... 35
2.6.4 VFAs production and stripping either in the AN or OX reactor ... 36
2.6.5 Sulfate reduction in AN reactor ... 36
2.7 The importance of COD “loss” ... 36
2.8 Theoretical considerations ... 37
2.8.1 COD mass balance calculation ... 37
2.8.1.1 Evaluation of FCODoxid in a two-reactor system ... 39
2.8.1.2 Derivation of an equation for FOOURB ... 41
2.8.1.3 Determination of FONO3,denit ... 45
2.8.1.5 Determination of FOsulfate reduc and FOsulfide oxid ... 50
2.8.2 N mass balance calculation ... 52
2.8.3 P mass balance calculation ... 54
CHAPTER 3 HYPOTHESES AND OBJECTIVES ... 56
3.1 Hypotheses ... 56
3.2 Originality justification ... 56
3.3 Main objective ... 56
3.4 Specific objectives ... 56
CHAPTER 4 MATERIALS AND METHODS ... 57
4.1 Synthetic wastewater ... 57 4.2 Start-up sludge ... 59 4.3 System set-up ... 59 4.4 Reactors system ... 59 4.5 Tubing lines ... 63 4.6 Operating conditions ... 63 4.6.1 Phase # 1 (OX-OX) ... 63 4.6.2 Phase # 2 (AX-OX) ... 64 4.6.3 Phase # 3 (AN-OX) ... 65
4.6.3.1 Phase # 3A (AN-OX with citrate) ... 66
4.6.3.2 Phase # 3B (AN-OX with acetate) ... 67
4.7 Oxygen mass transfer coefficient (kLa) determination ... 67
4.7.1 Experiment procedure ... 67
4.7.2 Equations... 68
4.9 Measurement of dissolved H2 in AN reactor ... 69
4.10 Determination of dissolved CH4 in AN reactor ... 69
4.11 Batch tests: ... 70
4.11.1 Aerating and mixing induced stripping of acetate ... 70
4.11.2 H2 stripping test... 70
4.12 COD test limitation ... 71
4.13 Sampling procedure ... 71
4.13.1 Influent ... 72
4.13.2 Effluent ... 72
4.13.3 Mixed liquor (reactor R2) ... 72
4.13.4 Mixed liquor (reactor R1 effluent) ... 72
4.14 Analytical methods ... 73 4.14.1 COD ... 73 4.14.2 Solids... 74 4.14.3 pH ... 74 4.14.4 DO ... 75 4.14.5 Temperature ... 75 4.14.6 TP and TKN ... 75 4.14.7 Ammonia, NO2- and NO3- ... 75 4.14.8 SO42- and o-PO43- ... 76 4.14.9 Dissolved hydrogen ... 76 4.14.10 Dissolved methane ... 76
CHAPTER 5 RESULTS AND DISCUSSION ... 77
5.2 Phosphorus removal ... 80
5.2.1 Phosphorus mass balance ... 83
5.3 Sulfate reduction ... 84
5.4 kLa evaluation ... 86
5.5 Biomass oxygen uptake rate (OURB) ... 88
5.6 COD and N mass balances ... 90
5.6.1 Phase # 1 ... 90
5.6.2 Phase # 2 ... 91
5.6.3 Phase # 3A.1 ... 92
5.6.4 Phases # 3A.2-3A.4... 93
5.6.5 Phase # 3B... 95
5.7 Possible mechanisms contributing in the COD loss observed ... 96
5.7.1 Sulfate reduction ... 96
5.7.2 Methane production ... 99
5.7.3 Hydrogen production/stripping ... 99
5.7.4 Aeration and mixing induced stripping of acetate ... 102
5.7.5 COD test limitation ... 102
5.7.6 Death-regeneration ... 105
5.8 Sensitivity analysis on COD loss for aeration parameters α and β ... 105
5.9 COD mass balance around separate AN and OX reactors ... 107
5.10 Statistical analysis of the COD mass balance results... 108
5.11 Comparison of oxygen consumption and observed yield (YOBS) ... 109
5.12 Integration of results ... 112
6.1 Conclusions ... 116
6.2 Recommendations ... 117
REFERENCES ... 118
LIST OF TABLES
Table 2-1: Description of symbols used in Figure 2.4 (adapted from Batstone et al., 2002) ... 13
Table 2-2: ADM1 matrix (only processes resulting in H2 production presented; adapted from Batstone et al., 2002) ... 15
Table 2-3: Values suggested for stoichiometric coefficients of components associated with H2 production processes according to ADM1 (adapted from Batstone et al., 2002) ... 16
Table 2-4: Diffusivity coefficient (D) of some VCs in water (adapted from Lide, 2003) ... 23
Table 2-5: Henry’s law constant (H) of some VCs in water (calculated from Coker, 2007) ... 23
Table 2-6: COD and N mass balance results in OX system (data from Schroeter et al., 1982) ... 26
Table 2-7: COD and N mass balance results of Arkley and Marais (1981) systems (calculated by Barker and Dold, 1995)... 26
Table 2-8: Summary of COD and N mass balance results in AX-OX, OX-AX and AX systems 28 Table 2-9: COD “loss” results adapted from Wentzel et al. (1989; 1990) (calculated by Barker and Dold, 1995) ... 30
Table 2-10: COD “loss” results in AO and UCT systems (Randall et al. 1992) ... 31
Table 2-11: Hypothesized mechanisms contributing to the COD loss in AN-OX systems ... 34
Table 2-12: Equations developed for FOOURB determination in R1 and R2 reactors illustrated in Figure 2.11 (cases #1-3) ... 44
Table 2-13: Equations developed for FOnit determination in R1 and R2 reactors illustrated in Figure 2.11 (cases #1-3) ... 49
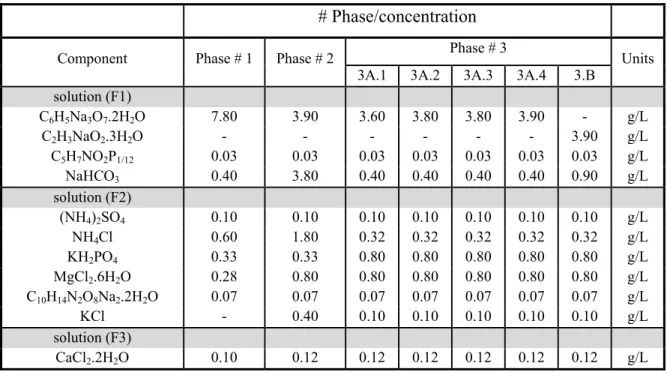
Table 4-1: Chemical composition and amount of each component in the stock solutions ... 57
Table 4-2: Chemical composition and amount of each component in the trace elements stock solution ... 58
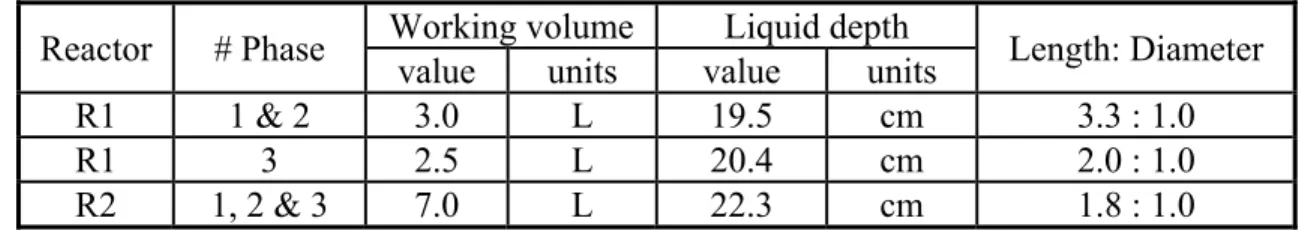
Table 4-3: Working volume and dimension of the reactors used in this study ... 60
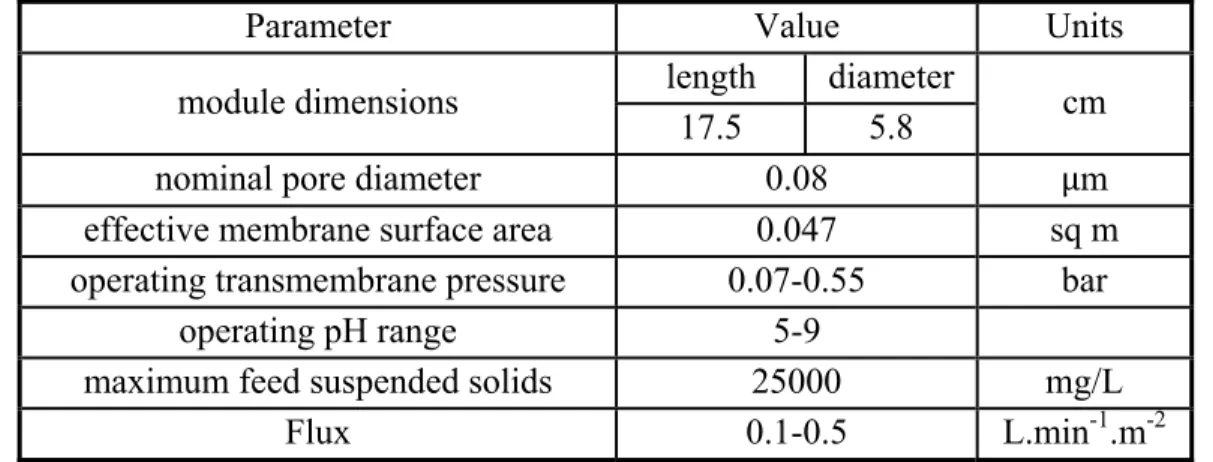
Table 4-4: Characteristics of HF membrane (Zenon ZW-1 module) ... 61
Table 4-6: Type of analysis and sampling locations ... 73
Table 4-7: Hach COD tubes precision and accuracy ... 74
Table 4-8: Hach methods for NO2- and NO3-and ammonia analysis ... 75
Table 5-1: Summary of operational data and concentration of various compounds over phases studied ... 79
Table 5-2: Nitrate and oxygen loading to AN reactor in phases # 3A.1 through 3B ... 83
Table 5-3: The kLa values used for reactors R1 and R2 (Phase # 1) ... 88
Table 5-4: COD and N mass balance results for phase # 1 ... 91
Table 5-5: COD and N mass balances results for phase # 2 ... 92
Table 5-6: COD and N mass balances results for phase # 3A.1 ... 93
Table 5-7: COD and N mass balances results for phase # 3A.2 ... 94
Table 5-8: COD and N mass balances results for phase # 3A.3 ... 95
Table 5-9: COD and N mass balances results for phase # 3A.4 ... 95
Table 5-10: COD and N mass balance results for phase # 3B ... 96
Table 5-11: COD mass balance and sulfate reduced in reactor R1 results for phases # 1, 2 and 3 ... 97
Table 5-12: Estimated contribution of sulfur in the COD mass balance for phases # 3A and 3B 98 Table 5-13: Measured and theoretical dissolved methane concentration in the AN mixed liquor to explain the observed COD loss in phases # 3A.3 (10.6 %) and 3A.4 (14.0 %) ... 99
Table 5-14: Measured and theoretical H2 concentration in the AN mixed liquor to explain the observed 9.7 to 14.0 % COD loss in phases # 3A.3, # 3B and # 3A.4 ... 100
Table 5-15: COD changes in a synthetic wastewater (prepared with acetate) depending on aerating and mixing time ... 102
Table 5-16: Comparison of ThOD and observed COD values of PHBV sample ... 104
Table 5-18: Statistical t-test results ran on the COD mass balances for phases # 1, 2, 3A and 3B
... 109
Table 5-19: Integration of operational and COD, N and P mass balances results ... 115
Table A. 1: Time schedule for phases studied ... 125
Table B. 1: Flow rates data for phases # 1, 2, 3A and 3B ... 128
Table B. 2: COD data for phases # 1, 2, 3A and 3B ... 130
Table B. 3: TKN data for phases # 1, 2, 3A and 3B ... 132
Table B. 4: TP data for phases # 1, 2, 3A and 3B ... 134
Table B. 5: Nitrate and nitrite data for phases # 1, 2, 3A and 3B ... 136
Table B. 6: Measured oxygen uptake rate (OURmeas) data for phases # 1, 2, 3A and 3B ... 138
Table B. 7: Biomass oxygen uptake rate (OURB) data for phases # 1, 2, 3A and 3B ... 140
Table B. 8: TSS and VSS data for phases # 1, 2, 3A and 3B ... 142
Table B. 9: fP, fVT and fCV data for phases # 1, 2, 3A and 3B ... 144
Table B. 10: Sulfate data for phases # 3A and 3B ... 146
Table B. 11: Orthophosphate (o-PO4) for phases # 1 and 2 ... 148
Table B. 12: Orthophosphate (o-PO4) for phases # 3A and 3B ... 148
Table B. 13: Recycle ratio (a) and dissolved oxygen (DO) data for phases # 1, 2, 3A and 3B .. 150
Table B. 14: Summary of the COD mass balance calculation results for phase # 3 (AN-OX) .. 152
Table B. 15: Summary of N mass balance calculation results for phase # 3 (AN-OX) ... 153
Table B. 16: Summary of P mass balance calculation results for phase # 3 (AN-OX) ... 154
Table B. 17: Typical example results of the calculated oxygen transfer efficiency (OTE) for the AN-OX system... 155
Table B. 18: Summary of the COD mass balance calculations for reactor R1 ... 158
Table B. 19: Summary of the COD mass balance calculations for reactor R2 ... 159
LIST OF FIGURES
Figure 2-1: Metabolic processes occurring in AN and OX/AX conditions by PAOs (adapted from
Yuan et al., 2012). ... 6
Figure 2-2: EBPR process (AO system) (adapted from van Haandel and van de Lubbe, 2007). ... 6
Figure 2-3: EBPR process configurations (adapted from Comeau, 1990) ... 8
Figure 2-4: Anaerobic conversion of complex organic matter ... 11
Figure 2-5: Death-regeneration concept for the activated sludge process ... 12
Figure 2-6: Schematic illustrating the different conversion pathways that involve in H2 production through AD processes (adapted from Batstone et al., 2002) ... 17
Figure 2-7: Schematic illustration of the fate of sulfide produced by SRO ... 19
Figure 2-8: Schematic representation of the movement of gas molecules in a liquid-gas system with (A) unsaturated liquid phase and (B) saturated liquid phase (adapted from von Sperling, 2007) ... 20
Figure 2-9: Conceptual representation of liquid-gas mass transfer steps in an AN reactor assuming the transfer rate is controlled by the liquid-film resistance (adapted from Kraemer and Bagley, 2007; Beckers et al., 2015). ... 21
Figure 2-10: Conceptual illustration of the COD mass balance components ... 39
Figure 2-11: Typical schematic diagram of the system used in this study. ... 40
Figure 2-12: Diagrammatic sketch of a continuous complete-mix reactor ... 42
Figure 2-13: Components contributing to N mass balance calculation ... 52
Figure 2-14: P mass balance components ... 55
Figure 4-1: HF Membrane ... 60
Figure 4-2: Rushton turbine impeller with six vertical blades used in this study ... 61
Figure 4-3: Schematic diagram of phase # 3 (AN-OX system). ... 62
Figure 4-5: Schematic of lab-scale AN reactor (measurement of dissolved H2) ... 69
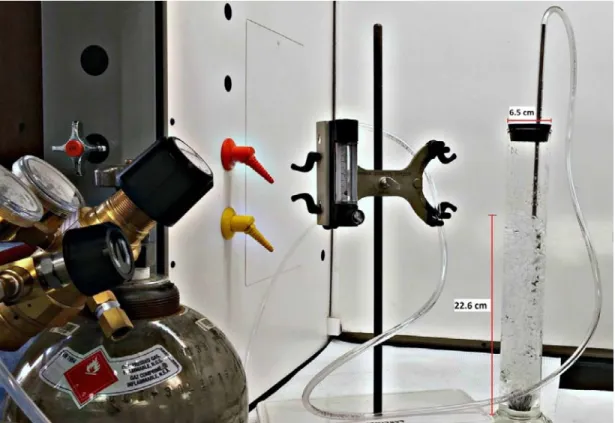
Figure 4-6: Photograph of the set-up used in the H2 stripping batch test ... 71
Figure 4-7: Sampling locations for this study ... 73
Figure 5-1: Observed changes in fP values during phases # 1 through 3B ... 80
Figure 5-2: Phosphate release and uptake as well as comparison of phosphate in the influent, AN reactor and effluent (Phases # 3A.4 and 3B) ... 82
Figure 5-3: Comparison of sulfate concentration in the influent, AN reactor and effluent (Phases # 3A/B)... 85
Figure 5-4: Black precipitate observed on the inside wall of the tube (1/4 in ID × 3/8 in OD) transferring mixed liquor from AN reactor to the OX reactor (Phase # 3B) ... 86
Figure 5-5: Time course of DO concentration (a typical experiment performed on reactor R2) . 87 Figure 5-6: kLa obtained during a typical experiment in reactor R2 ... 87
Figure 5-7: A typical graph of OUR determination for reactors R1 and R2 (Phase # 1) ... 89
Figure 5-8: A comparison of OURmeas and OURB in reactors R1 and R2 (phase # 1) ... 90
Figure 5-9: COD mass balance versus mass rate of sulfate reduced in reactor R1 in phases # 1, # 2 and # 3A/B ... 97
Figure 5-10: Dissolution of hydrogen gas in distilled water over time as measured by the COD test ... 101
Figure 5-11: (a). Changes in the COD mass balance,YOBS and oxygen consumption during phases # 1, 2 and 3; (b). Relationships between COD mass balance,YOBS and oxygen consumption ... 111
Figure A. 1: Schematic illustrating the timeline for phases studied ... 124
Figure B. 1: Definition sketch for COD mass balance calculation around the separate AN and OX reactors in an AN-OXsystem ... 156
LIST OF SYMBOLS AND ABBREVIATIONS
a Aerobic mixed liquor recycle ratio with respect to Qinf (L/L)AD Anaerobic digestion process ADM1 Anaerobic digestion model no. 1 AN Anaerobic
AnS Anaerobic stabilization
AO Anaerobic-aerobic process
A2O Anaerobic-anoxic-aerobic process
APHA American Public Health Association
ATP Adenosine triphosphate
AX Anoxic
Bardenpho Barnard-denitrification-phosphorus process BEPR Biological excess phosphorus removal BOD Biochemical oxygen demand (mg O2/L)
CA* Concentration of compound A in the bulk liquid in equilibrium with that
in the bulk gas phase (mol/L)
CA,i Concentration of compound A at the liquid-gas interface (mol/L)
CA,liquid Concentration of compound A in the bulk liquid (mol/L)
COD Chemical oxygen demand (mg COD/L)
DA Diffusivity coefficient of compound A (cm2.s-1)
DO Dissolved oxygen concentration (mg O2/L)
DOinf Influent DO concentration (mg O2/L)
DOmid,R1 DO concentration at midpoint during OUR test in reactor R1 (mg O2/L)
DOmid,R2 DO concentration at midpoint during OUR test in reactor R2 (mg O2/L)
DOsat.,clean water Saturation DO concentration in clean water (mg O2/L)
DOsat.,used Saturation DO concentration in the mixed liquor (mg O2/L)
EBPR Enhanced biological phosphorus removal EPA Environmental Protection Agency
F1 Influent organic solution F2 Influent mineral solution F3 Influent calcium-distilled water
FCODINPUT Mass rate of total COD entering the system (mg COD/d)
FCODOUTPUT Mass rate of total COD in the streams leaving the system plus total COD
oxidized across the system (mg COD/d)
FCODoxid Mass rate of total COD oxidized across the system (mg COD/d)
FID Flame ionization detector
FNNO3,denit Mass rate of nitrate denitrified (mg N/d)
FNNO3,inf Influent nitrate mass rate (mg N/d)
FNNO2,inf Influent nitrite mass rate (mg N/d)
FNNO3,input R1 Mass rate of nitrate entering reactor R1 (mg N/d)
FNNO3,output R1 Mass rate of nitrate leaving reactor R1 (mg N/d)
FNNO3,eff Effluent nitrate mass rate (mg N/d)
FNNO3,prod Mass rate of nitrate produced (mg N/d)
FNNO3,WAS Mass rate of nitrate in the sludge wastage (mg N/d)
FNNO2,eff Nitrite effluent mass rate (mg N/d)
FNNO2,WAS Mass rate of nitrite in the sludge wastage (mg N/d)
FNTKN,eff Effluent TKN mass rate (mg N/d)
FNTKN,inf Influent TKN mass rate (mg N/d)
FNTKN,WAS Mass rate of TKN in the sludge wastage (mg N/d)
FNTN,INPUT Mass rate of TN entering the system (mg N/d)
FNTN,OUTPUT Mass rate of TN leaving the system (mg N/d)
FOair Mass rate of oxygen transferred to the reactor R2 (g O2/L)
FOnit Mass rate of oxygen consumed for nitrification (mg COD/d)
FONO3,denit Mass rate of oxygen equivalent of nitrate denitrified (mg COD/d)
FO Mass rate of oxygen utilized by biomass (mg COD/d) FO Measured OUR mass rate (mg COD/d)
FO Mass rate of oxygen entering reactor from the liquid surface (mg COD/d) FO Mass rate of oxygen entering reactor R1 through the influent/recycle
streams (mg COD/d)
FOSO4 reduc Mass rate of oxygen equivalent of sulfate reduced (mg COD/d)
FOsulfide oxid Mass rate of oxygen consumed for sulfide oxidation (mg COD/d)
FPTP,inf Influent TP mass rate (mg P/d)
FPTP,WAS Sludge wastage TP mass rate (mg P/d)
FSeff Mass rate of effluent soluble COD (mg COD/d)
FSWAS Mass rate of soluble COD in the sludge wastage (mg COD/d)
FST,eff Effluent total COD mass rate (mg COD/d)
FST,inf Influent total COD mass rate (mg COD/d)
FST,WAS Mass rate of the total COD in the sludge wastage (mg COD/d)
FSO4,input R1 Mass rate of sulfate entering reactor R1 (mg S/d)
FSO4,output R1 Mass rate of sulfate leaving reactor R1 (mg S/d)
FSO4 reduc Mass rate of sulfate reduced (mg S/d)
FXeff Mass rate of particulate COD in the effluent (mg COD/d)
FXWAS Mass rate of particulate COD in sludge wastage (mg COD/d)
fva,aa Fraction of valerate from amino acids in the ADM1
fac,aa Fraction of acetate from amino acids in the ADM1
fac,su Fraction of acetate from sugars in the ADM1
fbu,aa Fraction of butyrate from amino acids in the ADM1
fbu,su Fraction of butyrate from sugars in the ADM1
fH2,aa Fraction of H2 from amino acids in the ADM1
fH2,su Fraction of H2 from sugars in the ADM1
fpro,aa Fraction of propionate from amino acids in the ADM1
fpro,su Fraction of propionate from sugars in the ADM1
fP Organic phosphorus-to-VSS ratio in the sludge wastage (mg P/mg VSS)
fVT VSS-to-TSS ratio (mg VSS/mg TSS)
fCV Particulate COD-to-VSS ratio (mg COD/mg VSS)
GC Gas chromatography
HA Henry’s law constant of compound A (at.L. mol-1)
HFM Hollow fiber membrane HRT Hydraulic retention time (h)
JA Volumetric mass transfer rate of compound A (mol.L-1.h-1)
JHB Johannesburg process
kLaused Oxygen mass transfer coefficient in the mixed liquor (h-1)
KHP Potassium hydrogen phthalate LCFA Long chain fatty acids
MBR Membrane bioreactor
MUCT Modified UCT process
MWW Municipal wastewater
N Nitrogen
NADH Reduced nicotinamide-adenine dinucleotide NBS New Brunswick Scientific
NNO3,eff Effluent nitrate concentration (mg N/L)
NNO3,WAS Sludge wastage nitrate concentration (mg N/L)
NNO3,R1 Nitrate concentration in the reactor R1 (mg N/L)
NNO3,R2 Nitrate concentration in the reactor R2 (mg N/L)
NNO2,eff Effluent nitrite concentration (mg N/L)
NNO2,WAS Sludge wastage nitrite concentration (mg N/L)
NTKN,inf Influent TKN concentration (mg N/L)
NTKN,eff Effluent TKN concentration (mg N/L)
NTKN,WAS Sludge wastage TKN concentration (mg N/L)
o-PO4 Orthophosphate (mg P/L)
OTE Oxygen transfer efficiency (%)
OURB Biomass oxygen uptake rate (mg O2.L-1.h-1)
OURmeas Measured oxygen uptake rate (mg O2.L-1.h-1)
OX Aerobic P Phosphorus
PTP,eff Effluent TP concentration (mg P/L)
PTP,inf Influent TP concentration (mg P/L)
PTP,WAS Sludge wastage TP concentration (mg P/L)
PAO Phosphate accumulating organisms PHA Polyhydroxyalkanoates PHB Polyhydroxybutyrate
Phoredox Phosphorus reduction-oxidation process PHV Polyhydroxyvalerate
PP Polyphosphate
Pres Pressure (mmHg)
pA,gas Partial pressure of compound A in the bulk gas (atm)
pA,i Partial pressure of compound A at the liquid-gas interface (atm)
Qair Influent air flow rate (L/min)
Qeff Effluent flow rate (L/d)
Qinf Influent flow rate (L/d)
Qr Recycle flow rate (L/d)
QWAS Sludge wastage flow rate (L/d)
R1 Reactor # 1
R2 Reactor # 2
RAS Return activated sludge
RPC Research and production council
rpm Revolutions per minute
SBR Sequencing batch reactor
SO4,eff Effluent sulfate concentration (mg S/L)
SO4,inf Influent sulfate concentration (mg S/L)
SO4,R1 Sulfate concentration in the reactor R1 (mg S/L)
SO4,R2 Sulfate concentration in the reactor R2 (mg S/L)
SRO Sulfate reducing organisms SRT Sludge retention time (d)
Saa Amino acids concentration in the ADM1
Sac Acetate concentration in the ADM1
SB Soluble readily biodegradable substrate
Sbu Butyrate concentration in the ADM1
SCH4 Methane concentration in the ADM1
Seff Effluent soluble COD concentration (mg COD/L)
Sfa Long chain fatty acids concentration in the ADM1
Spro Propionate concentration in the ADM1
Ssu Monosaccharide concentration in the ADM1
ST,inf Influent total COD concentration (mg COD/L)
ST,r Total COD concentration in the recycle stream (mg COD/L)
ST,R1 Total COD concentration in the reactor R1 (mg COD/L)
ST,WAS Sludge wastage total COD concentration (mg COD/L)
SU Soluble unbiodegradable organics
Sva Valerate concentration in the ADM1
SWAS Soluble COD concentration in sludge wastage (mg COD/L)
T Temperature (oC)
ThOD Theoretical oxygen demand (mg O2/L)
TKNinf Influent total Kjeldahl nitrogen (mg N/L)
TN Total nitrogen (mg N/L) TP Total phosphorus (mg P/L)
TSS Total suspended solids (mg TSS/L) UCT University of Cape Town process
VCs Volatile compounds
VFAs Volatile fatty acids
VIP Virginia initiative plant process
VR Reactor volume (L)
VSS Volatile suspended solids (mg VSS/L)
vvm Gas flow per unit of liquid volume per minute (L.L-1.min-1)
WAS Waste activated sludge
WRRF Water resource recovery facility wO2 Oxygen mass fraction in air (%g/g)
XB Slowly biodegradable substrate
XC Composite concentration in the ADM1
Xch Carbohydrates concentration in the ADM1
Xeff Effluent particulate COD concentration (mg COD/L)
XH Active heterotrophic biomass
Xli Lipids concentration in the ADM1
Xpr Proteins concentration in the ADM1
XU Particulate unbiodegradable organics
XWAS Particulate COD concentration in sludge wastage (mg COD/L)
Yaa Yield of amino acids uptake in the ADM1
Yac Yield of acetate uptake in the ADM1
Ybu Yield of butyrate uptake in the ADM1
Yfa Yield of LCFAs uptake in the ADM1
YH2 Yield of H2 uptake in the ADM1
YOBS Observed yield coefficient (gCOD/g COD or g VSS/g COD)
Ypro Yield of propionate uptake in the ADM1
Ysu Yield of sugars uptake in the ADM1
Yva Yield of valerate uptake in the ADM1
α kLa correction factor
β DOsat correction factor
LIST OF APPENDICES
Appendix A – Time schedule for phases studied ... 124 Appendix B – Experimental data for phases # 1, 2, 3A and 3B ... 128 Appendix C – List of reactions and equations ... 160
CHAPTER 1
INTRODUCTION
1.1 Introduction
Enhanced biological phosphorus removal (EBPR) process is a modification of the activated sludge process in which activated sludge biomass is subjected to an alternating anaerobic (AN)-aerobic (OX) condition. An AN condition is one in which neither dissolved oxygen (DO) nor nitrite (NO2-)/nitrate (NO3-) are present while DO is present as an electron
acceptor in the OX one. EBPR process is preferred over the chemical phosphorus removal processes in which the excess sludge enriched with the chemical precipitates leading to extra costs for the sludge treatment.
The efficiency of an EBPR process is linked to the growth of polyphosphate accumulating organisms (PAOs) that can uptake volatile fatty acids (VFAs) (present in the wastewater or generated through fermentation reaction) under AN condition. These organisms are capable of accumulating phosphorus in amounts greater than that typically required for the nutritional growth. Phosphorus content captured in the sludge of enhanced cultured EBPR system operated by Wentzel et al. (1989) ranged between 0.32 to 0.38 g phosphorus per g volatile suspended solids (VSS).
Research on the EBPR process became an interesting topic for environmental engineers from the moment the results of Lan et al. (1983) towards phosphorus removal in an AN-OX system revealed an indirect disappearance of chemical oxygen demand (COD) under AN conditions. Later, it was reported that the oxygen requirement in the OX reactor which was preceded by an AN reactor was approximately 30% less than that for a conventional activated sludge system (Bordacs and Tracy, 1988). These findings stimulated the thinking of researchers to pay serious attention to the COD mass balance on activated sludge systems.
Evaluation of COD mass balance on different types of activated sludge system (strictly OX and unaerated-OX conditions) operated in a range of operational parameters and wastewater characteristics conducted by Barker and Dold (1995). Their findings revealed that the OX and AX-OX systems present COD mass balances close to 100% while it ranged between about 80% (with municipal wastewater as substrate) and 90% (with acetate) for the systems incorporating AN reactors. This means that up to 20% of the daily mass of influent COD cannot be accounted
for in the sludge wastage/effluent or in the mass of COD oxidized across the system (termed COD “loss”). The authors suggested that the reason for the COD loss was the release of gaseous fermentation products from the system under OX condition.
Investigation of COD loss in laboratory and pilot plant scale EBPR systems performed by Randall et al. (1992) showed that a COD loss ranging between 0% and about 50% depending on the nature and strength of substrate. They stated that the possible mechanism explaining the COD loss while using dextrose as substrate was connected with metabolism by fermenting organisms (not PAOs). Although most of authors suggested that the observed COD loss occurring under AN condition was associated with the fermentation reactions, negligible amount of hydrogen has been reported either in the mixed liquor or in the off-gas of the AN reactor (Erdal et al., 2005; Wable and Randall, 1992; Wable and Randall; 1994).
A major consequence of COD loss in activated sludge system is a reduction in both sludge production and oxygen requirements (Barker and Dold, 1996). Since operating costs for activated sludge system is potentially connected with sludge production and oxygen requirements, understanding the mechanism and potential causes of COD loss would make it possible to design the activated sludge processes in the way leading to a decrease in operating costs.
1.2 Body of the thesis
The second chapter presents a literature review on phosphorus removal process followed by anaerobic digestion (AD) processes and gas transfer in biological systems. In addition, it provides a comprehensive overview of the findings of researchers associated with the COD and nitrogen (N) mass balances on the activated sludge systems operated under either aerated (OX) or un-aerated (AX/AN) conditions using various substrates. This chapter also presents the factors influencing the COD mass balance and the possible mechanisms contributing to the COD loss which has been under investigation by researchers for many years. The last part of Chapter 2 deals with theoretical considerations including equations needed to perform COD, nitrogen (N) and phosphorus (P) mass balances for phases of this research. The hypotheses and objectives are presented in Chapter 3.
The materials and methods chapter (Chapter 4) specifies the composition of the synthetic wastewater used, experimental equipments, configuration and system operation. It is then followed by the measurement techniques for determination of the parameters required.
Results and discussion are given in Chapter 5 which is followed by Chapter 6 presenting the conclusions and recommendations.
A time schedule describing when operation of each phase started and when the mass balances performed provided in Appendix A. The Appendix B presents the data set and detailed calculations of COD, N and P mass balances. The list of equations/reactions is given in Appendix C.
CHAPTER 2
LITERATURE REVIEW
2.1 Phosphorus removal process
Phosphorus (P) is a common nutrient in wastewater and should be eliminated or diminished prior to discharge to water bodies, especially freshwater ones, because of eutrophication problems. It is non-volatile and cannot be removed from the wastewater through transferring to the gaseous phase. Therefore, it should be initially converted to a particulate form (Cheremisinoff, 1994). The first strategies were established based on the addition of the chemical coagulants such as lime, alum or ferric chloride. This method (termed chemical phosphorus removal), can remove up to 95% of phosphorus but it suffers the two main disadvantages of high costs of coagulants and production of large amount of sludge (Johansson, 1994; Brett, 1997). Enhanced biological phosphorus removal (EBPR) offers an alternative and more "ecological" approach.
A distinction first needs to be made between aerobic (OX), anoxic (AX) and anaerobic (AN) conditions because EBPR processes are typically configured as an AN-OX (AO) or AN-AX-OX (A2O) reactor system. The distinction between AX and AN conditions is not made by microbiologists but is made by environmental engineers.
An OX condition is one in which dissolved oxygen (DO) is present as an electron acceptor. An AX condition is one in which nitrite or nitrate (NO2- or NO3-) is present but DO is absent.
An AN condition is one in which neither DO nor NO2-/NO3- are present. AN condition favor
the activity of EBPR, sulfate reducing, fermenting and methanogenic organisms.
An AN reactor may exhibit mainly AN condition activities but may also have some AX/OX condition activities due to influent or sludge recirculation adding some DO or oxidized nitrogen. Such varied conditions may take place in the bulk liquid or inside biological flocs or granules. 2.1.1 Enhanced Biological Phosphorus Removal (EBPR)
EBPR activities were first reported by Srinath et al. (1959). They observed that the sludge taken from OX reactor contained an excessive amount of phosphorus which was higher than for nutritional requirements. This process later was called the EBPR process. Experimental observations from full scale water resource recovery facilities (WRRFs) and batch tests showed phosphorus release under AN and uptake under OX conditions (Levin and Shapiro, 1965). They
also suggested that phosphorus uptake was distinctly a biological process because in the presence of inhibitors such as 2,4-dichlorophenoxyacetic acid (a pH greater than 9), phosphorus was not taken up. It was proposed that one of the necessary requirements was the presence of an AN reactor in which the return sludge and wastewater are fed (Barnard, 1974; 1975 and Nicholls, 1975). On the basis of this proposition, various configurations for EBPR process have been experimentally examined and implemented in WRRFs around the world. An initial study regarding the direct relation between phosphorus release and uptake was done by Rensink (1981) and then biochemical models were developed (Comeau et al., 1986; Wentzel et al., 1986; Mino et al., 1987).
In the AN reactor, volatile fatty acids (VFAs) are taken up by phosphate accumulating organisms (PAOs) in the form of polyhydroxyalkanoates (PHAs) resulting in phosphorus release in the bulk liquid. Then, in the OX reactor, PAOs utilize the accumulated PHAs for growth and to store phosphate as polyphosphates intracellularly. Since phosphorus uptake rate in OX reactor is greater than the release in the AN reactor, phosphorus is removed from the system through the sludge wastage (Mino et al., 1998; Yang et al., 2013; Oehmen et al., 2007; Kristiansen et al., 2013; Muszynski et al., 2013). A schematic diagram of the metabolic process taking place in AN and OX/AX conditions by PAOs is illustrated in Figure 2.1.
Figure 2-1: Metabolic processes occurring in AN and OX/AX conditions by PAOs (adapted from Yuan et al., 2012).
Note: VFAs: volatile fatty acids; NADH2: reduced nicotinamide-adenine dinucleotide; ATP: adenosine triphosphate; PP: polyphosphate.
2.1.2 EBPR process configurations
A simple configuration for an EBPR process is composed of two reactors in series followed by a final clarifier. The first reactor is operated under AN condition and the second one is an OX reactor. The activated sludge from the final clarifier is returned to the AN reactor (termed AO system, Figure 2.2).
Figure 2-2: EBPR process (AO system) (adapted from van Haandel and van de Lubbe, 2007). Note: RAS: return activated sludge
Since nitrification takes place in the OX reactor, introduction of NO3- in the AN reactor is
unavoidable. Consequently, phosphorus removal efficiency is negatively affected because the availability of readily biodegradable matter for PAOs growth is reduced.
Various configurations for biological phosphorus removal have been developed in order to minimize the introduction of NO3- in AN reactor (Figure 2.3). A review of the different
configurations (such as phosphorus reduction oxidation (Phoredox), Barnard-denitrification-phosphorus (Bardenpho), PhoStrip, Johannesburg (JHB), Virginia initiative plant (VIP), University of Cape Town (UCT), modified UCT (MUCT), etc.) can be found in Comeau (1990). In this study, an AO system for biological phosphorus removal was used. Since OX reactor was a membrane bioreactor (MBR), no final clarifier was used and activated sludge recirculated from the OX to the AN one.
2.1.3 Sludge phosphorus content
Sludge phosphorus content in activated sludge processes is ranged typically between 0.015 and 0.020 g P per g volatile suspended solids (VSS) (Cretu and Tobolcea, 2005). A number of experimental observations showed that the sludge phosphorus content varies between 0.08 and 0.20 g P per g VSS depending on the type of carbon source, influent chemical oxygen demand (COD) to total phosphorus (TP) ratio and the operation conditions (Appeldoorn et al., 1992; Mino et al., 1998; Wang et al., 2002b). The sludge of enhanced cultured EBPR systems operated by Wentzel et al. (1989), however, contained as much as 0.32 to 0.38 g P per g VSS. A value of 0.38 g P per g VSS for the aerobic sludge of enhanced sequencing batch reactor (SBR) system was also reported by Copp (1998).
2.2 Anaerobic digestion (AD) processes
Under AN conditions, a wide variety of microorganisms are involved in breaking down the organic matter into soluble substances and gases such as methane (CH4), carbon dioxide (CO2),
hydrogen (H2) and hydrogen sulfide (H2S) through steps that are categorized as follows.
2.2.1 Disintegration
Disintegration is a non-biological process in which the cell walls are physically or chemically broken down to release intracellular substances. The end products of this stage are carbohydrates, proteins, lipids and particulate/soluble unbiodegradable organics (Figure 2.4, stage A). The description of the symbols used in Figure 2.4 is presented in Table 2.1 (adapted from Batstone et al., 2002).
2.2.2 Hydrolysis
High molecular weight organics produced by disintegration cannot be directly utilized by microorganisms. Thus, hydrolysis (Figure 2.4, stage B) is needed to break them down into soluble compounds such as monosaccharides, amino acids and long chain fatty acids ( LCFAs) that are further processed by acidogenic bacteria (Mitchell and Gu, 2010). According to the death-regeneration concept proposed by Dold et al. (1980), heterotrophic biomass (XH) is split
into slowly biodegradable (XB) and inert (XI) substances where XB is then hydrolyzed into
2.2.3 Acidogenesis/acetogenesis
The acidogenesis process is performed by a group of microorganisms that are identified as acidogens by which monosaccharides and amino acids are converted to VFAs (such as acetate, propionate, butyrate and valerate) and H2. Since VFAs, except acetate, cannot be utilized by
methanogenic bacteria, acetogenesis is the next stage to transform the VFAs to acetate (Figure 2.4, stage C/D) (Stams, 1994; Schink, 2002). H2 production in AD processes results from both
Figure 2-4: Anaerobic conversion of complex organic matter (adapted from Batstone et al., 2002).
Figure 2-5: Death-regeneration concept for the activated sludge process (adapted from Dold et al., 1980)
Table 2-1: Description of symbols used in Figure 2.4 (adapted from Batstone et al., 2002)
Compound Conversion stage
Symbol Description Symbol Description
XC Composite A Disintegration
XU Particulate unbiodegradable organics B Hydrolysis
SU Soluble unbiodegradable organics C Acidogenesis
Xch Carbohydrates D Acetogenesis Xpr Proteins E Methanogenesis/Sulfidogenesis Xli Lipids Ssu Monosaccharides Saa Amino acids Sfa LCFAs Spro Propionate Sbu Butyrate Sva Valerate Sac Acetate SH2 Hydrogen SCH4 Methane SSO4 Sulfate SH2S Hydrogen sulfide
According to the AD model no. 1 (ADM1), the processes resulting in H2 production are listed in
Table 2.2 and schematically illustrated in Figure 2.6.
H2 can be generated either directly from the degradation of monosaccharides/amino
acids/LCFAs or indirectly via the degradation of VFAs produced (Figure 2.6). Since acetate is not fermented to H2, it is not shown in Figure 2.6.
The description of symbols used in Table 2.2 and Figure 2.6 are presented in Table 2.3 which also presents the values suggested for stoichiometric coefficients of components generated through H2 production using different types of substrate.
Table 2-2: ADM1 matrix (only processes resulting in H2 production presented; adapted from Batstone et al., 2002) S su Saa Sfa Sva Sbu Spro Sac SH2 ↓ (g COD/l) (g COD/l) (g
COD/l) (g COD/l) (g COD/l) (g COD/l) (g COD/l) (g COD/l) Monosaccharides
uptake -1 (1-Ysu) × fbu,su (1-Ysu) × fpro,su (1-Ysu) × fac,su (1-Ysu) × fH2,su Amino acids uptake -1 (1-Yaa) × fva,aa (1-Yaa) × fbu,aa (1-Yaa) × fpro,aa (1-Yaa) × fac,aa (1-Yaa) × fH2,aa
LCFAs uptake -1 0.70 × (1-Yfa) 0.30 × (1-Yfa)
Valerate uptake -1 0.54 × (1-Yva) 0.31 × (1-Yva) 0.15 × (1-Yva)
Butyrate uptake -1 0.80 × (1-Ybu) 0.20 × (1-Ybu)
Propionate uptake -1 0.57 × (1-Ypro) 0.43 × (1-Ypro) Si : concentration of soluble compound (i);
su:Monosaccharides; aa: Amino acids; fa: LCFAs; va: valerate; bu: butyrate; pro: propionate; ac: acetate; H2: hydrogen
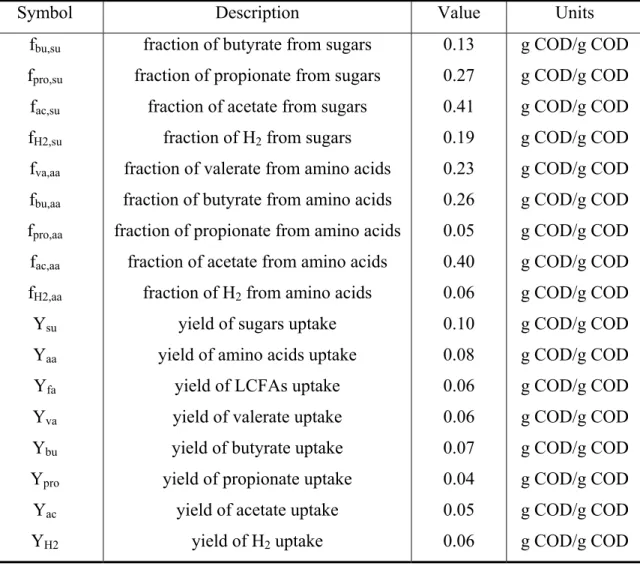
Table 2-3: Values suggested for stoichiometric coefficients of components associated with H2
production processes according to ADM1 (adapted from Batstone et al., 2002)
Symbol Description Value Units
fbu,su fraction of butyrate from sugars 0.13 g COD/g COD
fpro,su fraction of propionate from sugars 0.27 g COD/g COD
fac,su fraction of acetate from sugars 0.41 g COD/g COD
fH2,su fraction of H2 from sugars 0.19 g COD/g COD
fva,aa fraction of valerate from amino acids 0.23 g COD/g COD
fbu,aa fraction of butyrate from amino acids 0.26 g COD/g COD
fpro,aa fraction of propionate from amino acids 0.05 g COD/g COD
fac,aa fraction of acetate from amino acids 0.40 g COD/g COD
fH2,aa fraction of H2 from amino acids 0.06 g COD/g COD
Ysu yield of sugars uptake 0.10 g COD/g COD
Yaa yield of amino acids uptake 0.08 g COD/g COD
Yfa yield of LCFAs uptake 0.06 g COD/g COD
Yva yield of valerate uptake 0.06 g COD/g COD
Ybu yield of butyrate uptake 0.07 g COD/g COD
Ypro yield of propionate uptake 0.04 g COD/g COD
Yac yield of acetate uptake 0.05 g COD/g COD
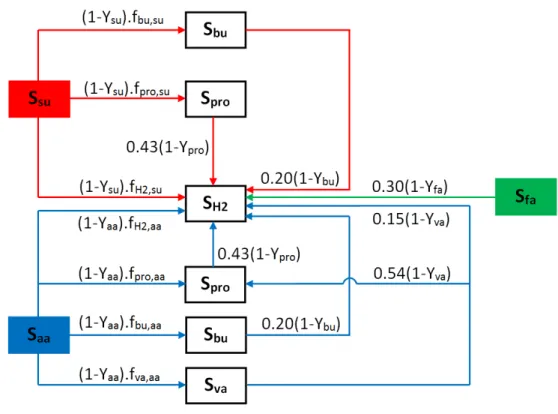
Figure 2-6: Schematic illustrating the different conversion pathways that involve in H2
production through AD processes (adapted from Batstone et al., 2002)
The following yields can be calculated from the values reported in Table 2.3 and Figure 2.6. - yield of H2 produced from 1 g COD-propionate = 0.43 × (1-Ypro) = 0.41 g COD-H2
- yield of H2 produced from 1 g COD-butyrate = 0.20 × (1-Ybu) = 0.19 g COD-H2
- yield of H2 produced from 1 g COD-valerate = 0.15 × (1-Yva) + 0.54 × (1-Yva) × 0.43 × (1-Ypro)
= 0.35 g COD-H2
- yield of H2 produced from 1 g COD-amino acids = (1-Yaa) × fH2,aa + (1-Yaa) × fva,aa × 0.15 ×
(1-Yva) + (1-Yaa) × fbu,aa × 0.20 × (1-Ybu) + ((1-Yaa) × fpro,aa +(1-Yaa) × fva,aa × 0.54 × (1-Yva)) × 0.43
× (1-Ypro) = 0.19 g H2-COD
- yield of H2 produced from 1 g COD-sugars = (1-Ysu) × fH2,su + (1-Ysu) × fbu,su × 0.20 × (1-Ybu) +
- yield of H2 produced from 1 g COD-LCFA = 0.30 × (1-Yfa) = 0.28 g COD-H2
2.2.4 Methanogenesis
Methanogenesis in the last stage of the AD processes (Figure 2.4, stage E). Methanogens are anaerobic microorganisms consuming acetate and H2 produced through acidogenesis and
acetogenesis, respectively, and converting them to CH4. About 70% of the CH4 produced comes
from the acetoclastic process and the rest from the hydrogenotrophic process (using H2 and CO2)
(Batstone et al., 2002). 2.2.5 Sulfate reduction
Sulfate (SO42-) is present in domestic wastewater at an average concentration of
10 mg SO42--S/L (Tchobanoglous et al., 2003) but industries that use sulfuric acid in their
processes can increase this concentration in municipal wastewaters (MWW) to 100 mg SO42--S/L (Singh and Viraraghavan, 1998). Sulfate removal from wastewater can be
achieved by precipitation with barium salts, for example, but the most common and economical method is by sulfate reduction. Sulfate reducing organisms (SRO) utilize SO42- as electron
acceptor and generate sulfide. The electrons needed for SO42- reduction are provided from an
organic substrate such as acetate and H2 (Figure 2.4, stage E).
2.2.5.1 Fate of reduced sulfur produced by SRO
The reduced sulfur forms in a SO42- reducing process are hydrogen sulfide (H2S), bisulfide (HS-)
and sulfide ion (S2-). H2S dissociates into HS- and S2- according to the equilibrium reactions (2.1)
and (2.2) (Chen, 1970).
H S ↔ H HS pKa1 6.97 to 7.06 at 25°C (2.1)
HS ↔ H S pKa2 12.35 to 15.0 at 25°C (2.2)
The dominance of sulfide species in solution containing sulfide depends on the pH. For example, at a pH value of 7.4, 28% of total sulfide is in the H2S form and the portion remaining (72%) is
as HS- with less than 0.001% being as S2- (Li and Lancaster, 2013).
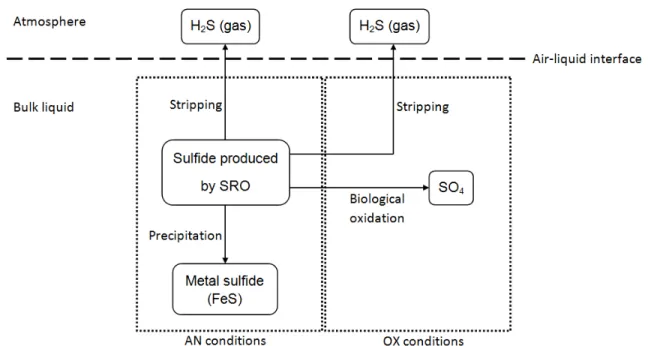
The produced sulfide is subjected to reactions of precipitation, emission and re-oxidation as schematically illustrated in Figure 2.7.
Sulfide precipitation by metal salts
The dissolved sulfide can react with metal salts such as ferrous ion (Fe2+) to form a ferrous sulfide (FeS) precipitate according to reaction (2.3). This reaction is used as a strategy to prevent the emission of H2S in sewer systems (Nielsen et al., 2008) and in anaerobic digesters.
Fe HS → FeS ↓ H (2.3)
Sulfide emission/oxidation
H2S may be stripped from the liquid into the gas phase due to mechanical mixing and aeration.
Sulfide can be re-oxidised to SO42- by aeration.
Figure 2-7: Schematic illustration of the fate of sulfide produced by SRO (adapted from Zhang et al., 2008)
2.3 Gas transfer in biological processes
Mass transfer is the net movement of molecules from one phase to another according to a concentration gradient. In a gas-liquid system, gas molecules can cross the interface until
equilibrium conditions are attained which is when the rate of transfer of gas molecules from the gas to liquid phase equals to that from the liquid to gas phase (Figure 2.8).
Figure 2-8: Schematic representation of the movement of gas molecules in a liquid-gas system with (A) unsaturated liquid phase and (B) saturated liquid phase (adapted from von Sperling,
2007)
Oxygen transfer into solution by aeration represents a significant part of the operating costs of WRRFs, notably due to the limited capacity of water to dissolve oxygen. Conversely, in an anaerobic digester, degassing of volatile compounds (VCs), such as CH4, CO2 and H2S, is a
central part of the process.
A schematic diagram illustrating the profile of concentrations for transfer from the liquid to gas phase assuming that the rate of mass transfer is controlled by the resistance of the liquid film shown in Figure 2.9. In this case, the transfer of gas molecules from liquid to gas phase is a three-step process. The first step is the transport of gas molecules from the bulk liquid to the liquid-film and then crossing the liquid film to arrive at the liquid-gas interface. The third step involves the transfer from the liquid-gas interface to the bulk gas. The KLa represented in Figure
2.9 is the overall liquid mass transfer coefficient which depends on parameters such as agitation at the liquid-gas interface, temperature, nature of gas, liquid viscosity (Treybal, 1980). Similar reactions can take place to a lower extent, in the AN zone of an activated sludge process.
Figure 2-9: Conceptual representation of liquid-gas mass transfer steps in an AN reactor assuming the transfer rate is controlled by the liquid-film resistance (adapted from Kraemer and
Bagley, 2007; Beckers et al., 2015).
Note: subscripts ‘i’ and ‘diss’ refer to ‘liq-gas interface’ and ‘dissolved’, respectively.
The volumetric mass transfer rate of a compound (A) can be calculated as the product of the volumetric mass transfer coefficient and the driving force of the concentration in the bulk liquid as shown in Equation (2.4) (Treybal, 1980).
J k a C , C , K a C , C∗ (2.4)
J K a C , , (2.5) where,
J : volumetric mass transfer rate of compound A (mol l-1 h-1) k a : liquid-film mass transfer coefficient of compound A (h-1)
K a : overall mass transfer coefficient of compound A based on liquid phase concentration (h-1) CA,liquid: concentration of compound A in the bulk liquid (mol/L)
CA*: concentration of compound A in the bulk liquid in equilibrium with that in the bulk gas
phase (mol/l)
CA,i: concentration of compound A at the liquid-gas interface (mol/L)
pA,gas: partial pressure of compound A in the bulk gas (atm)
HA: Henry’s constant of compound A (at. l/mol)
The KLa value for VCs, for example H2, is given by Equation (2.6) (Beckers et al., 2015).
K a K a . (2.6)
where,
DH2: H2 diffusivity coefficient in the liquid phase (cm2/s)
DO2: O2 diffusivity coefficient in the liquid phase (cm2/s)
K a : overall liquid mass transfer coefficient of H2 (h-1)
K a : overall liquid mass transfer coefficient of O2 (h-1)
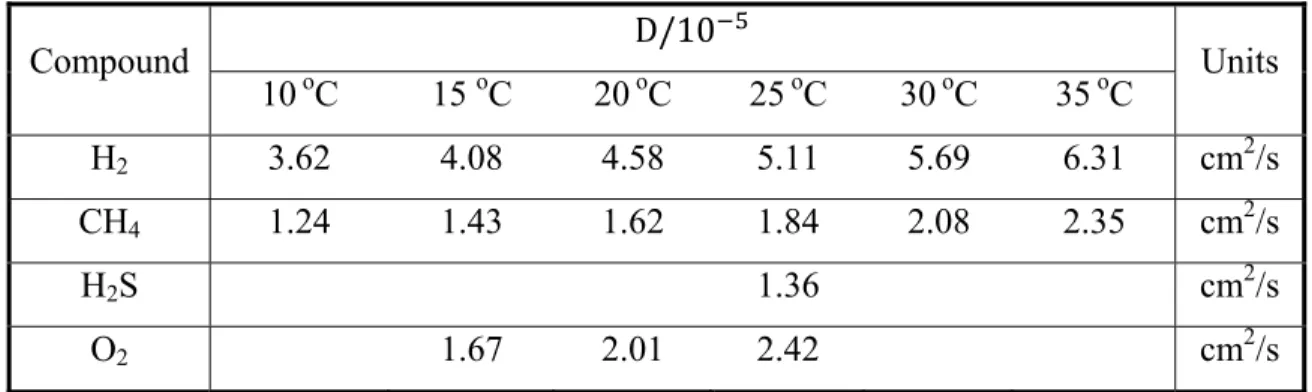
The diffusivity coefficients (D) and Henry’s law constants (H) for H2, CH4 and H2S are listed in
Table 2-4: Diffusivity coefficient (D) of some VCs in water (adapted from Lide, 2003) Compound D/10 Units 10 oC 15 oC 20oC 25oC 30oC 35 oC H2 3.62 4.08 4.58 5.11 5.69 6.31 cm2/s CH4 1.24 1.43 1.62 1.84 2.08 2.35 cm2/s H2S 1.36 cm2/s O2 1.67 2.01 2.42 cm2/s
Table 2-5: Henry’s law constant (H) of some VCs in water (calculated from Coker, 2007)
Compound H 10 Units 10 oC 15 oC 20oC 25oC 30oC 35 oC H2 63.4 66.2 68.7 70.8 72.6 74.1 atm CH4 28.5 32.1 35.7 39.2 42.7 46.0 atm H2S 0.38 0.43 0.48 0.54 0.60 0.67 atm O2 32.6 36.3 40.0 43.6 47.1 50.5 atm
2.3.1 VCs stripping by diffused aeration in an OX reactor
Stripping is generally defined as the removal of VCs from a liquid medium. It can be done by applying mechanical agitation or/and introducing a sparging gas through the liquid. In a biological wastewater treatment process, air is pumped into subsurface bubble diffusers or introduced by mixing using surface aerators to provide oxygen required for microorganisms metabolism. If an OX zone is preceded by an AN one, a portion of VCs produced by anaerobic processes may be transferred to the OX zone and then stripped due to agitation and aeration. The stripping rate of a VC in an OX zone is influenced by the following factors (Bielefeldt and Stensel, 1999).
1) Aeration flux
2) Turbulence created using mechanical agitation (speed of mixing) 3) pH (in the case of H2S) and temperature
4) Liquid depth
5) Overall mass transfer coefficient of the VC
6) Henry’s law constant and diffusivity of the VC in liquid
The fraction of a VC that can be stripped in a diffused aeration completely mixed reactor is given by Equation (2.7) (Bielefeldt and Stensel, 1999).
Fraction of VC stripped 1 1 1 exp . . (2.7)
where,
Qair: diffused air flow rate (m3/h)
Ql: flow rate of liquid stream containing VC (m3/h)
H: Henry’s constant of VC (unitless)
KLaVC: overall mass transfer coefficient of VC (h-1)
h: liquid depth (m)
A: reactor surface area (m2) 2.4 COD mass balance
In WRRFs, the degree of organic matter pollution can be reported in COD units. Validation of observed data obtained from a wastewater treatment process can be achieved by conducting a COD mass balance.
The general form of COD mass balance in an activated sludge system under steady state conditions (accumulation term is zero) is the daily mass of COD entering the system must either
leave or oxidized within the system. The following data set is needed to perform a COD mass
balance for a continuous flow system under steady state conditions: influent, effluent, sludge wastage and recycle flow rates
reactors volume
total COD concentration of the influent, effluent and sludge wastage as well as the mass of COD oxidized across the system
concentration of NO3- and NO2- in the influent and in each reactor
DO concentration in the streams entering the system DO concentration in the OX reactors
temperature and correction factors of alpha (α) and beta (β) and SO42- concentration in the influent and effluent of each reactor.
2.4.1 Reported COD and N mass balances OX systems
It has been reported that COD and N mass balances for OX systems are close to 100%. A summary of the COD and N mass balance results for the laboratory scale OX systems (Schroeter et al., 1982; McClintock et al., 1988) are described below.
Schroeter et al. (1982) system:
Eight laboratory scale systems under fully OX conditions using domestic wastewater as influent with a COD concentration of about 500 mg COD/L were carried out. They varied the SRT from 3 to 20 days at temperatures of 12 and 20 oC. The COD and N mass balances performed on those results by Barker and Dold (1995) indicated that COD and N mass balances were close to 100%, averaging 99.7 for COD and 99.6% for N, respectively (Table 2.6).
Table 2-6: COD and N mass balance results in OX system (data from Schroeter et al., 1982)
System Type Substrate SRT (day)
COD mass balance (%)
N mass balance (%) 12oC 20oC 12oC 20oC
OX Lab-scale Domestic wastewater (500 mg COD/L)
3 99.6 100.4 100.2 100.5 3 99.7 100.2 100.2 99.5 8 99.6 99.9 100.2 97.5 20 99.4 98.4 99.2 99.4
Note: reported in Barker and Dold (1995).
McClintock et al. (1988) systems: Five parallel laboratory scale single OX systems at different SRTs of 1.5, 3, 6, 10 and 15.2 days using bactopeptone as substrate were conducted. Using these results, an average N mass balance of 101.2% was calculated by Barker and Dold (1995). The COD mass balance has not been reported due to lack of OUR data.
Arkley and Marais (1981) systems: Barker and Dold (1995) also examined the COD and N mass balances of those systems. Operational data, COD and N mass balance results are listed in Table 2.7.
Table 2-7: COD and N mass balance results of Arkley and Marais (1981) systems (calculated by Barker and Dold, 1995)
System Type Substrate SRT (day)
COD mass balance (%) N mass balance (%) avg std avg std OX Lab-scale MWW 20 94.2 1.6 97.3 3.4 OX-OX Lab-scale MWW 20 96.6 1.4 101.6 1
AX, AX-OX and OX-AX systems
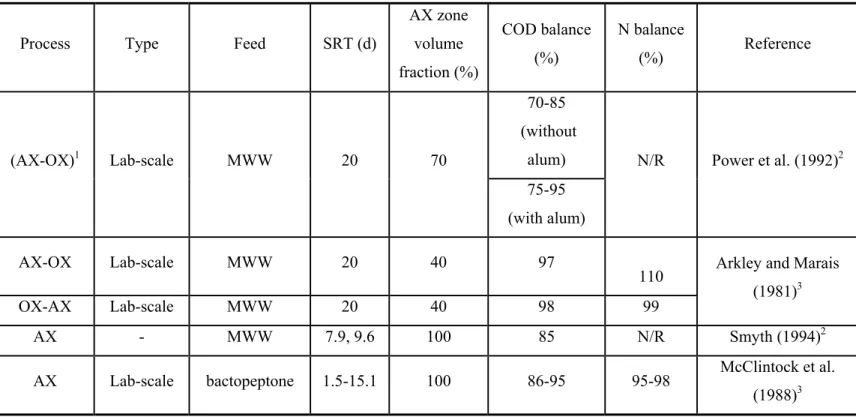
COD and N mass balance results for AX, AX-OX and OX-AX systems exhibited a significant variation in the COD mass balance from 70 to 95% while N mass balance ranged between 95 and 99% (Barker and Dold, 1995).
COD and N mass balance results of Smyth (1994), Power et al. (1992), McClintock et al. (1988) and Arkley and Marais (1981) systems are presented in Table 2.8. Excess NO3- was supplied to
ensure the un-aerated reactor was under AX conditions. For example, NO3- concentration in the
Table 2-8: Summary of COD and N mass balance results in AX-OX, OX-AX and AX systems
Process Type Feed SRT (d)
AX zone volume fraction (%) COD balance (%) N balance (%) Reference (AX-OX)1 Lab-scale MWW 20 70 70-85 (without
alum) N/R Power et al. (1992)2
75-95 (with alum)
AX-OX Lab-scale MWW 20 40 97
110 Arkley and Marais
(1981)3
OX-AX Lab-scale MWW 20 40 98 99
AX - MWW 7.9, 9.6 100 85 N/R Smyth (1994)2
AX Lab-scale bactopeptone 1.5-15.1 100 86-95 95-98 McClintock et al.
(1988)3 Note:
1 AX-OX operated to study chemical phosphorus removal using alum 2 Referenced studies in Copp (1998)
3 Referenced studies in Barker and Dold (1995)