TH `ESE
TH `ESE
En vue de l’obtention du
DOCTORAT DE L’UNIVERSIT´E DE TOULOUSE
D´elivr´e par : l’Universit´e Toulouse 3 Paul Sabatier (UT3 Paul Sabatier)
Pr´esent´ee et soutenue le 13/11/2014 par :
Sandra Gurwinder Sivia
Simulations and parameterisation of volcanic plumes observed in La R´eunion Island, Piton de la Fournaise
JURY
Frank Roux Pr´esident du Jury
Peter Bechtold Rapporteur
Fr´ed´eric Hourdin Rapporteur
Edouard Kaminski Rapporteur
Andrea DiMuro Examinateur
C´eline Mari Directrice de th`ese
Franc¸ois Gheusi Co-Directeur de th`ese
´Ecole doctorale et sp´ecialit´e :
SDU2E : Oc´ean, Atmosph`ere et Surfaces Continentales
Unit´e de Recherche :
Laboratoire d’A´erologie (UMR 5560)
Directeur(s) de Th`ese :
Fran¸cois Gheusi et C´eline Mari
Rapporteurs :
Acknowledgements
Firstly, I want to thank both my supervisors, C´eline Mari and Fran¸cois Gheusi. Thank you very much for supporting me and guiding me during my research. Thank you for being very patient and always receiving me with a smile! Your support, feedback, corrections, motivation and teacher-like approach are invaluable. I also thank Pierre Tulet and Andrea DiMuro for the opportunity to visit this famous Island. Thank you for always re-plying to my Emails even if the questions I asked were sometimes repetitive.
I would also like to thank Juan Escobar and Didier Gazen, always available to answer my many questions with patience and kindness. A big thank you to Soline Bielli for helping me with the complexities of NCL even when you moved far far away! I thank Frank Roux and everyone at Laboratoire dA´erologie for welcoming me so warmly. Thank you very much to the jury members for agreeing to delve into my manuscript and for taking their time to provide very useful insight and comments on work undertaken during this PhD.
Flore Tocquer and Alexandre Berger, merci beaucoup for listening me moan when ’my’ Meso-NH was not ’working’. Flore, I can not thank you enough for always remaining positive (well, for the most of it) and it was an im-mense pleasure to share the office with you, I wouldn’t have it any other way ;) !
To say some final words, I want to thank my family. My parents and my sisters for helping their always ’broke’ elder daughter/sister, for all your love and for feeling proud of all my achievements thus far! My ’in-laws’
keeping me company during my sleepless nights. And of course, thank you Fabrice Andrzejczak for supporting me from the last 13 odd years! A super thanks (especially) for the last 5 months when you continuously cooked and cleaned so that I could complete this manuscript :) .
Contents
Introduction en fran¸cais 1
Introduction 7
1 Volcanic eruptions in the Earth’s system 13
1.1 Types of volcanoes: Volcanic eruption variability . . . 14
1.2 What controls eruption styles? . . . 17
1.2.1 Magma composition . . . 17
1.2.1.1 Volcanic rocks - mineral composition . . . 18
1.2.1.2 Volcanic rocks - magma cooling rate . . . 20
1.2.1.3 Volcanic rocks - classifications . . . 21
1.2.2 Magma viscosity, temperature and gas content . . . 22
1.2.3 Controls on explosivity . . . 22
1.3 General volcanic eruption dynamics . . . 23
1.3.1 Magma column . . . 23
1.3.2 Eruption column . . . 26
1.4 Man and volcanism . . . 29
1.4.1 Vesuvius eruption and Pompeii . . . 29
1.4.2 Laki eruption, Iceland . . . 29
1.4.3 Eruption of Mount Tambora . . . 30
1.4.4 Pinatubo eruption . . . 31
1.4.5 Soufriere Hills, Montserrat . . . 32
1.4.6 Eyjafjallajokull, Iceland . . . 32
2 Volcanic eruption impacts and consequences to models 35
2.1 Volcanism and atmospheric chemistry . . . 36
2.1.1 Volcanic eruptions as a climate forcing agent . . . 38
2.1.1.1 Influence on temperature . . . 40
2.1.1.2 Influence on water cycle . . . 41
2.1.2 A focus on the tropospheric sulphur cycle . . . 42
2.1.3 Volcanic eruptions and air pollution . . . 43
2.1.3.1 SO2 fluxes and measuring tools . . . 46
2.1.3.2 Volcanic smog, Laze and Acid rain . . . 48
2.1.3.3 The particular case of Piton de la Fournaise . . . 49
2.2 Volcanic columns and ash cloud: models and challenges . . . 52
2.2.1 Atmospheric dispersal processes: high energy plume models . . . 53
2.2.2 Buoyant volcanic column and proximal dynamics: buoyant col-umn and dispersal models . . . 54
2.2.3 Ash dispersal at regional, continental and global scale . . . 55
2.2.4 Overview . . . 57
2.3 On the importance of plume heights . . . 59
2.4 Thesis objectives . . . 60
3 1D idealised simulation and parameterisation of January 2010 PdF eruption 63 3.1 The atmospheric model . . . 64
3.1.1 Parametrisations for shallow convection . . . 65
3.1.1.1 Parameterised turbulent ED terms . . . 66
3.1.1.2 The Mass-Flux (MF) scheme . . . 67
3.1.2 Entrainment through turbulent mixing . . . 71
3.2 Abstract of the research article . . . 72
3.3 Introduction . . . 72
3.4 Volcanic plume parameterisation and model configurations . . . 75
3.4.1 January 2010 summit eruption of Piton de la Fournaise . . . 75
3.4.2 Description of the volcanic plume parameterisation . . . 76
3.4.2.1 Sub-grid cloud parameterisation as per Pergaud et al. (2009) . . . 77
CONTENTS
3.4.2.2 Modified EDMF - updraft initialisation . . . 80
3.4.2.3 Modified EDMF – basal lateral mass exchange . . . 81
3.4.3 Simulation set-up and configuration . . . 83
3.4.3.1 Common features to all simulations . . . 84
3.4.3.2 3-D spin-up simulation to generate background profiles 84 3.4.3.3 LES simulations . . . 86
3.4.3.4 SCM simulations . . . 87
3.5 Results and analysis . . . 88
3.5.1 Demonstration of the need of specific heat source to generate deep plumes . . . 88
3.5.2 Influence of entrainment/detrainment at the base of the updraft 90 3.6 Supporting analysis to the research article . . . 96
3.7 Conclusions . . . 100
3.8 Appendix . . . 102
3.8.1 Volcanic mass and energy sources in the LES expressed as surface fluxes . . . 102
3.8.1.1 Mass fluxes (H2O and SO2) . . . 102
3.8.1.2 Sensible heat flux . . . 102
4 First 3D application of Modified EDMF parameterisation 107 4.1 Strategy . . . 107
4.2 Configuration of the 3D simulations . . . 108
4.3 Results and analysis . . . 110
4.3.1 Volcanic plume representation . . . 110
4.3.2 SO2 measurements by ORA . . . 113
4.3.3 Volcanic plume transport . . . 118
4.4 Downwind chemistry . . . 121
4.5 Conclusion . . . 122
General conclusions and perspectives 124
Conclusions g´en´erale en fran¸cais 131
List of Tables 139
Introduction en fran¸cais
Les ´eruptions volcaniques sont des ph´enom`enes complexes qui lient ´etroitement: • la dynamique du transfert et le stockage du magma dans la croˆute sup´erieure, • le d´eclenchement de l’activit´e volcanique,
• les processus de transport de magma et leur interaction avec l’´edifice volcanique, • la dynamique et le budget des ´eruptions (magma et de gaz),
• le transport atmosph´erique et
• l’impact des gaz et les a´erosols volcaniques.
L’activit´e volcanique a de nombreuses caract´eristiques en commun avec d’autres catastrophes naturelles, comme des conditions m´et´eorologiques extrˆemes, tremblements de terre, glissements de terrain et en particulier les incendies de forˆet (un risque na-turel tr`es similaire aux volcans). Les risques nana-turels sont typiquement complexes et impliquent de nombreux param`etres et processus. Certains des processus de contrˆole sont fortement non-lin´eaires, de sorte que dans certaines circonstances, des change-ments brusques de comportement peuvent se produire, tels que la transition soudaine d’une ´eruption effusive `a une ´eruption explosive.
Sur terre, on compte approximativement 550 volcans en activit´e, `a proximit´e desquels au moins 500 millions de personnes vivent expos´ees `a un danger potentiel. Parmi les principaux dangers et inconv´enients associ´es aux ´emissions volcaniques, on peut citer leur impact sur le trafic a´erien, la qualit´e de lair et le climat, du fait des ´emissions de gaz volcaniques et da´erosols. Les ´eruptions volcaniques ´ejectent de nombreux gaz volatiles par example,
• la vapeur deau (H2O repr´esente 50 90 % du volume de la phase gazeuse)
• le dioxyde de carbone (CO2, 1 `a 40 % du volume)
• les esp`eces soufr´ees (2 `a 35 % du volume), dont les plus abondantes sont le dioxyde de soufre (SO2) et le sulfure dhydrog`ene (H2S), et
• relativement r´ecemment d´ecouvert le monoxyde de brome (BrO) (Bobrowski et al. (2003), entre autres).
Les ´emissions volcaniques qui atteignent la stratosph`ere, telles que le SO2 sont
principalement issues d’´eruptions explosives et ont des effets av´er´es sur le climat en contribuant `a la formation d’a´erosols de sulfate (Robock, 2000). Cependant, le sort des ´emissions troposph´eriques (de ´eruptions effusives) et leurs impacts environnemen-taux et atmosph´eriques ont ´et´e beaucoup moins ´etudi´es (Delmelle et al., 2002, Mather et al., 2003). Les ´eruptions de type effusif et leurs ´emissions sont plus fr´equentes que les rares et grandes ´eruptions. Mather et al. (2003) montre que la quantit´e de SO2
d’origine volcanique, lib´er´ee par des ´eruptions continues, est aussi importante voire sup´erieure `a celle des ´eruptions explosives sporadiques. Andres & Kasgnoc (1998) ont estim´e que l’activit´e sporadique ne contribue que’`a 1 % (en moyenne sur des ´echelles de temps longues, par exemple 1 an) au flux total de soufre troposph`erique. Le d´egazage permanent par les volcans contribue donc de fa¸con significative au bilan global du SO2. Situ´e dans la partie sud-est de l’ˆıle de la R´eunion (21 ◦S; 55,5 ◦ E), le Piton de
la Fournaise (PdF ci-dessous) est l’un des volcans les plus actifs au monde (Lenat & Bachelery, 1988) avec une moyenne d’une ´eruption tous les huit mois dans les cinquante derni`eres ann´ees (Peltier et al., 2009). En d´epit de l’importante activit´e du PdF, les ´emissions de gaz, la composition chimique, la distribution en taille et les propri´et´es optiques des a´erosols issus de l’activit´e volcanique sont peu ou pas document´ees. Au contraire, les gaz et les flux d’a´erosols ont ´et´e bien ´etudi´es et pour un certain nombre d’autres volcans tels que l’Etna et le Kilauea. En outre, l’impact radiatif et chimique des gaz volcaniques et des a´erosols sur l’atmosph`ere et les ´ecosyst`emes de la R´eunion sont totalement inconnus (Lesou¨ef, 2010).
Bien que les ´eruptions de PdF peuvent ne pas ˆetre aussi spectaculaires (sauf dans le cas de Avril 2007) que le volcan Eyjafjallajokull de l’Islande, par contre, une telle
0.0 Introduction
activit´e volcanique repr´esente l’une des sources naturelles les plus importantes de pollu-ants dans l’atmosph`ere (`a la fois pendant et entre les ´eruptions sous formes de fumerolles )(Mather et al., 2003). Parmi d’autres gaz, le dioxyde de soufre (SO2) ´emis lors de
l’activit´e volcanique est la plus pr´eoccupante. Le SO2 dans l’atmosph´ere r´eagit
chim-iquement avec la lumi`ere du soleil, l’oxyg`ene, les particules de poussi`ere et de l’eau pour former un m´elange d’a´erosols sulfat´es (d’acide sulfurique (H2SO4), et d’autres
esp`eces de soufre oxyd´e). Par exemple, Bhugwant et al. (2009) montre que pendant la majeure ´eruption d’Avril 2007 du PDF, les normes de qualit´e de l’air pour SO2
(seuil d’information: 300 µg/m3; seuil d’alerte: 500 µg/m3) ont ´et´e d´epass´es `a plusieurs
reprises dans les diff´erents stations de surveillance (y compris les parties les plus recul´ees de l’ˆıle). La concentration maximale de SO2 relev´ee pendant cet ´episode d’Avril 2007
est de 2486 µg/m3 (Viane et al., 2009). De plus, on a observ´e durant cette ´eruption
volcanique
• un smog volcanique (´egalement appel´e ’vog’) r´esultant de la r´eaction photochim-ique du SO2 avec O2 et H2O en pr´esence de radiation solaire,
• une pluie acide r´esultant de la dissolution du SO2 dans leau liquide nuageuse
(d´epˆot humide), et
• un brouillard volcanique (´egalement appel´ee ’laze’) r´esultant de l´ecoulement de lave dans loc´ean, cr´eant un dense nuage dacide chlorhydrique.
La surveillance et la pr´evision des cendres et des gaz volcaniques est essentielle en terme de s´ecurit´e a´erienne, de qualit´e de l’air et d’´etude du climat. Une question centrale `a cet objectif est la d´etermination au plus juste des altitudes atteintes par les panaches volcaniques. Cette hauteur, dite hauteur d’injection, correspond `a l’altitude `
a laquelle le panache commence `a ˆetre advect´e sous le vent de la source volcanique. Cette hauteur est contrainte par la stabilit´e verticale de l’atmosph`ere (Bursik, 2001, Glaze & Baloga, 1996, Graf et al., 1999, Tupper et al., 2009). D´eterminer correctement la hauteur du panache a des influences directes sur
• la dispersion du panache, affect´ee par la rotation et le cisaillement vertical du vent,
• le vieillissement chimique du panache, affect´e par les conditions atmosph´eriques ambiantes : temp´erature, humidit´e, concentrations en a´erosols, radiation solaire, etc., et
• les impacts du panache, en terme de pollution de lair, de d´egˆats pour lenviron-nement, etc.
L’am´elioration de la pr´evision est ´etroitement li´ee aux progr`es dans la compr´ehension des processus dynamiques. La mod´elisation num´erique est devenue un outil incontourn-able pour la pr´evision et l’´evaluation des risques (Sparks, 2003b, Sparks & Aspinall, 2013). Aid´e par le d´eveloppement de l’outil informatique ainsi que l’am´elioration de la compr´ehension de la physique impliqu´ee, ces mod`eles sont de plus en plus sophistiqu´es (Melnik & Sparks, 1999, Neri & Macedonio, 1996). En effet, ces derni`eres ann´ees, les simulations num´eriques d’´eruptions volcaniques se sont fortement am´elior´ees. En raison de la complexit´e des processus et les diff´erentes ´echelles impliqu´ees depuis les flux de conduit jusqu’au panache volcanique aux ´echelles r´egionale et globale, tous les processus ne peuvent ˆetre abord´es aujourd’hui par un seul mod`ele.
Les mod`eles d´ecoulement de conduit sint´eressent au rˆole des esp`eces volatiles, des bulles de gaz, et de la fragmentation du gaz et de la lave, parmi beaucoup dautres aspects. De tels mod`eles peuvent renseigner sur la g´eom´etrie de la bouche ´eruptive, la vitesse d´ejection, et les flux de chaleur et de masse. Cependant, ils sont num´eriquement trop coˆuteux en terme de temps d calcul et de m´emoire pour entrer dans le cadre dun mod`ele de pr´evision du d´eveloppement du panache et de sa dispersion atmosph´erique. Les mod`eles de panache de haute ´energie traitent des processus rapides et hors ´equilibre qui r`egnent dans la r´egion proche du jet volcanique. Ces mod`eles, focalis´es surtout sur la partie basse du panache, ´etudient entre autres aspects les panaches `a flot-tabilit´e n´egative (au caract`ere instable), la g´en´eration et la propagation d´ecoulements pyroclastiques, et la dynamique d´ejection des pyroclastes. Lusage de tels mod`ele est ´egalement limit´e par le coˆut de calcul et la m´emoire requise, car simuler la colonne ´eruptive et sa dispersion demande des ´echelles de temps plus longues, ainsi que de prendre en compte des processus tels que la micro-physique nuageuse et les transfor-mations chimiques au sein de la colonne.
0.0 Introduction
Le mod`ele ATHAM (Active Tracer High Resolution Atmospheric Model) est un mod`ele extrˆemement sophistiqu´e capable non seulement de simuler une colonne con-vective et sa dispersion (de particules et de gaz), mais aussi prend en compte des processus tels que le lessivage de gaz solubles et lagr´egation de cendres. Cependant, ce mod`ele a ´et´e jusquici principalement appliqu´e au volcanisme explosif, et comme il sagit dun mod`ele de convection explicite, son coˆut num´erique est trop ´elev´e pour simuler la dispersion sur une r´egion ´etendue.
Dans une autre cat´egorie de mod`ele, on trouve ceux utilis´e par les VAAC (Volcanic Ash Advisory Centers), charg´es de pr´evoir la dispersion atmosph´erique des panaches de cendres pour pr´evenir des rencontres (dangereuses) avec les avions. Ces mod`eles ne r´esolvent pas la dynamique de la colonne ´eruptive, mais les caract´eristiques de celle-ci sont estim´ees `a partir de certains param`etres de la source volcanique selon des m´ethodes empiriques.
Il existe donc un manque clair en terme de mod`ele de pr´evision de la qualit´e de lair `a ´echelle locale et r´egionale, ce qui nous am`ene `a lobjet principal de cette th`ese. Lobjectif de cette ´etude est de pr´eparer la voie `a un syst`eme de pr´evision num´erique capable de simuler une colonne ´eruptive et sa dispersion de mani`ere pronostique et non diagnostique. Ce mod`ele r´egional, dune r´esolution horizontale typiquement de 1 km, serait activ´e en cas d´eruption, et chose essentielle doit ˆetre rapidement ex´ecutable. Dans les mod`eles globaux ou `a m´eso´echelle utilis´es pour la simulation de la qualit´e de l’air, la source de chaleur intense que repr´esente le volcan est instantan´ement dilu´ee dans la grille du mod`ele ne permettant pas de g´en´erer de la convection. Ces sources de chaleur tout comme les mouvements convectifs ou les ´emissions de gaz et a´erosols par les volcans sont des processus sous-maille qui requi`erent d’ˆetre param´etr´es aux r´esolutions consid´er´ees.
Dans le but de mod´eliser des injections d´emissions volcaniques en profondeur dans la troposph`ere au sein dun syst`eme rapidement ex´ecutable, la strat´egie de cette ´etude est de modifier une param´etrisation sous-maille de nuages convectifs peu profonds, d´ej`a existante dans le mod`ele M´eso-NH. Ce manuscrit a ´et´e d´evelopp´e en deux grandes parties, chapitres 1 & 2 et les chapitres 3 & 4. Le Chapitre 1 est un pr´elude qui reprend les connaissances fondamentales sur les ´eruptions volcaniques. Il donne une vision globale des ´eruptions volcaniques pass´ees en se concentrant principalement sur la dynamique de ces ´eruptions et celle de la colonne convective. Le Chapitre 2 expose
les impacts climatiques et environnementaux des ´eruptions et leur repr´esentation dans les mod`eles. Le Chapitre 3 se pr´esente sous la forme d’un article r´ecemment soumis `
a la revue ”Geoscientific Model Development” (GMD). Cet article d´ecrit le mod`ele utilis´e, Meso-NH, et la nouvelle param´etrisation issue de la modification du sch´ema de convection peu profonde. La param´etrisation est test´ee sur la version unidimensionnelle du mod`ele et valid´ee par des simulations `a l’´echelle des grands tourbillons turbulents (LES). Inspir´e par les r´esultats des simulations id´ealis´ees, la param´etrisation est test´ee dans la version tri-dimensionnelle du mod`ele pour l’´eruption de Janvier 2010. Les premiers r´esultats sont pr´esent´es dans le chapitre 4. Le manuscrit se termine avec les conclusions et les perspectives de ces travaux.
Introduction
Volcanic eruptions are complex phenomena, such as;
• the dynamics of magma transfer and storage within the upper crust, • the initiation of volcanic unrest,
• the processes of magma transport and their interaction with the volcanic edifice, • the dynamics and budget of eruptions (magma and gases) and
• the atmospheric transport and impact of volcanic gases and aerosols. These topics are all closely linked and part of an overall single process.
Volcanic activity has many features in common with other natural hazards, such as extreme weather, earthquakes, landslides and especially wildfires (a natural risk with similar processes than volcanoes). Natural hazards are characteristically complex and involve numerous parameters and processes. Some of the controlling processes are highly non-linear, so that in certain circumstances abrupt changes of behaviour can happen, such as the sudden transition from effusive to explosive eruption.
There are approximately 550 active volcanoes in the world and at least 500 mil-lion people live within a potential exposure range of a volcano. The primary hazards associated with volcanic activity amongst others are related to impacts on air traf-fic, pollution and climate through the emitted volcanic gases and aerosols. Volcanic eruptions eject numerous volatiles namely,
• water vapour (H2O represents 50 - 90 % by volume gas phase),
• sulphur species (represents 2 - 35 % by volume gas phase) whereby sulphur dioxide (SO2) and hydrogen sulphide (H2S) are the most abundant, and
• relatively recently discovered bromine monoxide (BrO) (Bobrowski et al. (2003) amongst others).
Volcanic emissions into the stratosphere mostly from explosive volcanoes such as SO2 are widely known to have impacts on our climate through the formation of
sul-phate aerosols (Robock, 2000). However, the fate of tropospheric emissions from ef-fusive eruptions and their environmental and atmospheric impacts have been far less investigated (Delmelle et al., 2002, Mather et al., 2003). Effusive type eruptions and their emissions are more frequent than the much rare, larger eruptions. Mather et al. (2003) report volcanic SO2 release from continuous eruptions are comparable or even
larger than the release by sporadic eruptions. Andres & Kasgnoc (1998) estimates that sporadic activity contributes only 1% (averaged over long time-scales, e.g. 1 year) to the total tropospheric sulphur flux, hence, it is the continuous degassing of volcanoes that contributes the most to the SO2 budget.
Located in the south-eastern part of Reunion Island (21◦S;55,5◦E), Piton de la Four-naise (PdF hereafter) is one of the worlds most active volcanoes (Lenat & Bachelery, 1988) with an average of one eruption every eight months in the last fifty years (Peltier et al., 2009). Despite the important activity of PdF, its gas emission and aerosol for-mation, size distribution, optical properties, and chemical composition of particles have poorly or not been documented. On contrary, gas and aerosols fluxes have been well studied and referenced for a number of others volcanoes such as Etna and Kilauea. Moreover, the radiative and chemical impact of volcanic gases and aerosols on the atmosphere and the Reunion ecosystems are totally unknown (Lesou¨ef, 2010).
Although eruptions of PdF may not be as dramatic (except for the case of April 2007) as Eyjafjallajokull volcano, Iceland, however, such volcanic activity represent one of the most significant natural sources of pollutants in the atmosphere, both during and between eruptions in forms of fumeroles (Mather et al., 2003). Amongst other gases, sulphur dioxide (SO2) emitted during volcanic activity is of most concern. Airborne
SO2 reacts chemically with sunlight, oxygen, dust particles, and water in the air to form
a mixture of sulphate aerosols, sulphuric acid (H2SO4), and other oxidized sulphur
0.0 Introduction
eruption of PdF, air quality standards for SO2 (information threshold: 300 µg/m3;
alert threshold: 500 µg/m3) were exceeded many times at various monitoring stations
(including the most remote parts of the island with respect to the volcano). The highest record was as high as 2486 µg/m3 (Viane et al., 2009). Furthermore, during
this eruption period
• volcanic smog termed ’VOG’ which is a result of SO2 reaction with O2 and H2O
in presence of sunlight,
• acid rain resulting from reaction of SO2 with H2O (wet deposition), and
• volcanic haze termed ’laze’ resulting from lava-ocean interaction creating a dense hydrochloric acidic plume were also observed.
On the whole, successfully monitoring and forecasting volcanic ash and gases in terms of aviation safety, air quality and climate studies, a central issue is the correct determination of the heights reached by volcanic plume. This height is the vertical zone in which a buoyant plume begins to transport horizontally away from its source affected by environmental factors such as, wind shear and atmospheric vertical stability (Bursik, 2001, Glaze & Baloga, 1996, Graf et al., 1999, Tupper et al., 2009). Correctly determining the height of a plume has direct impacts on the plume
• dispersal affected by wind shear and direction,
• ageing affected by humidity, temperature, aerosol concentrations, solar radiation etc and
• impacts in terms of air pollution, environmental damage etc.
Improvements in forecasting are closely linked to advances in understanding of the underlying dynamical processes. Numerical modelling is becoming an important aspect of forecasting and risk assessment, the evolving approaches have largely focused on numerical simulations (Sparks, 2003b, Sparks & Aspinall, 2013). Aided by increasing computer power as well as improved understanding of the physics involved, such models are becoming increasingly sophisticated (Melnik & Sparks, 1999, Neri & Macedonio, 1996). Indeed in recent years, numerical simulation of volcanic eruptions have greatly improved. However, because of the complexity of the processes and the various scales
involved from the conduit flow to the ash cloud tracking at regional and global scale, not all processes could be addressed so far.
Conduit flow models study the role of volatiles, gas bubbles, fragmentation of gases and lava amongst numerous other aspects. Such models can provide information re-lated to vent geometry, ejection speed, heat fluxes and mass fluxes however, they are too demanding in terms of computer time and memory to simulate volcanic column development and dispersal. High energy plume models deal with the rapid and non-equilibrium processes that occur close to the volcanic jet region. Such models confined to the lower convective region of the eruption study amongst others the negatively buoyant columns (unstable behaviour), pyroclastic flow generation and propagation and the dynamics of clast ejection. These models too are limited in terms computation and memory especially as simulating an eruption column and dispersal needs much longer time scales and one needs to consider a high number of column processes such as micro-physics and/or chemistry. In terms of buoyant column models and dispersion a model such as ATHAM (Active Tracer High resolution Atmospheric Model) exist. ATHAM is a highly sophisticated model which is not only able to simulate the volcanic column and dispersion (particles and gases) but also includes possibilities of gas scav-enging and ash aggregation. However, thus far this model has been applied mostly to explosive volcanic events and since it is an explicit model, it would be computation-ally very expensive to model the plume transport over large areas. In a different class of models there exist operational models such as those used by VAAC (Volcanic Ash Advisory Center). Such models forecast the ash plume dispersion in order to prevent ash-aircraft interaction. Such models do not resolve the eruption column dynamics but instead are prescribed with certain eruption source parameters.
There is a clear lack of forecasting models for air quality on regional to local scale, bringing us to the main focus of this study. The purpose of this study is to pave the way towards a forecast system which is able to simulate a volcanic column and its dispersion in a prognostic way as opposed to a prescribed way. This model is to be implemented into a 1 km resolution model, which is activated in case of an eruption and most importantly is quickly executable. In terms of modelling dynamical processes, in kilometric resolution models used for air quality purposes (simulation or forecasts), the localised heat source is diluted in the model grid and hence no convection is explic-itly generated. Several types of atmospheric movements (e.g. heat sources, induced
0.0 Introduction
atmospheric convective motions and volcanic emissions of gases and aerosols) are all sub-grid scale processes and incorporated into atmospheric models through appropriate parameterisation schemes.
With an aim to model deep injections of tropospheric volcanic emissions in a quickly executable system, the strategy of this study is to modify an existing sub-grid param-eterisation for shallow convective clouds in a Meso-scale model. This manuscript has been developed into two main parts, chapters 1 & 2 and chapters 3 & 4. Chapter 1 considered as a prelude to the manuscript provides the thematic and fundamental knowledge of volcanic eruptions. It provides an overview of past volcanic eruptions, concentrating primarily on the dynamics of volcanic eruptions (focussing on the convec-tive column). Chapter 2 aims on building on the climatic and environmental impacts of eruptions. Furthermore, it concentrates on the efforts of the scientific community to investigate the impacts through modelling studies. Lastly, the chapter outlines the main aims and objectives of this study. Chapter 3 is largely based on an article ac-cepted by the journal of Geoscientific Model Development - GMD. It describes the research model used throughout this study, proposing a modified formulation of an up-draft model, where the volcano induced upup-drafts are parameterised. Furthermore, it is tested on an idealised 1 dimensional (1-D), single column model (SCM) and validated through Large Eddy Simulation (LES), considered as a reference simulation. Inspired by the results of the idealised simulations, the parameterisation is tested in real case set-up and the first results are presented in chapter 4. Ultimately, the manuscript ends with conclusions, short and long term perspectives of the work undertaken during this thesis.
1
Volcanic eruptions in the Earth’s
system
Contents
1.1 Types of volcanoes: Volcanic eruption variability . . . 14 1.2 What controls eruption styles? . . . 17 1.2.1 Magma composition . . . 17 1.2.2 Magma viscosity, temperature and gas content . . . 22 1.2.3 Controls on explosivity . . . 22 1.3 General volcanic eruption dynamics . . . 23 1.3.1 Magma column . . . 23 1.3.2 Eruption column . . . 26 1.4 Man and volcanism . . . 29 1.4.1 Vesuvius eruption and Pompeii . . . 29 1.4.2 Laki eruption, Iceland . . . 29 1.4.3 Eruption of Mount Tambora . . . 30 1.4.4 Pinatubo eruption . . . 31 1.4.5 Soufriere Hills, Montserrat . . . 32 1.4.6 Eyjafjallajokull, Iceland . . . 32 1.5 Outline . . . 33
Man has been a witness to volcanic eruptions for centuries. Zeilinga de Boer & Sanders (2004) explains how volcanism has found it’s way into certain literatures and
beliefs across Iceland, Greece, Japan (Davis, 1992), Hawaii, amongst others. Fur-thermore, the associated widespread population migrations due to eruptions, along with how such phenomena spurred scientific debates and discoveries are also discussed. Alongside, Sigurdsson (1999) considers how over centuries philosophers and scientists have attempted to understand volcanic eruptions. On the whole Zeilinga de Boer & Sanders (2004) and Sigurdsson (1999) outline understanding the structure of our earth has greatly aided in our comprehension of volcanic systems. Finally during the 19th and 20th century various fields of sciences (e.g. research in thermodynamics, petrology, geochemistry, plate tectonics and of course volcanology) have contributed to our overall current understanding of volcanic activity.
This chapter aims to introduce the reader to the thematic of volcanic eruptions by firstly introducing certain components that control various eruption styles (section 1.2) and followed by the dynamics behind volcanic eruptions (section 1.3). An overview of certain volcanic eruptions through human history and their impacts are outlined in section (1.4) and lastly, an overview on the chapter is outlined in section (1.5).
1.1
Types of volcanoes: Volcanic eruption variability
According to the Global Volcanism program of the Smithsonian Instituiton there are about 550 geologically active volcanoes on earth (Smithsonian, 2014). From quiescent lava emissions to extremely violent, explosive events, there is a rather large variability of eruption types. Volcanologists classify volcanoes into groups based on the material that form them, their eruption style, their shapes and sizes. Most can be grouped into three main types (Fig.(1.1)) largely based on their eruptive patterns and their general forms (e.g. scoria cone (cinder cone), shield volcano and stratovolcano (composite volcanoes)).
Cinder cones are the smallest of the volcanoes, typically only a couple hundred of meters high. Shield volcanoes are made by numerous successive basaltic lava flows in a given region (rock formed from the rapid cooling of basaltic lava exposed at or very near the Earth’s surface), e.g. Piton de la Fournaise volcano in la R´eunion Island. Strato-volcanoes are formed through a sometimes explosive and sometimes effusive eruptions. Hence, they are also known as composite volcanoes, as they represent a composite of lava flows and pyroclastic materials (Petersen et al., 2010).
1.1 Types of volcanoes: Volcanic eruption variability
Figure 1.1: Types of volcanoes - The four basic type of volcanoes are: (a) shield vol-cano, (b) cinder cone, (c) stratovolcano and (d) plug dome. Diagram taken from Petersen et al.(2010)
An eruption occurs when magma migrates upward, often driven by expansion of dissolved gas, and is discharged onto the earth’s surface. Three main metatypes of eruptions exist, phreatic eruptions, magmatic eruptions and phreatomagmatic erup-tions. Generally a phreatic eruption occurs when the ascending magma heats the ground/surface water causing near-instantaneous evaporation to steam and resulting in an explosion of steam, water, ash, rock, and volcanic bombs (Barberi et al., 1992). In contrast to phreatic eruptions, magmatic eruptions mainly eject fragmented magma and the variability in magmatic eruptions depend greatly on the physical and chemi-cal nature of the magma (discussed in greater detail shortly). When magma or lava interacts with the near-surface water, a phreatomagmatic eruption takes place. Such eruptions occur especially in water rich environments (White & Houghton, 2000). Out of the three metatypes of eruptions, magmatic eruptions are the most well observed.
Figure 1.2: Erution column height and ”explosiveness” - Various eruption types can be defined by variations in their explosiveness and the height of the eruption plumes (Cas, 1987).
1.2 What controls eruption styles?
conductivity, cooling rates etc. discussed in the following sections) and the scale of eruption, explosive eruptions are classified by Cas (1987) as in Fig.(1.2). The ’explo-siveness’ or explosive power of an eruption is measured through the Volcanic Explosivity Index (VEI) (Newhall & Self, 1982). It can be thought to be similar to the Richter scale used to assign a magnitude number to quantify the energy released by an earthquake. The VEI uses a numerical index ranging from 0 to 8, where each increment represents a 10-fold increase (logarithmic scale) in explosivity. Factors that are taken into ac-count include the volume of pyroclastic material (including ashfall, pyroclastic flows, and other ejecta), the height of the eruption, duration in hours, style of past activity and a number of other qualitative measurements (e.g. ”gentle”, ”effusive”, ”explosive”, ”cataclysmic”, etc.) (Newhall & Self, 1982). Piton de la Fournaise (PdF) is classified as a Hawaiian type volcano, clearly named after the Hawaiian volcanoes. As for Hawaiian volcanoes, PdF is a typical basaltic shield volcano, mostly characterized by it’s effusive eruptions and fire fountaining. Majority of it’s eruptions are not centralized at the main summit, they often occur at vents around the summit and from fissures.
1.2
What controls eruption styles?
In order to complete our understanding behind the dynamics of volcanic eruptions, it is necessary to understand magma and its composition. The chemical composition of magma and its cooling and solidification rate is what directly or indirectly controls nu-merous aspects in volcanism. One such aspect is the range in the explosivity (relatively quiescent to explosive eruptions) of volcanic eruptions.
In this section the basic concept of magma composition and its cooling rate is outlined, followed by a description of the controlling factors on explosivity (i.e. viscosity, temperature, and the amount of dissolved gases in the magma).
1.2.1 Magma composition
Magma is a naturally occurring liquid. About 99% of magmas are made up of 10 main elements, namely, Silicon (Si), Titanium (Ti), Aluminum (Al), Iron (Fe), Magnesium (Mg), Calcium (Ca), Sodium (Na), Potassium (K), Hydrogen (H) and Oxygen (O) (Brophy, 2014, Sen, 2013). Without detailing the chemistry behind how chemical bonds are created, it is simpler to say that, different oxide molecules are formed when the
first nine elements mentioned above bond with Oxygen. Hence, magmas are viewed as a mixture of the nine chemical oxides. The chemical composition of a magma is expressed in terms of the weight percentage of the nine chemical oxides (namely, SiO2 (silicon dioxide), T iO2 (titanium dioxide), Al2O3 (aluminium oxide), F eO (iron
oxide), M gO (magnesium oxide), CaO (calcium oxide), N a2O (sodium oxide), K2O
(potassium oxide), H2O(hydrogen oxide)) (Brophy, 2014, Sen, 2013). What makes one
’type’ of magma different from another is simply the variation in these nine chemical oxides. It is this fact that largely controls the wide range of volcanic rock types, eruption styles, and types of volcanic cones that characterise global volcanic activity (Brophy, 2014).
The variations in magma compositions are rather organised. For example, Fig.(1.3) from Brophy (2014) depicts the chemical compositions of four volcanic rock types found on Mount St. Helens, United States of America. It is observed that as SiO2 content
of each rock (1 to 4) increases, FeO, MgO and CaO decrease, while, N a2O and K2O
increase. Such relation is true for most magmas and subsequent igneous rocks around the world (Brophy, 2014).
As oxygen and silicon are the two most abundant elements in magma, the various magma types are described in terms of their silica content (SiO2), for convenience.
1.2.1.1 Volcanic rocks - mineral composition
Upon the upward migration of magma towards the earth’s surface, it begins to cool and eventually solidifies (or crystallises). During the cooling process a magma forms several different substances (called minerals), over a wide range of temperatures (1200◦C down to around 800◦C) (Brophy, 2014). These solid minerals (formed as crystals) reflect the chemical composition of the magma itself.
The colour of a solidified magma (i.e. the igneous rock) depends on the composition of the magma that formed it. For example, for magmas that are rich in FeO (and in turn low in SiO2, N a2O and K2O while high in MgO and CaO) the different minerals
and rock formed when cooled are dark in colour (Brophy, 2014, Jerram & Petford, 2011, Oxlade, 2012, Wicander & Monroe, 2005). Thus, magmas that are low in SiO2
form dark coloured minerals upon cooling and the resultant volcanic rock is in turn dark. Inversely, light coloured rocks are formed for magmas that are relatively poor in FeO, i.e. high in SiO2. For intermediate amounts of SiO2 in magmas, the resulting
1.2 What controls eruption styles?
Figure 1.3: Examples of magma composition - Magma composition from 4 different rock types from Mount St. Helens. Weighted percentage of SiO2 on the x-axis versus the
weighted percentage of FeO, MgO, CaO, N a2O and K2O on the y-axis. Diagram taken
minerals upon crystallisation are of dark and light coloured. The resulting rock reflects this combination of coloured minerals with a grayish visual (Brophy, 2014, Oxlade, 2012).
1.2.1.2 Volcanic rocks - magma cooling rate
Although magma composition is one factor in determining the visual of a igneous rock, another important factor is the cooling rate of magma (Brophy, 2014, Jerram & Petford, 2011). It determines the texture of the rock (which is a measure of how big the individual minerals are that form during the cooling process, (Brophy, 2014), Sen2013). To understand how the cooling rate controls the size of a crystal, this section briefly delves into the process of crystallisation.
Through experimental studies (Dawson (1992), Gibb (1974), Lofgren (1980), amongst others) a general relationship between cooling rate and the total number of crystal nu-clei that form in most fluids (including magmas) have been determined. Generally, slow cooling rates form a small number of crystal nuclei. Furthermore, due to the availabil-ity of greater time for these crystals to grow, this results in a rock that is dominated by large crystals. Such rocks are called phaneritic, i.e. coarse grained (Brophy, 2014, Jerram & Petford, 2011, Oxlade, 2012, Wicander & Monroe, 2005). As the cooling rate increases the number of crystal nuclei formed increase. This increased cooling rate means a relatively short amount of time available for crystal growth, hence this results in a fine grained rock, named aphanitic (Brophy, 2014, Jerram & Petford, 2011, Oxlade, 2012, Wicander & Monroe, 2005). A rock texture referred to as porphyritic is created when magma goes through two stages of cooling, i.e. a slow rate followed by a relatively faster rate. Such a textured rock contains large crystals enclosed within a fine-grained rock. Lastly, very fast cooling rate lead to a dark coloured solidified magma (solidified into volcanic glass) that is absent of any crystals. Such a solid is referred to as obsidian (Brophy, 2014).
We now know that cooling rates control the texture of the igneous rocks, but why are cooling rates different? When ascending magma is suspending within the earths crust (known as the plutonic environment in volcanology), due to the insulation pro-vided by the surrounding rocks, magma loses it’s heat very slowly. Overall it can be said that in plutonic environment the magma cooling rates are slow creating coarse-grained phaneritic rocks (Brophy, 2014, Jerram & Petford, 2011, Wicander & Monroe,
1.2 What controls eruption styles?
2005). On the other hand, once magma erupts onto the earth’s surface known as the volcanic environment, due to the lack of insulation compared to the plutonic environ-ment, magma cools down relatively quickly. Resulting in a fine-grained aphanitic rock or, in some circumstances, obsidian (Brophy, 2014, Jerram & Petford, 2011, Wicander & Monroe, 2005). An intermediate situation is when magma is suspended for some time within the earth’s crust and then erupts onto the surface. This process leads to a volcanic rock that has experienced the two periods of cooling (i.e. first at a slow rate followed by a relatively faster rate). The resultant rock is said to have a porphyritic texture (Brophy, 2014, Jerram & Petford, 2011, Wicander & Monroe, 2005).
1.2.1.3 Volcanic rocks - classifications
Overall, magma composition controls the type of minerals it forms (i.e. mineral compo-sition, light versus dark) and its cooling rate controls what the minerals look like when they form (i.e. rock texture; size, shape and arrangement of the minerals). Igneous rocks can be classified depending upon the information presented in these sub-sections as in Fig.(1.4).
Figure 1.4: Magma and rock classification - Magma composition and cooling rates classified in terms of various rock textures and categories.
On the whole, from Fig.(1.4) it can be seen that the rock colors (controlled by the color of the minerals) are controlled by the chemical composition of the magma from which they form. Thus, magma composition indirectly controls volcanic rock colours. It is worth noting that the only difference between for example, basalt and gabbro is
the grain size, controlled entirely by the cooling rate. Hence it can be said that various igneous rocks are formed from a given magma composition depending on where and how magma cools and solidifies.
1.2.2 Magma viscosity, temperature and gas content
The viscosity of a substance is defined as it’s internal resistance to flow. A magma’s viscosity is controlled by its temperature, gas content and most importantly its com-position (Sen, 2013). In this summary, the chemical and physical facts as to how the above variables control magma viscoscity will not be discussed in depth. This is to avoid deviation from the basic or minimum facts in order to comprehend basic volcano dynamics.
Temperature plays an important role in lowering the viscosity of most liquids (in-cluding magmas) by increasing its fluidity. However, the composition of magma plays a greater role in magma viscosity. It has already been established that SiO2 is the
most abundant oxide in a magma. Hence, the most important factor in determining the viscosity is the number of silicate ’chains’ formed (this chemical process is known as polymerisation) (Sen, 2013, Wicander & Monroe, 2005). This is because, as SiO2
content increases, so does the network of silica tetrahedra-form. If a certain flow is to take place then the strong bonds between SiO2 must be broken. Hence, magma with
greater silica content (felsic) have greater viscosity then those with lower silica content (mafic). Temperature increases further break down the silica bonds, hence lowering viscosity of a magma (Sen, 2013). Lastly, gas content too has an effect on the viscosity. During the process of exsolution (process in which a solution of molten rocks separate into its constituents), the gases that begin to escape the melt exhibit low viscosity. However, the residual melt will exhibit an increased viscosity as gas escapes. Although this too is an important factor in determining the viscosity of a magma, however, ex-solving gases play a more important role by providing the driving force for an eruption (discussed next).
1.2.3 Controls on explosivity
Dissolved gases in a magma have been recognised to be the driving force of an eruption. This being said, viscosity of magma too plays an important role in determining the explosive nature of an eruption (Parfitt & Wilson, 2009). The ability of the dissolved
1.3 General volcanic eruption dynamics
gases to escape magma determines the nature of an eruption and is strongly linked to magma’s viscosity. Rhyolitic magmas (see Fig.(1.4)) with high viscosity (related to high polymerization of silicates), prevent gas bubble segregation. This prevention increases the overall pressure exerted onto the magma column and eventually the gas ejects in an explosive manner (Parfitt & Wilson, 2009). For basaltic magmas, the gas bubbles can relatively easily escape the magma due to its low viscosity. Hence, as a general rule, basaltic magmas favour non-explosive eruptions and lower gas content, whereas explosive eruptions are typical of rhyolitic magmas and favour high gas content (Parfitt & Wilson, 2009). Table 1.1 consolidates information from this section regarding magma viscosity, gas content and various eruption styles in terms of magma’s silica content.
Table 1.1: Various eruption styles in terms of magma’s silica content and viscosity
SiO2 content Magma type Temperature◦C Viscoscity Gas content Eruption style
∼ 50% Mafic ∼ 1100 low low non explosive
∼ 60% Intermediate ∼ 1000 intermediate intermediate intermediate
∼ 70% Felsic ∼ 800 high high explosive
1.3
General volcanic eruption dynamics
This section briefly describes the two main columns comprising a volcanic eruption, the magma column and the eruption column as depicted in a cross sectional view of an erupting column of Fig.(1.5).
1.3.1 Magma column
Eruptions are fed from a magma column that mostly exists below the point source of the eruption. In general, magmas rise as they are less dense than the surrounding solid rocks (Sparks, 2003a):
1. The exsolution surface occurs in the magma reservoir beneath the volcano. It separates a zone of magma containing dissolved volatiles from an overlying zone of magma containing exsolved gas bubbles.
Figure 1.5: Cross-sectional model of an eruption - Regions in the
magma and eruption column. Diagram taken from the website http :
1.3 General volcanic eruption dynamics
2. The fragmentation surface occurs at the top of the magma column. It separates the zone of magma containing exsolved gas from the overlying eruption column. Fragmentation of the magma is generated by rapid gas expansion and bubble explosion.
Magmas, a mixture of molten or semi-molten rock and volatiles rise due to their low density in comparison to the surrounding rock. While rising, a depth or pressure is encountered whereby due to this decompression of magmas, the dissolved gases can no longer be held in solution. At this stage the gas begins to form a separate phase (it makes gas bubbles or vesicles), just as when one removes the cork of a champagne bottle. This process of exsolution of gas from magma is called vesiculation. Once gas bubbles are formed, due to the reduced pressure they begin to expand while continuously more gases are exsolved from the magmas. Fragmentation of the bubbles’ walls then begin at the fragmentation surface. Here, the gas bubbles grow during ascent and due to the build-up of gas pressure within the gas bubbles they become unstable and explode releasing the gas pressure. The gas content controls the velocity of the eruption and its release is confined to the diameter of the magma column. Low viscosity of liquid magma aids the expansion of gases, and upon reaching the Earth’s surface, gases released from bursting bubbles easily expand to atmospheric pressure. This leads to a non-explosive eruption usually as a lava flow. However, a relatively higher viscosity (of liquid magma) makes it harder for the gases to expand leading to a pressure build up inside the gas bubbles. In contrast to the non-explosive eruption, the pressure build up within these bubbles causes them to burst explosively on reaching atmospheric pressure, hence causing an explosive volcanic eruption.
Volatiles which are present within magmas are the driving force of eruptions as briefly explained in the earlier section. Dissolved water (H2O, a main volatile in
mag-mas) affects the ascent dynamics by increasing the eruption mass flow-rate (Papale et al., 1998, Wilson et al., 1980) due to reduced magma viscoscity (Textor et al., 2005). On the other hand increasing amounts of carbon dioxide (CO2) (the second main
volatile component), reduces mass flow-rate (Papale & Polacci, 1999, Textor et al., 2005). This reduction is found to be due to the large increase in the gas saturation pressure (due to the presence of increased CO2), which results in earlier H2Oexsolution
are affiliated to the differing solubilities of the two volatiles. Gas exsolution occurs at higher pressures when CO2is present than if H2Owas the only volatile species present.
This is because CO2 is poorly soluble (Holloway & J.G, 1994, Papale & Polacci, 1999).
The developed gas phase carries a fraction of all the volatile components. In doing so, it reduces the amount of H2O dissolved in the magma. Hence, greater CO2 can
result in more gas available for expansion and acceleration (favouring magma flow), as well as hindering magma flow in more viscous magma. Numerical simulations suggest that the latter effect is the dominant one (Textor et al., 2005). Greater comprehensive knowledge in conduit flow processes can be found in Textor et al. (2005).
On the whole, non explosive eruptions are generally favoured by low gas content and low viscosity magmas (basaltic to andesitic magmas). Such eruptions usually begin with fire fountains due to release of dissolved gases (Walker, 1981). Explosive eruptions in contrast are generally favoured by high gas content and high viscosity (andesitic to rhyolitic, silica rich magmas). Furthermore, explosive bursting of bubbles fragments the magma into clots of liquid that cool during their fall through the air. These solid particles are known as pyroclasts (hot fragments) and tephra or volcanic ash.
Although the dynamics related to the magma column have been discussed, however such processes are not treated in this study.
1.3.2 Eruption column
The fragmentation surface is the point source of the eruption. Above this fragmentation surface lies the eruption column, a region of hot gas and broken pyroclastic particles (transported from the ground into the atmosphere).
The eruption column rising from the fragmentation surface into the troposphere/stratosphere undergoes some progressive behavioural changes (both physical and mechanical),
al-lowing the column to be sub-divided into three regions (Sparks (1986), see Fig.(1.5): 1. the gas thrust/jet phase region in the lower column (driven by gas expansion), 2. the convective region in the upper column (driven by the constant release of
ther-mal energy from internal ash (where applicable), entrainment of environmental air and microphysical changes in the column) and
1.3 General volcanic eruption dynamics
3. the umbrella region (also known as the ”downwind plume”) at the top of the eruption column.
Internally powered by gas expansion (decompression) at the base of the eruptive column, the gas thrust region is where gas and plastic magma particles are in verti-cal movement. Initially, the gas thrust is denser (it’s overall density depends on the particle-to-gas ratio) than its surrounding air because of its incorporation of pyroclas-tic parpyroclas-ticles. It is driven up by its own kinepyroclas-tic energy (Woods, 1988). The jet on exit experiences a drag by the atmosphere and a downward acceleration from gravity. And as the pyroclastic particles fall out (as ballistics), the turbulent margins of this region entrain the surrounding air, which continues to travel towards the interior of the column. Before the jets own kinetic energy is spent, this entrained air expands due to the hot fragments of magma and other materials within the jet and as a result the density of the plume (mixture of particles, volcanic gases and air) is reduced. The hot gases in the column are now less dense than that of the atmosphere. At this point, the gas thrust gives way to convective uprise (the column is said to become buoyant) and hence, development of the convective thrust region comprising majority of the eruptive column (Woods, 1988).
In humid coastal and tropical to subtropical environments, moisture from the sur-rounding air is also entrained into the plume. The convective plume is driven by the constant release of thermal energy from internal ash (where applicable) and the result-ing latent heat release from the condensed water vapour in the column further adds to it’s buoyancy. The different entrainment ratios of the colder surrounding air into the column during the ascent steadily decreases the temperature of the column and it eventually reaches a certain height whereby the bulk density of the column becomes equal to that of the atmosphere (atmospheric air becomes less dense with height) (Her-zog et al., 1998, Valentine, 1997). The plume is now said to have reached a neutral buoyancy state and is known as an ’umbrella cloud’.
Where amounts of entrainment are not sufficient to make the eruptive plume lighter than surrounding air, the plume decelerates until its velocity reaches zero (not having had enough time to mix with the atmosphere). The density of the plume at this altitude is greater than that of its surrounding atmosphere and the column starts to fall towards the surface of the Earth. This generally happens at much lower heights
(at a few kilometers, Woods (1988)) and such an eruption is known as a ’collapsing’ column whereby, the particle-gas mixture may further flow outward as a pyroclastic flow.
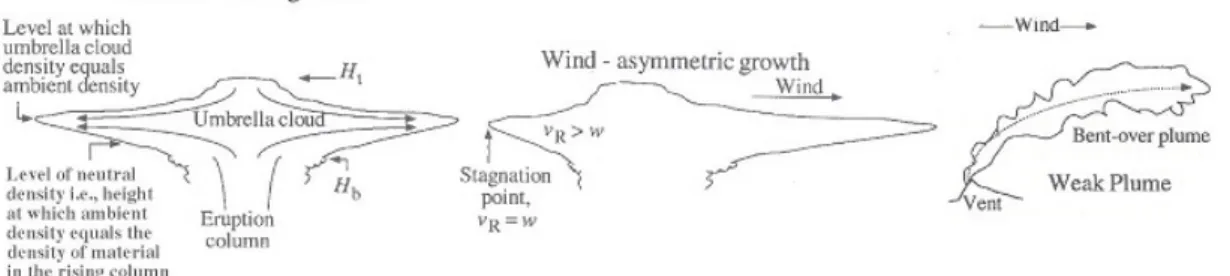
Figure 1.6: Volcanic plume dispersion - From left: a volcanic plume dispersion in a no wind/stable winds environment, dispersion of the eruption cloud to the right affected by wind (middle figure), a bent over plume deflected comparatively strong winds. From Sparks et al. (1997)
In a calm atmosphere (very weak winds) the axis of the column is vertical and the umbrella cloud is centered directly over the vent and it disperses symmetrically in both directions as shown in Fig.(1.6, left). The bottom of umbrella region (Hb) is
where densities of the plume and the surrounding air are equal. Continued upward mobility towards the top of the umbrella region (Ht) is controlled by momentum and is
commonly known as an ”overshooting”. In case of an overshooting the column slumps back gravitationally towards the height where its density equals that of the air. The interaction between the downward and upward flow result in a wedge like form (Sparks et al., 1997). Most eruption columns penetrate the atmosphere with a cross wind which can alter the entrainment process along with distorting the shape of the plume. The atmospheric structure varies with altitude, latitude and seasons (Sparks et al., 1997). The spreading and dispersal of volcanic plumes within the atmosphere result from interaction with atmospheric motions and stratification. All columns experience wind throughout their height and can affect plumes in different ways depending on their strength and size. However, the umbrella region is often asymmetric due to the effect of high atmospheric winds. In a cross wind, larger plumes rise almost undistorted by the wind (whereby the column axis will be slightly deflected) and as the lateral velocity begins to decrease, the plume interacts with the wind as shown in Fig.(1.6, middle). Here the stagnation point occurs on the left hand side where the wind velocity (vR)
1.4 Man and volcanism
equals the velocity of the plume (w). Weaker plumes as is the case for majority of the PdF eruptions, interact much faster with the cross winds and can appear as a ”bent-over” plume as depicted in Fig.(1.6, right).
1.4
Man and volcanism
Briefly, some major past eruptions are outlined especially in terms of their significant (direct or indirect) affects on society and environment.
1.4.1 Vesuvius eruption and Pompeii
The eruption of Vesuvius of 79 AD caused extensive destructions all over the Campa-nian area, engulfing the cities of Pompei, Herculaneum, Oplonti and Stabiae (Giacomelli et al., 2003). The eruption followed a long quiescence period and the inhabitants of the area were surprised by the volcanic events. The first part of the eruption was char-acterized by a widespread dispersal of pumices from a high eruptive column. Carey & Sigurdsson (1987) estimated the height of the eruption column during the develop-ment of the Plinian phase of as 14 km reaching up to 26 km during the emission of white pumice and then to 32 km during the emission of grey pumice immediately be-fore the deposition of pyroclastic flows. The second part of the eruption, characterized by pyroclastic flows emplacement, caused major damages with extensive life losses in most of the towns surrounding the volcano. In Pompeii, the major casualties during the first phase resulted from roof collapses (Carey & Sigurdsson, 1987). During the second phase, people were killed either by physical trauma due to the kinetic energy of the pyroclastic density currents (PDCs) flow or by suffocation because of the ash-rich atmosphere. Overall 394 corpses were excavated in the pumice fall deposit while 650 in PDCs deposit. A total of 1044 victims were recovered and another 100 victims are esti-mated on the basis of many groups of scattered bones and finally, Carey & Sigurdsson (1987) estimate another 464 still buried in regions partially excavated.
1.4.2 Laki eruption, Iceland
Thordarson & Self (2003) show that during the Laki eruption in 1783 − 1784 in Ice-land approximately 122 megatons (Mt) of sulphur dioxide (SO2) was emitted into the
atmosphere and maintained a sulphuric aerosol veil that hung over the Northern Hemi-sphere for more than 5 months. Approximately 95 Mt of the total SO2 was transported
into the upper troposphere/lower stratosphere and the eruption column extended up to 13 km (Thordarson & Self, 2003). The eruption had a devastating impact upon the ecology of Iceland and the death of approximately 25 % of the island’s population. The aftermath resulted in induced illness, subsequent environmental stress and famine (Steingr´ımsson & Kunz, 1998, Thorarinsson, 1979, 1981). The environmental impacts such as dry sulphurous fogs (due to 175 Mt of sulphate (H2SO4) aerosols) were
re-moved as acid precipitation as shown by Thordarson & Self (2003) and extreme heat, chemical pollution, along with tremendous storms of thunder, lightning and hail were reported from northern Scotland to Sicily (Brayshay, 1999, Stothers, 1996). Grattan et al. (2003) report how significant increases in the national death rate in England coincided with the early phases of the eruption. They further link the dry fog of 1783 to the symptoms observed in certain populations (difficulty in breathing, eye and skin irritation, headaches, loss of appetite and tiredness) due to severe exposure to air pol-lution. Apart from the impacts on climate and population in the northern hemisphere (NH), Oman et al. (2006) have shown from both observations and climate model simu-lations that NH high-latitude eruptions produce changes in atmospheric circulation in the NH summer, weakening the African summer monsoon, reducing precipitation and consequently reducing the flow in the Nile and Niger rivers.
1.4.3 Eruption of Mount Tambora
The island of Sumbawa, home to Mount Tambora, is located in present day Indonesia. During the eruption of Mt. Tambora on 5th April 1815, thundering detonations were heard as far as 1400 km away in the Molucca Islands (Stothers, 1984). Light ash fall began on eastern Java and continued till the 10thof April when the eruption intensified
and the sound from the explosions were heard possibly up to 2600 km in Trumon on the island of Sumatra (Stothers, 1984). A loss of about 92,000 lives have been estimated on Sunbawa and Lombok, furthermore, avolume of 150 km3 of tephra has
been estimated (up to 1300 km away from the source) (Self et al., 1984, Stothers, 1984). A region extending to about 600 km west of the volcano was plunged into darkness for three days (Oppenheimer, 2003a, Sigurdsson & Houghton, 2000). The eruption had a dramatic impact on the earth’s climate as approximately 60 Mt of sulphur was ejected
1.4 Man and volcanism
into the stratosphere (up to 43 km in altitude) forming a global sulphate aerosol veil (Oppenheimer, 2003a). The dimming of stars including brilliant sunsets and twilights were observed in Europe as an immediate atmospheric result (Stothers, 1984). The following year there were noticeable disruption to weather patterns e.g. anomalously cold weather experienced in the north-eastern USA, maritime provinces of Canada, and Europe, giving way to it being called ”the year without a summer” (Oppenheimer, 2003a, Self et al., 1984, Sigurdsson & Houghton, 2000, Stommel & Stommel, 1983). The global human impact was such that massive crop failures and damage lead to famine, disease and social unrest in many parts of the world (Oppenheimer, 2003a, Self et al., 1984).
1.4.4 Pinatubo eruption
The Pintubo eruption in the Philipines in 1991 created a giant umbrella cloud of min-imum 35 km in altitude (Koyaguchi & Tokuno, 1993) and ejected 17 - 20 Mt of SO2
in the middle to lower stratosphere (Bluth et al., 1992, Robock et al., 2007, Self et al., 1998). The SO2 formed sulphate aerosol cloud attained global coverage about 1 year
after the eruption (persisting for up to 3 years) (Self et al., 1998), decreasing the amount of Earth’s net radiation and in effect producing a climate forcing. In response to this sulphuric cloud a temperature decrease in excess of 0.5◦ was observed in the north-ern hemisphere - NH (Dutton & Christy, 1992, Hansen et al., 1993). Several studies (Farman et al. (1985), Hofmann & Solomon (1989), Prather (1992), Wolff & Mul-vaney (1991), amongst others) have shown that sulphate aerosols in the stratosphere can catalyse ’heterogeneous reactions’ (Eatough et al., 1994) that affect global ozone abundance. Ozone depletion was indeed observed (partly due to another eruption; Mt. Hudson, Chile) over Antartica (Barton et al., 1992, Doiron et al., 1991), at altitudes of 9 - 11 km (Deshler et al., 1992), along with an unprecedented increase in the ”Ozone hole” of the southern hemisphere (SH) (Brasseur, 1992, Hofmann et al., 1992, 1994a). In contrast to the rather global cooling, the observed winter warming (two winters following the eruption) in the NH is known to be a dynamic response to volcanically produced temperature gradients in the lower stratosphere (from aerosol heating and ozone depletion, and to reduced tropospheric storminess (Stenchikov et al., 2002)). In response to a global cooling there is a decrease in the atmospheric water vapour (Soden et al., 2002, Trenberth & Dai, 2007). Dai et al. (2004) link the eruption to the drought
conditions experienced by a significant percentage of the world, a year following the eruption. Overall, Trenberth & Dai (2007) indicate a relationship between the increase of sulphate aerosols in the atmosphere and the hydrological cycle. Since the eruption of Pinatubo, great interest amongst atmospheric scientists were sparked and a tremendous amount of research studies has since been conducted especially in the area of aerosol clouds and their global climatic effects enhancing our understanding and better climate model predictions.
1.4.5 Soufriere Hills, Montserrat
An example of an evacuation of a populated area due to the danger posed by a vol-canic eruption in recent times is that of Soufriere Hills volcano located at Montserrat. Dormant for years, the Soufriere Hills erupted in July 1995. About two-thirds of the population (about 7000 people) was evacuated. Sparks & Young (2002) outline how between 1995 to 1997 Soufriere Hills had displayed a wide range of volcanic phenomena;
• generation of pyroclastic flows (through lave dome and fountain collapse), • vulcanian and sub-plinian explosivity (accompanying tephra fall),
• entrance of pyroclastic flows into the sea,
• sector collapse with formation of a debris avalanche, • a high-velocity pyroclastic density current and
• generation of lahars (a volcanic mud-flow, mixtures of water and tephra). Pyroclastic surges had caused significant damage to large areas of vegetation and build-ings in most part of the island (Baxter et al., 2005, Cole & Stinton, 2010).
1.4.6 Eyjafjallajokull, Iceland
The eruptions of Eyjafjallajokull (located in Iceland, eruptions of 2010) 6-9 months after the event caused various physical symptoms (tightness in the chest, cough, phlegm, eye irritation, psychological morbidity symptoms and dyspnoea) in residents living in the exposed areas (Carlsen et al., 2012). However, they are mostly remembered for disruptions they created to air travel across western and northern Europe. Although the
1.5 Outline
volcanic plume rarely rose above 7 km in altitude (Petersen et al., 2012), it was unusual in two ways. One is the duration of the eruption (8 days) which contrasts with Plinian eruptions that lasts some hours rather than days (Mastin et al., 2009, Sparks et al., 1997). Second is the amount of ash dispersed to the south and south-east direction, over a large part of Europe (Gudmundsson et al., 2012), even if the concentrations were quite low (Ansmann et al., 2010, Pietruczuk et al., 2010, Schumann et al., 2011, Stohl et al., 2011). This dispersion of ash resulted from a sustained eruption of fine ash and an increased frequency of the north-westerly winds, 71% in comparison to 49% on average during this season (Petersen et al., 2012). The disruption to air traffic from the 15 to 23 April for Northern Europe followed by more airport closures and cancelled flights in the following weeks, affected millions of passengers and generated huge economic costs and losses (Harris et al., 2012). Even such modest (Wilson et al., 1978) eruptions have stressed the importance of hazard assessment and risk management (Gudmundsson et al., 2012).
1.5
Outline
This chapter may be seen as a prelude to the thesis as it has simply introduced various eruption styles of volcanoes, magma compositions and viscosity and most importantly the basic eruption dynamics. Some basic information relating to conduit dynamics (where the processes leading to surface eruption of the volcano takes place) have been addressed followed by the surface volcanic explosion dynamics. This rather brief chapter also introduces to the reader various eruptions that have taken place in relative recent times, concentrating of their impacts on climate, air pollution, health issues amongst societies along with relative economic costs incurred.
The objective of this chapter was to introduce various vocabulary used by the scientists in the field, and to introduce the general ideas behind the dynamics of an eruption. For this reason, the objective of the thesis is presented in the following chapter proceeding the more interesting literature review on the relevant topics.
2
Volcanic eruption impacts and
consequences to models
Contents
2.1 Volcanism and atmospheric chemistry . . . 36 2.1.1 Volcanic eruptions as a climate forcing agent . . . 38 2.1.2 A focus on the tropospheric sulphur cycle . . . 42 2.1.3 Volcanic eruptions and air pollution . . . 43 2.2 Volcanic columns and ash cloud: models and challenges . . 52 2.2.1 Atmospheric dispersal processes: high energy plume models . 53 2.2.2 Buoyant volcanic column and proximal dynamics: buoyant
column and dispersal models . . . 54 2.2.3 Ash dispersal at regional, continental and global scale . . . . 55 2.2.4 Overview . . . 57 2.3 On the importance of plume heights . . . 59 2.4 Thesis objectives . . . 60
It is well known that eruptions can cause climatic variations and air pollution degra-dation as seen earlier in chapter 1 through various eruptions of recent times. Due to their direct and indirect impacts on our society, such natural events are frequently mon-itored and reported (Forsyth, 1988, Franklin, 1784, Wegmann, 2012). We have briefly seen in chapter 1 how depending on the location and size of the eruption, atmospheric conditions and volcanic gases released can create,