HAL Id: hal-00614852
https://hal.archives-ouvertes.fr/hal-00614852
Submitted on 17 Aug 2011HAL is a multi-disciplinary open access archive for the deposit and dissemination of sci-entific research documents, whether they are pub-lished or not. The documents may come from teaching and research institutions in France or abroad, or from public or private research centers.
L’archive ouverte pluridisciplinaire HAL, est destinée au dépôt et à la diffusion de documents scientifiques de niveau recherche, publiés ou non, émanant des établissements d’enseignement et de recherche français ou étrangers, des laboratoires publics ou privés.
coastal ecosystem dominated by Phaeocystis globosa
blooms
Jean-David Grattepanche, Elsa Breton, Jean-Michel Brylinski, Eric Lecuyer,
Urania Christaki
To cite this version:
Jean-David Grattepanche, Elsa Breton, Jean-Michel Brylinski, Eric Lecuyer, Urania Christaki. Suc-cession of primary producers and micrograzers in a coastal ecosystem dominated by Phaeocystis glo-bosa blooms. Journal of Plankton Research, Oxford University Press (OUP), 2010, 33 (1), pp.37. �10.1093/plankt/FBQ097�. �hal-00614852�
For Peer Review
Succession of primary producers and micrograzers in a coastal ecosystem dominated by Phaeocystis globosa
blooms
Journal: Journal of Plankton Research Manuscript ID: JPR-2010-077.R2
Manuscript Type: Original Article Date Submitted by the
Author: 02-Jul-2010
Complete List of Authors: Grattepanche, Jean-David; Univ Lille Nord de France, ULCO, - CNRS, UMR 8187 Laboratoire D'océanographie et de Géosciences, MREN, équipe écologie planctonique
Breton, Elsa; Univ Lille Nord de France, ULCO, - CNRS, UMR 8187 Laboratoire D'océanographie et de Géosciences, MREN, équipe écologie planctonique
Brylinski, Jean-Michel; Univ Lille Nord de France, ULCO, - CNRS, UMR 8187 Laboratoire D'océanographie et de Géosciences, MREN, équipe écologie planctonique
Lecuyer, Eric; Univ Lille Nord de France, USTL, - CNRS, UMR 8187 Laboratoire D'océanographie et de Géosciences, Station Marine Christaki, Urania; Univ Lille Nord de France, ULCO, - CNRS, UMR 8187 Laboratoire D'océanographie et de Géosciences, MREN, équipe écologie planctonique
Keywords: Phaeocystis globosa, diatoms, micrograzer community, eastern English Channel
For Peer Review
Succession of primary producers and micrograzers in a coastal ecosystem
1dominated by Phaeocystis globosa blooms
2J-D Grattepanche1, Elsa Breton1, Jean-Michel Brylinski1, Eric Lecuyer2, Urania Christaki1
3 4
1
Univ Lille Nord de France, ULCO, - CNRS, LOG UMR 8187, 32 Av. Foch, 62930 Wimereux,
5
France
6 2
Univ Lille Nord de France, USTL - CNRS, LOG UMR 8187, 28 Av. Foch, 62930 Wimereux,
7 France 8 9 E-mail:Jean-David.Grattepanche@univ-littoral.fr 10 tel: 00 33 (0)3 21 99 64 00 11 Fax: 00 33 (0)3 21 99 64 01 12
Keywords: Phaeocystis globosa, diatoms, micrograzer community, eastern English Channel.
13 1 2 3 4 5 6 7 8 9 10 11 12 13 14 15 16 17 18 19 20 21 22 23 24 25 26 27 28 29 30 31 32 33 34 35 36 37 38 39 40 41 42 43 44 45 46 47 48 49 50 51 52 53 54 55 56 57 58
For Peer Review
14Abstract:
15
The community structures and succession of phytoplankton, protozooplankton and copepods were
16
studied from February 2007 to July 2009 in a coastal area of the eastern English Channel subject to
17
Phaeocystis globosa blooms. While diatom blooms preceded P. globosa blooms each year, the
18
community structure and stock of heterotrophic protists appeared to be related to the dominant P.
19
globosa life cycle stages. In 2007 the dominance of large colonies (>100 µm, 375 µg C L-1
) which
20
resulted in a high biomass of healthy free cells (163 µg C L-1) accompanied high spirotrich ciliate
21
stocks (up to 58 µg C L-1) and high abundances of the copepods Acartia clausi and Temora
22
longicornis (up to 11 ind L-1
). In 2008, the bloom which lasted a shorter period of time, was
23
dominated by large colonies (328 µg C L-1), and fewer free cells (131 µg C L-1). This corresponded
24
with a lower abundance of grazers, with stocks of heterotrophic protists and copepods 1.6 times and
25
2.2 times lower, respectively. In 2009, the P. globosa bloom was again dominated by large colonies
26
and <100 µm diatoms. This corresponded to a dominance of heterotrophic dinoflagellates among the
27
protists (62% of the total heterotrophic protist biomass) and Acartia clausi (55% of the copepod
28
abundance). Overall, heterotrophic dinoflagellates appeared to be likely the most important group of
29 phytoplankton grazers. 30 31 INTRODUCTION 32
In the North Sea and in the eastern English Channel, gelatinous colonies of Phaeocystis globosa
33
Scherffel, 1900 (Prymnesiophyceae) several mm in size (Rousseau et al., 2007) commonly dominate
34
the phytoplankton community during spring, following the decline of an earlier diatom bloom (e.g.,
35
Lancelot et al., 1998). P. globosa, a species of ephemeral occurrence alternates between a colonial
36
stage in the earlier phase and solitary cells during the decline of the bloom (Rousseau et. al., 2007).
37
In the colonial form, P. globosa can represent over 90% of phytoplankton biomass (Lancelot, 1995;
38
Lamy et al., 2009), and be responsible for the massive load of organic matter into the ambient water,
39
often resulting in foam accumulation along the shoreline (Van Boekel et al., 1992).
40
Generally speaking, phytoplankton blooms occur as a result of growth greatly exceeding
41
mortality, often through escaping control by grazers (Strom 2002; Irigoien et al., 2005). In the
42
particular case of P. globosa, experimental and modelling studies suggest that in early stages of the
43
bloom, solitary cells are well-grazed by the microzooplankton but control ceases when colonies start
44
to form (Verity, 2000). Culture experiments have shown that the smaller forms of P. globosa, free
45 1 2 3 4 5 6 7 8 9 10 11 12 13 14 15 16 17 18 19 20 21 22 23 24 25 26 27 28 29 30 31 32 33 34 35 36 37 38 39 40 41 42 43 44 45 46 47 48 49 50 51 52 53 54 55 56 57 58
For Peer Review
cells of 4-8 µm, can support the growth and reproduction of protists, but not copepods (Tang et al.,
46
2001). Furthermore, field studies of microzooplankton grazing during blooms of Phaeocystis have
47
indicated high grazing rates (e.g., Stelfox-Widdicombe et al., 2004). Thus, existing evidence
48
supports a view that microzooplankton grazing could potentially impact Phaeocystis blooms. In
49
contrast, several field studies focusing on mesozooplankton impact on P. globosa have reported
50
grazing rates that vary from negligible, suggesting the unsuitability of P. globosa for many species
51
of mesozooplankton (Hansen et al., 1993; Gasparini et al., 2000), to highly variable (Seuront and
52
Vincent, 2008). These discrepancies may be attributable to the effects of colony size on
53
susceptibility to copepod grazing (e.g., Verity, 2000) and/or copepods switching to heterotrophic
54
food (Hansen and Van Boekel, 1991; Nejstgaard et al., 2001). Overall, despite the existence of
55
numerous studies dealing with P. globosa blooms, the identities and relative importance of the
56
major groups of grazers remains obscure. In a model simulation study, Verity (2000) postulated that
57
transitions between life cycle stages of P. globosa may potentially be important to interactions
58
between phytoplankton, micro- and mesozooplankton and that these interactions may depend on
59
the match or mis-match of phytoplankton and grazer communities.
60
Here we attempt to clarify whether succession of the phytoplankton community corresponded to
61
changes in the grazer community, especially with regard to heterotrophic protists. Our study covered
62
3 years of the critical period of phytoplankton growth and senescence in a coastal system (eastern
63
English Channel) over a period of 2.5 years. Such an approach permits the identification of "regular
64
and recurrent patterns from occasional and exceptional events" (Ribera d'Alcala et al., 2004). We
65
hypothesized that although the bloom is dominated by a single species, P. globosa- , phytoplankton
66
community composition preceding and following the bloom is likely to be variable, as well as the
67
intensity of the bloom, and in particular the magnitude and the timing of P. globosa life stages
68
(flagellated cells, colonies, and free colonial cells). Because of their known potential as P. globosa
69
grazers and because of the scarcity of studies in particular in the eastern English Channel, our study
70
focused on the effects of phytoplankton variability on heterotrophic protists (ciliates and
71
dinoflagellates) as well as including copepods, consumers of both phytoplankton and heterotrophic
72 protists. 73 74 METHOD 75
Study site and Sampling
76 1 2 3 4 5 6 7 8 9 10 11 12 13 14 15 16 17 18 19 20 21 22 23 24 25 26 27 28 29 30 31 32 33 34 35 36 37 38 39 40 41 42 43 44 45 46 47 48 49 50 51 52 53 54 55 56 57 58
For Peer Review
Water samples were collected at the coastal station (50° 40’ 75 N, 1° 31’ 17E, 20-25 m water depth)
77
of the SOMLIT network (Service d’Observation du Milieu Littoral) in the eastern English Channel
78
(Strait of Dover, Fig. 1). The eastern English Channel is characterized by its tidal range, between 3
79
and 9 m, and a residual circulation parallel to the coast, where the continental inputs are restricted to
80
the coastal area and transported from south-west to north-east. This so-called ‘coastal flow’
81
(Brylinski et al., 1991) is separated from offshore waters by a tidally maintained frontal area
82
(Brylinski and Lagadeuc, 1990). Sampling was always carried out at high tide. Sampling was
83
conducted on 52 dates over the study period (22, 14, and 16 samples in 2007, 2008 and 2009,
84
respectively). Sampling frequency was planned to be weekly, during the period of growth and
85
senescence of the spring bloom and about every 2 weeks for the rest of the year. Actual sampling
86
frequency varied with weather conditions in the channel and thus, varied from a minimum of less
87
than a week (3 days) to a maximum of 57 days (overall mean and median frequency of 17 days and
88
14 days, respectively). Sub-surface sampling (2-3 m water depth) was conducted for phytoplankton
89
and microzooplankton, and vertical hauls for mesozooplankton.
90 91
Physico-chemical parameters and Chlorophyll-a (Chl-a)
92
Seawater temperature (T, °C) and salinity (S) were measured using a conductivity– temperature–
93
depth profiling system (CTD Seabird SBE 25). Inorganic nutrients concentrations were determined
94
from 100 mL samples with an Alliance Integral Futura Autoanalyser II for nitrate (NO3-), nitrite 95
(NO2-), silicate [(SiO4)4-] and phosphate (PO43-; Strickland and Parsons, 1972; Aminot and Kerouel, 96
2004). Chlorophyll-a (Chl-a) concentrations were measured on 90% (v/v) acetone extracted
97
particulate material isolated by filtration on GF/F glass-fibre filters (Whatman). Concentrations were
98
determined by fluorescence using a 10-AU Turner Designs© fluorometer (Lorenzen, 1966).
99
Particulate organic carbon (POC) was analyzed by filtering (<150 mm Hg) duplicate 50 to 200 mL
100
seawater samples through pre-combusted (4 to 5 h at 480°C) glass fibre filters (Whatman GF/F, 25
101
mm). Analysis was performed on a NA2100 Frisons CHN analyzer after drying filters at 60°C for
102
24 h and exposure to HCl 1 N vapors for 5 h.
103 104
Sample Analysis
105
Phytoplankton: For microphytoplankton floristic analysis, samples were fixed with
Lugol-106
glutaraldehyde solution (1% v/v; Breton et al., 2006) and examined using an inverted microscope
107
(Nikon Eclipse TE2000-S) after sedimentation in 5-25 mL Hydrobios chambers. Diatom carbon
108 1 2 3 4 5 6 7 8 9 10 11 12 13 14 15 16 17 18 19 20 21 22 23 24 25 26 27 28 29 30 31 32 33 34 35 36 37 38 39 40 41 42 43 44 45 46 47 48 49 50 51 52 53 54 55 56 57 58
For Peer Review
biomass was calculated on the basis of cell concentration and specific biometry using the
size-109
dependent relationship recommended by Menden-Deuer and Lessard (2000). Carbon biomass of the
110
Phaeocystis globosa colonies was calculated from biovolume measurements at x100 or x200
111
magnification, as previously described by Breton et al. (2006). The microphytoplankton was further
112
divided in two size groups: (i) Phytoplankton smaller than 100 µm (small colonies of P. globosa,
113
and diatoms) and (ii) phytoplankton larger than 100 µm (large colonies of P. globosa and large
114
diatoms). To enumerate nanophytoplankton (< 20 µm) 5 to 10 mL samples were preserved using
115
borax buffered formaldehyde (1% v/v). Samples were filtered onto black Nuclepore filters, (pore
116
size: 0.8 µm) and stained with DAPI (Porter and Feig, 1980) within 5 h of sampling and stored at –
117
20°C until counting. Cells were enumerated using a Leica FW4000 epifluorescence microscope at
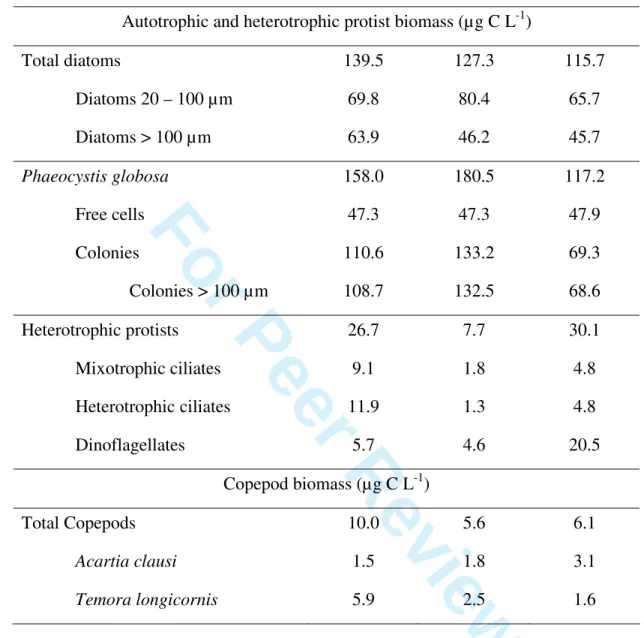
118
x1000. To distinguish between phototrophic and heterotrophic cells, autofluorescence (chlorophyll)
119
was determined under blue light excitation (BP 450-480 nm). Free colonial and flagellated
120
Phaeocystis cells are easily distinguished based on their morphology. Colonial cells are in the size
121
range of 4.5– 8 µm, have an anterior longitudinal groove and lack filamentous appendages.
122
Flagellated cells have a rounded shape, and are smaller than colonial cells, with a diameter of 3–5
123
µm (reviewed in Rousseau et al. 2007). Phototrophic nanoplankton consisted almost exclusively of
124
free P. globosa cells and cryptophytes (see results) and will be designated from now-on in the text
125
as phototrophic nanoflagellates (PNF).
126
Nano-sized diatoms were counted along with microphytoplankton as described above. For each
127
sample, at least 30 fields and at least 250 phototrophic nanoflagellates (PNF) were counted on each
128
filter. To estimate PNF biomass, biovolume was calculated based on the linear dimensions (length
129
and width) of cells using an image analyser with a camera mounted on the microscope. Biovolume
130
was then converted to biomass according to Menden-Deuer and Lessard (2000).
131
Heterotrophic protists: For heterotrophic protist enumeration, duplicate samples (250 mL) were
132
placed in opaque glass bottles. One 250 mL sample was fixed with acid Lugol’s solution (2% v/v)
133
for quantitative counts, and the other with borax buffered formaldehyde (1% v/v) for determination
134
of the trophic type of the ciliates, heterotroph or mixotroph, based on the presence or absence of
135
sequestered chloroplasts. The samples were then stored at 4°C in the dark until analysis (most often
136
within the following week and maximally 3 weeks later). Samples were further sedimented in 50 or
137
100 mL Hydrobios chambers for at least 24 h before enumeration using an Nikon Eclipse TE2000-S
138
inverted microscope at 200x or 400x magnification. Lugol’s fixed samples were enumerated and
139
sized with phase contrast. The formaldehyde-fixed samples were examined using blue light
140 1 2 3 4 5 6 7 8 9 10 11 12 13 14 15 16 17 18 19 20 21 22 23 24 25 26 27 28 29 30 31 32 33 34 35 36 37 38 39 40 41 42 43 44 45 46 47 48 49 50 51 52 53 54 55 56 57 58
For Peer Review
excitation (DM 500 nm dichromic mirror, BP 450 to 480 nm excitation filter, BA 515 nm barrier
141
filter and a 100 W mercury burner) to detect chlorophyll autofluorescence and to distinguish
142
plastidic from non-plastidic ciliates. Ciliates were identified wherever possible to genus or species
143
level following Kofoid and Campbell (1929) for tintinnid ciliates, the Planktonic Ciliate Project
144
(http://www.liv.ac.uk/ciliate/intro.htm), University of Liverpool, 2002, for spirotrich and other
145
ciliates, and following Schiller (1931-1937), Gomez and Souissi (2007) and Maar et al. (2002) for
146
heterotrophic dinoflagellates. Ciliates were further divided into 3 size groups (<20, 20-40, >40 µm)
147
and dinoflagellates in 5 size groups (<10, 10–20, 20-40, 40-60, >60 µm). Linear dimensions (length
148
and diameter) were measured at x400 magnification using an image analyser with a camera mounted
149
on the microscope. Biovolumes of cells were calculated assuming the nearest geometrical shape; for
150
this a minimum of 10 cells (for rare tintinnids) and a maximum of 300 cells (for the most abundant
151
Strombidium and Strobilidium) were measured. Biovolumes were converted to carbon biomass
152
using a conversion factor of 190 fg C µm–3 for ciliates (Putt and Stoecker, 1989) and 0,760 x
153
volume0.819 pg C µm-3 (Stoecker et al., 1994) for dinoflagellates.
154
Mesozooplankton: Zooplankton samples for quantitative analysis were collected by means of
155
vertical or sub-vertical hauls from the bottom to the surface, using a 200 µm mesh size WP2 net
156
(UNESCO, 1968). The volume filtered was measured with a TSK flow-meter, mounted on the
157
mouth of the net (0.25 m-2 mouth area). The filtered volume varied between 1 m-3 and 7 m-3. The
158
choice of mesh size, while preventing a quantitative study of copepod nauplii, was made as
159
compromise between sampling small metazoa and limiting and/or delaying the clogging of the net in
160
this eutrophic and turbid coastal area. Thus the lower values of filtered volume correspond to rapid
161
clogging of the net by tripton or phytoplankton (e.g. Phaeocystis globosa). After each haul, the
162
sample was preserved in a 5% buffered-formaldehyde seawater solution until laboratory analysis.
163
In the laboratory, all specimens were identified and counted in subsamples (1/10 to 1/30) of
164
the whole sample. Zooplankton species were determined under a binocular microscope following
165
Rose (1933) for the copepods and the Plankton identification Leaflets (ICES, 1939-2001) for the
166
other groups which were determined at different level (Phylum, Class, Order or Species). In order to
167
facilitate comparison with phytoplankton and microzooplankon, for total copepods and for the 2
168
dominant key species for the area, Acartia clausi and Temora longicornis biomass was also
169
estimated. Individual species-specific biomass for copepods was determined by measuring dry
170
weights and converted into carbon units assuming a 40% carbon content (Gorsky et al., 1988). A
171
minimum of 400 copepods were used to calculate conversion factors (401, 1153 and 545 copepods
172 1 2 3 4 5 6 7 8 9 10 11 12 13 14 15 16 17 18 19 20 21 22 23 24 25 26 27 28 29 30 31 32 33 34 35 36 37 38 39 40 41 42 43 44 45 46 47 48 49 50 51 52 53 54 55 56 57 58
For Peer Review
for Temora longicornis, Acartia clausi and other copepods). The averages of carbon per individual
173
copepod were 3.56±1.73, 1.59±0.41 and 2.34±2.63 µg C copepod-1 for Temora longicornis, Acartia
174
clausi, and other copepods, respectively. These empirical conversion factors determined from our
175
samples were then used to convert abundance into biomass data.
176 177
Data analysis
178
To portray temporal patterns of different phytoplankton and heterotrophic compartments considered
179
in this study the method of cumulated function (Ibanez et al., 1993) was used. This method can be
180
applied to portray trends in data series with missing values and does not require special conditions.
181
The calculation consists of subtracting a reference value (here for a biomass parameter we used the
182
annual mean of the series) from the data; the resulting residuals are then successively added,
183
forming a cumulative function. Successive positive residuals produce an increasing slope indicating
184
higher values than the overall mean, whereas successive negative residuals produce a decreasing
185
slope indicating values lower than the overall mean. A succession of values similar to the mean
186
show no slope.
187
(1)
188
Sp = consecutive terms of the cumulative sums 189
xt = value for each sampling date (t) 190
pk = annual mean 191
Spearman correlations were calculated using series of cumulative sums (Sp). These correlations
192
have an informative rather than an absolute value since the terms of cumulative sums are
193
autocorrelated. For this reason correlations can be relevant only if the correlation coefficient (r) is
194
highly significant (p = 0.01 so 1%) for the degrees of freedom considered.
195
Log-log plots of total phytoplankton, diatoms, colonies and free P. globosa cells were used to
196
investigate linkages with grazers, in particular ciliates and dinoflagellates (Irigoien et al. 2005).
197 198 RESULTS 199 Environmental parameters 200 1 2 3 4 5 6 7 8 9 10 11 12 13 14 15 16 17 18 19 20 21 22 23 24 25 26 27 28 29 30 31 32 33 34 35 36 37 38 39 40 41 42 43 44 45 46 47 48 49 50 51 52 53 54 55 56 57 58
For Peer Review
Salinity ranged from 33 to 35 and the seawater temperature from 4.6°C to 18.2°C (Fig. 2a).
201
Concentrations of inorganic nutrients exhibited typical seasonal patterns for this temperate coastal
202
area: Highest concentrations were recorded at the end of winter before the onset of the
203
phytoplankton bloom reaching 37.23 µM for NO3- + NO2-, 15.05 µM for (SiO4)4-, 0.77 µM for PO4 3-204
in 2007 (Table I); nutrient concentrations always dropped dramatically at the end of spring. A
205
decrease in the maximum value of inorganic nutrients was observed from 2007 to 2009 and this was
206
more pronounced for NO3- + NO2- concentrations (Table I). POC ranged from 114 to 1675 µg C L-1 207
in 2007 and from around 100 to 600 µg C L-1 in 2008 and 2009 (Table I)
208
Phytoplankton
209
Chlorophyll a (chl a) concentrations ranged from 0.8 to 20.3 µg Chla L-1 (Table I) with minima
210
during autumn/winter (October - February) and maxima in late spring (April-May, Fig. 2b). The
211
peak value of chl a concentration observed during spring coincided with the P. globosa bloom,
212
except in 2009 when the chl a maximum was due to diatoms and occurred before the peak of the
213
phytoplankton biomass (Fig. 2b). Total phytoplankton biomass ranged from 2 to 638 µg C L-1, with
214
a maximum in spring and a minimum in autumn/winter (from October to February Table II; Fig 2b).
215
Based on our data a highly significant empirical relationship between POC:chl and
216
Cphytoplankton:Chl was calculated (COP=92.0 + 47.6 [Chla], and Cphytoplankton=29.4 +
217
23.6[Chla], r2=0.425 and r2=0.552 with p<0.0001 respectively, figures not shown).
218
Phaeocystis globosa blooms are ephemeral and at our study site occurred from late March to
219
early May and lasted about one month each year (37, 27 and 29 days in 2007, 2008 and 2009,
220
respectively, Fig. 3b,c). During the blooms, P. globosa represented up to 93% of the
221
microphytoplankton and up to 100% of the nanophytoplankton biomass and large colonies (>100
222
µm) constituted most (56 to 93%) of the P. globosa biomass. With regard to inter-annual
223
differences, from 2007 to 2009 maximum biomass values increased for P. globosa colonies (from
224
316 to 392 µg C L-1) and free colonial cells (from 62 to 153 µg C L-1) while flagellated cells
225
decreased slightly (from 66 to 50 µg C L-1; Fig. 3c).
226
Diatoms were always present with mean biomass values of 92% of total phytoplankton
227
biomass over the study period. Diatom biomass ranged from 2 to 345 µg C L-1 (Table II). The mean
228
of diatom biomass during the spring bloom (from March to May) was lowest in 2009 and highest in
229
2007 (Table III). The diatom 20-100 µm size class was the most important for all years and showed
230
the highest biomass mean during the spring bloom in 2008 (Table III).
231 1 2 3 4 5 6 7 8 9 10 11 12 13 14 15 16 17 18 19 20 21 22 23 24 25 26 27 28 29 30 31 32 33 34 35 36 37 38 39 40 41 42 43 44 45 46 47 48 49 50 51 52 53 54 55 56 57 58
For Peer Review
We distinguished 3 distinct assemblages of diatoms. The first group, composed of cells
232
between 20-120 µm and characterized by Pseudonitzschia spp., and Chaetoceros spp., was present
233
during P. globosa blooms and persisted during the post-bloom period until August. In 2009 the
234
Pseudonitzschia spp. group also dominated the phytoplankton during the pre-bloom period (209 µg
235
C L-1 in early March; Fig. 3a). The second group, characterized by diatoms forming colonies (> 100
236
µm) such as Skeletonema costatum 5-20 µm length, Brockmaniella brockmanii and Ditylum
237
brightwelli 20-120 µm length, marked the early spring period. The third group appeared from the
238
end of summer to winter, composed of large fine-walled diatoms such as Guinardia spp.,
239
Rhizosolenia spp. and Chaetoceros spp.
240
Heterotrophic protists (ciliates and dinoflagellates)
241
The biomass of heterotrophic protists over the study period showed low values during
autumn-242
winter (0.6 to 20.0 µg C L-1) and higher values during spring-summer (2.8 to 61.1 µg C L-1). The
243
overall biomass of protists during the spring bloom was similar in 2007 and 2009 and greater than
244
that recorded for 2008 (Table III). Despite these differences, some common features were observed
245
every year: a) heterotrophic dinoflagellate biomass exceeded that of ciliates, except in spring 2007
246
(Fig. 4a), b) ciliates were almost equally divided between heterotrophs and mixotrophs (Fig. 4b).
247
Ciliate abundance and biomass over the study period ranged from 0.5 to 19.5 103 cells L-1
248
and from 0.4 to 58.1 µg C L-1, respectively (Table II). High abundance and biomass were recorded
249
in May 2007 and 2009, while in 2008 ciliate abundance and biomass were relatively low (<5.2 103
250
cells L-1 and <10 µg C L-1, Fig. 4a). The taxonomic composition of the ciliate community was
251
largely invariant over the 2.5 years and was dominated (86% of abundance) by Spirotrichs of the
252
genera Strombidium, Strobilidium, Leegardiella, Tontonia and the haptorid Myrionecta rubra.
253
Among heterotrophic aloricate ciliates, Strombidium lynni, Leegardiella sol, and Strobilidium
254
spiralis were present in all samples. Scuticociliates were occasionally present during the study in
255
particular after wind events in 2007 and 2008 (mean <1 µg C L-1). Tintinnids were insignificant
256
during the whole study and will not be further considered (max. 0.33 µg C L-1; mean 0.02 µg C L-1).
257
Carnivorous ciliates, the suctorians (Acineta sp. and Podophyra sp.) were present in low numbers
258
(up to 80 cells L-1). The mixotrophic community was essentially composed by Laboea strobila,
259
Tontonia spp, Strombidium acutum and S. capitatum. Myrionecta rubra was also present in large
260
numbers and biomass (up to 4.32 103 cells L-1, 8.02 µg C L-1) during different seasons, without a
261
marked seasonality (Fig. 4b). The biomass of heterotrophs and mixotrophs was in a similar range
262
(from 0.1-34.3 and 0.1–24.6 µg C L-1,respectively) to that of heterotrophs representing 55% and
263 1 2 3 4 5 6 7 8 9 10 11 12 13 14 15 16 17 18 19 20 21 22 23 24 25 26 27 28 29 30 31 32 33 34 35 36 37 38 39 40 41 42 43 44 45 46 47 48 49 50 51 52 53 54 55 56 57 58
For Peer Review
mixotrophs + M. rubra representing 45% of the mean ciliate biomass over the study period (Fig. 4b,
264
Table II). The alternation of heterotrophs/mixotrophs was particularly noticeable in 2008 when
265
outside of the period of dinoflagellate dominance, mixotrophic ciliates + M. rubra represented up to
266
62% of the ciliate biomass and 28% of the biomass of heterotrophic protists (Fig. 4b). The 20-40 µm
267
size class (11.5 ± 3.7 103 µm3) was the modal size-class for heterotrophs while mixotrophs were
268
dominated by the >40 µm size class (88.6 ± 35.4 103 µm3). However, it should be noted that in
269
spring 2009, Tontonia spp. alone represented 74.1% of the ciliate biomass and 51.9% of the ciliate
270
abundance.
271
Dinoflagellate biomass ranged from 0.2 to 51.9 µg C L-1 (Table II; Fig. 4a) and increased
272
from 2007 to 2009 (Table III) with the increase of the ratio of dinoflagellate to ciliate biomass
273
average during the spring bloom (from March to May), 0.3, 1.5 and 2.1 in 2007, 2008, 2009,
274
respectively, cf. Table III). The dinoflagellate community was composed almost exclusively of
275
heterotrophic species. The most abundant species (84% of abundance and 86% of biomass) were the
276
athecate forms such as Gyrodinium spirale, Spatulodinium pseudonoctiluca, Gymnodinium spp.
277
while thecate dinoflagellates were dominated by Protoperidinium spp. and Prorocentrum micans.
278
Dinoflagellates were particularly abundant during the pre-bloom period and at the end of the
279
Phaeocystis globosa bloom, when they accounted from 72.8 to 93.5% and up to 86.3% of the
280
heterotrophic protist biomass respectively; they were also abundant during the summer (52.7 to
281
81.1% of the biomass). In 2007 the assemblage of <20 (1.9 ± 1.0 103 µm3, Protoperidinium spp.)
282
and 20-40 µm (15.1 ± 7.3 103 µm3, G. spirale) size groups dominated the dinoflagellate community
283
(48% and 44% of dinoflagellate abundance respectively). In 2008 the larger size-class of 20-40 µm
284
was dominant yet still composed of Gyrodinium spirale and Protoperidinium spp. accounting from
285
19 to 94% with a mean of 51% of the dinoflagellate biomass. In 2009, the >40 µm size class was
286
dominant with the highest biomass (18 to 87% with mean of 46%).
287 288
Mesozooplankton
289
The abundance of mesozooplankton ranged from 0.6 to 13.9 ind. L-1 and was dominated by
290
copepods (0.03 to 10.9 ind. L-1) equal to 68.4% ± 22.4 of total abundance (Table II, Fig. 4c).
291
Copepod biomass ranged from 0.07 to 27.3 µg C L-1 (mean 6.4 ± 6.6 µg C L-1, Table II). The dominant
292
copepod species were Acartia clausi and Temora longicornis, which accounted for 44.4±18.8% and
293
23.3±15.7% of copepod abundance and 31.4±15.4% and 33.2±18.7% of copepod biomass,
294
respectively. Yet, we observed a change in relative abundances of these species during the spring
295 1 2 3 4 5 6 7 8 9 10 11 12 13 14 15 16 17 18 19 20 21 22 23 24 25 26 27 28 29 30 31 32 33 34 35 36 37 38 39 40 41 42 43 44 45 46 47 48 49 50 51 52 53 54 55 56 57 58
For Peer Review
bloom (from March to May). The Acartia to Temora ratio of average biomass values increased from
296
0.25 in 2007 to 1.9 in 2009 (Table III, Fig. 4c). Paracalanus parvus and Centropages hamatus were
297
also present in lower abundances and accounted for 7.0±5.4 and 13.6±13.3% of total copepod
298
abundance, respectively.
299
Pluteus and larvae of the urchin Echinocardium cordatum were present each year in spring during
300
less than 1 week and occurred between the two maxima of copepods (Fig. 4). Their highest
301
abundance was observed in May 2007 when they reached up to 11.3 ind. L-1 (up to 82% of
302
zooplankton abundance) and they were absent during the rest of the year. Appendicularians
303
(Oïkopleura dioica) feeding essentially on picoplankton, were also observed in low numbers (0 to
304
2.9 ind. L-1, mean 15.3±11.8% of the mesozooplankton abundance).
305 306
Temporal Trends based on cumulative sums
307
The cumulative sums show temporal trends in terms of differences from overall averages, temporal
308
variations not easily seen in figures such as Figures 3 and 4. We focused on the temporal trends of
309
the three major types of consumers (ciliates, dinoflagellates and copepods) and autotrophs (Fig.
5a-310
i).
311
In 2007 the ciliate biomass was strongly related with all phytoplankton compartments (Fig
312
5a-c, diatoms r = 0.88, P. globosa colonies r = 0.97 and free cells r = 0.93, n = 21, p < 0.0001). In
313
2008, no significant relation was observed with the phytoplankton and the ciliate cumulated sums
314
values remained close to the average annual biomass (more or less parallel to the x-axis, Fig. 5a-c).
315
In 2009, the ciliates related again with P. globosa colonies and free cells with a strong anomaly at
316
the end of April (Fig. 5a-b) which corresponds to a highest ciliate biomass recorded in 2009 (Fig.
317
5a).
318
Dinoflagellates showed a remarkable co-variation with total phytoplankton biomass during
319
the whole study (r = 0.51, n= 51, p < 0.0002; c.f. Fig. 5 d, e, f). Noteworthy is the fact that positive
320
slopes in phytoplankton cumulative function were in general observed before those of
321
dinoflagellates, except for P. globosa colonies and free cells in March 2007 (Fig. 5d-f). Overall,
322
dinoflagellates appeared to be tightly linked to bulk phytoplankton stocks as well as stocks of
323
Phaeocystis free cells, colonies as well as diatoms, despite changes in the composition of the diatom
324
assemblages.
325
Copepod biomass was also related tightly with the phytoplankton biomass overall (r = 0.70,
326
n = 51, p < 0.0001). However, in contrast to dinoflagellates there were some marked anomalies with
327 1 2 3 4 5 6 7 8 9 10 11 12 13 14 15 16 17 18 19 20 21 22 23 24 25 26 27 28 29 30 31 32 33 34 35 36 37 38 39 40 41 42 43 44 45 46 47 48 49 50 51 52 53 54 55 56 57 58
For Peer Review
regard to temporal trends of Phaeocystis colonies and diatoms (Fig. 5g-i). In 2008, copepod
328
cumulated sums remained close to the annual average but with a slight increase corresponding to the
329
bloom of P. globosa colonies in May (Fig. 5h). Considering heterotrophic protists as prey, Temora
330
longicornis were related to ciliate biomass (r = 0.42, n = 51, p < 0.002; data not shown) and Acartia
331
clausi to heterotrophic dinoflagellate biomass (r = 0.35, n = 51, p < 0.012; data not shown).
332 333
General Relationships
334
The plots of log transformed data of biomass of major phytoplankton groups and their potential
335
predators indicated curvilinear relationships. The biomass of total protists increased linearly with
336
total phytoplankton and levels around 70 µg C L-1 (Fig. 6a). The same type of relationship was
337
observed with ciliates vs PNF and dinoflagellates vs diatoms levelling around 50 and 30 µg C L-1,
338
respectively (Fig. 6b,c). The calculated regressions for the linear part of the relations, showed a
339
stronger relation for total phytoplankton vs protists, followed by PNF vs ciliates and dinoflagellates
340
vs diatoms (Fig. 6, a,b,c). The relationship between dinoflagellates and P. globosa colonies
341
suggested a curvilinear relationship, with dinoflagellate biomass decreasing for biomass higher than
342
1 µg C L-1 (Fig. 6d). The log-log plots of copepod biomass and auto- and heterotrophic protists did
343
not show any significant relationship.
344 345
DISCUSSION
346
To our knowledge, this is the first study exploring a 2.5 years data of both primary producers and
347
grazers in a system characterized by blooms of Phaeocystis. The primary aim of this study was to
348
determine whether variations of the phytoplankton community corresponded with changes in the
349
grazer community, especially with regard to heterotrophic protists. During our study, we observed
350
phytoplankton successions typical of the eastern English Channel and in the Southern Bight of the
351
North Sea with diatom blooms preceding Phaeocystis blooms (e.g., Breton et al., 2000; Rousseau et
352
al., 2002; Seuront and Vincent, 2008; Guiselin, 2010). The phenomenon is generally ascribed as a
353
succession in high nutrient coastal waters following silicate limitation of diatom production (e.g.,
354
Rousseau et al., 2000) or alternatively, due to light limitation of diatoms (Peperzak et al., 1998).
355
We found considerable variability in the Phaeocystis bloom as well as the diatom
356
assemblages preceding and following the bloom, similar to previous studies in the same area. For
357
example, Gomez and Souissi (2008), based on sampling at approximately monthly intervals from
358
1998 to 2005, reported declines of the P. globosa spring bloom in offshore but not inshore waters
359 1 2 3 4 5 6 7 8 9 10 11 12 13 14 15 16 17 18 19 20 21 22 23 24 25 26 27 28 29 30 31 32 33 34 35 36 37 38 39 40 41 42 43 44 45 46 47 48 49 50 51 52 53 54 55 56 57 58
For Peer Review
and shifts in diatom assemblages (Gomez and Souissi, 2007). During our study, the P. globosa
360
concentrations were close to values of the 1998 P. globosa bloom (Gomez and Souissi, 2008; Table
361
II). We encountered variability in bloom duration, composition in terms of colony sizes and relative
362
importance of non-colonial cells, as well as changes in the diatom assemblages, in particular the
363
diatom group of Pseudonitzschia spp. present usually during and after the bloom (Rousseau et al.,
364
2002; Guiselin, 2010), appeared before the P. globosa bloom in 2009. Moreover change in the
365
dynamics of P. globosa life stages was also observed from 2007 to 2009: increases of maximum
366
biomass of free cells (Fig. 3c), fewer small colonies (20-100 µm) and a slight increase of large
367
colonies (Fig. 3b).
368
Along with variability in the phytoplankton, we found marked changes among the grazer
369
communities, in terms of both compositional shifts and changes in abundance. In the heterotrophic
370
protist community, the most obvious difference was a shift from a dominance of spirotrich ciliates in
371
2007 to dinoflagellates, largely Gyrodinum spirale, dominating the protist community in 2008 and
372
2009. The ciliate community was, overall, similar in abundance and composition to those found in
373
other systems subject to Phaeocystis blooms. For example, Verity et al. (1993) reported ciliate
374
abundances during the spring bloom in the North Atlantic of 1.9 - 17.2 cells mL-1. The composition
375
of ciliates was comparable to that found the in Kattegat (Levinsen and Nielsen, 2002) and the
376
proportion of mixotrophic species + M. rubra we found (45% of the ciliate biomass) similar to the
377
values recorded for the North Sea (28% and 53% of the ciliate biomass nearshore and offshore
378
respectively; Stelfox-Widdicombe et al., 2004). The relatively low ciliate abundances found in 2008
379
and 2009 compared to 2007 correspond with lower concentrations of free cells of Phaeocystis (Fig.
380
3c; Fig. 4a), known to support ciliate growth (Tang et al., 2001) as well as lower concentrations of
381
copepods (Fig. 4c), the major predators of ciliates (e.g., Stoecker and Capuzzo, 1990; Christaki and
382
Van Wambeke, 1995; reviewed by Calbet and Saiz 2005).
383
Perhaps the most remarkable finding of our study is with regard to heterotrophic
384
dinoflagellates, largely the species putatively identified as Gyrodinium spirale. Abundance trends of
385
heterotrophic dinoflagellates closely tracked those of diatoms as well as colonies of Phaeocystis
386
(Fig. 5e,f). The biomass of heterotrophic dinoflagellates, in carbon units, was consistently about
387
10% of autotrophic biomass (see Fig. 3 and Fig. 4a) and they may have been the major consumers of
388
phytoplankton. Heterotrophic dinoflagellates, typically display low growth efficiencies and require
389
relatively high prey concentrations, relative to ciliate microzooplankton (Hansen, 1992; Strom and
390
Morello, 1998). However, they are capable of rapid growth given sufficient prey. In laboratory
391 1 2 3 4 5 6 7 8 9 10 11 12 13 14 15 16 17 18 19 20 21 22 23 24 25 26 27 28 29 30 31 32 33 34 35 36 37 38 39 40 41 42 43 44 45 46 47 48 49 50 51 52 53 54 55 56 57 58
For Peer Review
experiments, Protoperidinium species feeding on diatoms have daily division rates ranging from 0.5
392
- 2 per day (Menden-Deuer et al., 2005) and Gyrodinium spirale, feeding on other dinoflagellates,
393
divides about once per day rate in the presence of phytoplankton prey concentrations typical of our
394
study site, above 100 µg L-1, with gross growth efficiencies ranging from about 10 to 20 % (Kim
395
and Jeong, 2004). Employing these growth parameters, rough estimates suggest then a possibly
396
major role for heterotrophic dinoflagellate as phytoplankton grazers at our study site. While
397
heterotrophic dinoflagellates are known to be important grazers of diatoms (Sherr & Sherr 2007),
398
our data suggests a significant role as consumers of Phaeocystis as well.
399
Copepods dominated the mesozooplankton assemblage (68.4%, Table II) with the usual copepod
400
species found in the eastern English Channel and in the North Sea (Breton 2000, Rousseau et al.
401
2000, Brylinski 1986). Abundances of copepods (0.03 – 10.9 ind. L-1, Table II) were similar to those
402
previously recorded for the study site, November 1995 to July 1997 (Breton 2000). In our samples,
403
Acartia clausi and Temora longicornis were the most abundant species found during this study
404
(Table II). Brylinski (2009) reported that T. longicornis habitually dominate copepod abundance
405
during the spring and A. clausi during the summer.
406
During our study period, T. longicornis showed a decrease from 2007 to 2009 that
407
corresponded with the decrease of P. globosa bloom duration, fewer large Phaeocystis colonies (>
408
100 µm) and lower ciliate biomass (Table III). It is tempting to relate the decrease in Temora
409
longicornis to declines in ciliate biomass (r=0.42; cf. Results), as this species is thought to feed
410
selectively on ciliates and discriminate against both Phaeocystis (Hansen and Van Boekel, 1991;
411
Hansen et al., 1993) as well as dinoflagellates (Vincent and Hartmann, 2001). The species which
412
replaced Temora longicornis, Acartia clausi, while known to ingest ciliates (Gismervik and
413
Andersen, 1997), apparently does not selectively prey on them in natural populations (Tiselius,
414
1989). The correlation between A. clausi and dinoflagellate biomass can be attributed to A. clausi
415
preference for dinoflagellates over phytoplankton (Vargas and Gonzalez, 2004; Leising et al., 2005
416
a,b). With regard to the impact of copepod grazing on the communities of heterotrophic protists and
417
phytoplankton, some rough estimates can be made based on maximal reported clearance rates, 40
418
mL d-1 Temora-1 (Tiselius, 1989) and 30 mL d-1 Acartia-1, (Gismervik and Andersen, 1997) and our
419
peak copepod abundances (Fig. 4c). Such calculations suggest a weak control, clearing at most
420
about 15% of the water column per day in 2008 and 2009 in the Acartia dominated years compared
421
to 2007 in which peak populations of Temora may have been capable of clearing about 50% of the
422
water column per day. Nauplii of the 2 dominant copepod species were not quantitatively sampled
423 1 2 3 4 5 6 7 8 9 10 11 12 13 14 15 16 17 18 19 20 21 22 23 24 25 26 27 28 29 30 31 32 33 34 35 36 37 38 39 40 41 42 43 44 45 46 47 48 49 50 51 52 53 54 55 56 57 58
For Peer Review
in this work, we can speculate that nauplii maxima usually occur a few weeks before adult maxima
424
and they can eventually have an important grazing impact in phytoplankton; since in cultures they
425
can feed on the same range of prey as the adults (e.g. Isochrisis galbana of about 12 µm and
426
Rhodomonas marina 5-7 µm) (S. Souissi, Wimereux Marine Station, personal communication).
427 428
The log-log plots displayed curvilinear relationships between phytoplankton and predator. Irigoien
429
et al. (2005) using a large scale data set, observed the same type of relationship, observing a plateau
430
of microzooplankton biomass with increasing phytoplankton biomass at around 50 mg C m-3; which
431
they attributed to the presence of unfavourable prey and/or predation by mesozooplankton. In our
432
study microzooplankton also levelled at around this same value range (70 mg C m-3 Fig 6a). In the
433
plots of ciliates vs PNF and dinoflagellates vs diatoms, protistan biomass levelled at lower levels
434
(Fig. 6b, c; 50 and 30 mg C m-3, respectively) suggesting predation of copepods on
435
microzooplankton which may have favoured further phytoplankton accumulation. The log-log
436
relation between dinoflagellates and P. globosa colonies (Fig. 6d) indicated that while small
437
colonies (representative of low biomass) may be suitable prey for dinoflagellates, larger colonies
438
(representative of high biomasses) are more difficult to consume. Given that large colonies are
439
unsuitable for copepods, this could intensify predation on dinoflagellates (Fig. 6d). The cumulated
440
sum analysis showed some significant temporal relationships between copepods and phytoplankton
441
and between copepods and heterotrophic protists. While phytoplankton and protists have similar
442
growth rates, the absence of log-log relation between copepods and protists (autotrophic and
443
heterotrophic) can be attributed to the time lags between the appearance of prey and the predator (of
444
the order of days to weeks).
445 446
The more than two year’s sampling allowed assessment of the variability found in a "regular
447
and recurrent event", the phytoplankton blooms of the eastern English Channel. We found
448
differences in the phytoplankton blooms as well differences in the grazer assemblages, notably a
449
marked variability from one year to the other in abundances of ciliate microzooplankton and the
450
identity of the dominant copepod species. In contrast, heterotrophic dinoflagellates appear to be a
451
relatively consistent assemblage in terms of both their aggregate biomass compared to
452
phytoplankton, and their species composition. Heterotrophic dinoflagellates likely represent the
453
primary consumers of phytoplankton, but there is also indication that they suffer enhanced predation
454 1 2 3 4 5 6 7 8 9 10 11 12 13 14 15 16 17 18 19 20 21 22 23 24 25 26 27 28 29 30 31 32 33 34 35 36 37 38 39 40 41 42 43 44 45 46 47 48 49 50 51 52 53 54 55 56 57 58
For Peer Review
pressure by copepods particularly when large Phaeocystis colonies dominate the phytoplankton
455
assemblages.
456 457
Acknowledgements: This work was supported by the coastal national network SOMLIT and a PhD
458
grant from the French ministry of education for JDG. We thank the captain and the crew of the RV
459
‘Sepia II’, N. Degros for nutrient analyses for the SOMLIT data base and D. Vincent for assistance
460
with laboratory analyses and advice in data analysis. We are grateful to J. Dolan for very useful
461
discussions on our data and critical reading of the manuscript. We thank F. Schmitt and E. Christou
462
for advise during the revision of this paper. We would like to dedicate this paper to the memory of
463
Peter Verity whose work has been always an inspiration for plankton ecologists and of the present
464 work. 465 466 References 467
Aminot. A. and Kerouel, R. (2004) Dissolved organic carbon, nitrogen, and phosphorus in the N–E
468
Atlantic and the N–W Mediterranean with particular reference to non-refractory fractions and
469
degradation. Deep-Sea Res. I, 51, 1975--1999.
470
Breton, E. (2000) Qualité du pool nutritive et nutrition des copépodes pélagiques en Manche
471
orientale. PhD thesis, Université du Littoral-Côte d’Opale, France.
472
Breton, E., Brunet, C., Sautour, B. and Brylinski, J.-M. (2000) Annual variations of phytoplankton
473
biomass in the Eastern English Channel: comparison by pigment signatures and microscopic
474
counts. J. Plankton Res., 22, 1423--1440.
475
Breton, E., Rousseau, V., Parent, J.-Y., Ozer J. and Lancelot, C. (2006) Hydroclimatic modulation
476
of diatom/Phaeocystis blooms in nutrient-enriched Belgian coastal waters (North Sea). Limnol.
477
Oceanogr., 51, 1401--1409.
478
Brylinski J.-M. (1986) Method of detecting faunistic gradients: FCT curves. Zooplankton
479
distribution off Cape Gris-Nez (France). Oceanologica acta, 9, 457--467
480
Brylinski, J.-M. (2009) The pelagic copepods in the Strait of Dover (eastern English Channel). A
481
commented inventory 120 years after Eugène Canu. Cah. Biol. Mar., 50, 251--260.
482
Brylinski, J.-M. and Lagadeuc, Y. (1990) L’interface eau côtière/eau du large dans le Pas-de-Calais
483
(côte française): zone frontale. CR Acad. Sci. Paris, 311, 535--540.
484
Brylinski, J.-M., Lagadeuc, Y., Gentilhomme, V., Dupont, J.-P., Lafite, R., Dupeuple, P. A., Huault,
485
M. F., Auger, Y., Puskaric, E., Wartel, M. and Cabioch, L. (1991) Le ‘fleuve côtier’: un
486 1 2 3 4 5 6 7 8 9 10 11 12 13 14 15 16 17 18 19 20 21 22 23 24 25 26 27 28 29 30 31 32 33 34 35 36 37 38 39 40 41 42 43 44 45 46 47 48 49 50 51 52 53 54 55 56 57 58
For Peer Review
phénomène hydrologique important en Manche orientale (exemple du Pas de Calais). Oceanol.
487
Acta, 11, 197--203.
488
Calbet, A. and Saiz, E. (2005) The ciliate–copepod link in marine ecosystems. Aquat. Microb. Ecol.,
489
38, 157--167.
490
Christaki, U. and Van Wambeke, F. (1995) Simulated phytoplankton bloom input in top-down
491
manipulated microcosms: comparative effect of zooflagellates, ciliates and copepods. Aquat.
492
Microb. Ecol., 9, 137--147.
493
Gasparini, S., Daro, M.-H., Antajan, E., Tackx, M., Rousseau, V., Parent, J.-Y. and Lancelot, C.
494
(2000) Mesozooplankton grazing during the Phaeocystis globosa bloom in the Southern Bight of
495
the North Sea. J. Sea Res., 43, 345--356.
496
Gismervik, I. and Andersen, T. (1997) Prey switching by Acartia clausi: experimental evidence and
497
implications of intraguild predation assessed by a model. Mar. Ecol. Prog. Ser., 157, 247--259.
498
Gómez, F. and Souissi, S. (2007) Unusual diatoms linked to climatic events in the northeastern
499
English Channel. J. Sea Res., 58, 283--290.
500
Gómez, F. and Souissi, S. (2008) The impact of the 2003 summer heat wave and the 2005 late cold
501
wave on the phytoplankton in the north-eastern English Channel. C. R. Biologies, 331, 678--685.
502
Gorsky, G., Dallot, S., Sardou, J., Fenaux, R., Carre, C. and Palazzoli, I. (1988) Carbon and nitrogen
503
composition of some North Mediterranean zooplankton and micronekton species. J. Exp. Mar. Biol.
504
Ecol., 124,133--144.
505
Guiselin, N. (2010) Caractérisation des événements phytoplanctoniques en zone côtière : tests de
506
techniques alternatives et développement d’indicateurs de qualité des masses d’eau. PhD thesis,
507
Université du Littoral-Côte d’Opale, France.
508
Hansen, F. C. and Van Boekel, W. H. M. (1991) Grazing pressure of the calanoid copepod Temora
509
longicornis on a Phaeocystis dominated spring bloom in a Dutch tidal inlet. Mar. Ecol. Prog.
510
Ser., 78, 123--129.
511
Hansen, F. C. R., Reckermann, M., Klein Breteler, W. C. M. and Riegman, R. (1993) Phaeocystis
512
blooming enhanced by copepod predation on protozoa: evidence from incubation experiments.
513
Mar. Ecol. Prog. Ser., 102, 51--57.
514
Hansen, P. J. (1992) Prey size selection, feeding rates and growth dynamics of heterotrophic
515
dinoflagellates with special emphasis on Gyrodinium spirale. Mar. Biol., 114, 327--334.
516 1 2 3 4 5 6 7 8 9 10 11 12 13 14 15 16 17 18 19 20 21 22 23 24 25 26 27 28 29 30 31 32 33 34 35 36 37 38 39 40 41 42 43 44 45 46 47 48 49 50 51 52 53 54 55 56 57 58
For Peer Review
Ibanez, F., Fromentin, J.-M. and Castel, J. (1993) Application de la méthode des sommes cumulées
517
a l'analyse des séries chronologiques en océanographie. Cr Acad. Sci. Paris (Sci. Vie), 316,
745--518
748.
519
ICES Plankton Identification Leaflets, (1939-2001) (Including Fiches d’ldentification du
520
Zooplancton and ICES Identification Leaflets for Plankton, 1-187, and Fiches d’ldentification des
521
Oeufs et Larves de Poissons, 1-6), ISBN 87-7482-035-4,
http://www.wgze.net/identification-522
leaflets
523
Irigoien, X., Flynn, K.J. and Harris, R.P. (2005) Phytoplankton blooms: a ‘loophole’ in
524
microzooplankton grazing impact? J. Plankton Res., 27, 313--321.
525
Kim, J. S. and Jeong, H. J. (2004) Feeding by the heterotrophic dinoflagellates Gyrodinium
526
dominans and G Spirale on the red-tide dinoflagellate Prorocentrum minimum. Mar. Ecol. Prog.
527
Ser., 280, 85--94.
528
Kofoid, C. A. and Campbell, A. S. (1929) A conspectus of the marine and freshwater Ciliata
529
belonging to the suborder Tintinnoinea with descriptions of new species, principally from the
530
Agassiz Expedition to the eastern tropical Pacific, 1904-05. Univ. Calif. Publ. Zool. 34, 403 pp.
531
Lamy, D., Obernosterer, I., Laghdass, M., Artigas, L. F., Breton, E., Grattepanche, J.-D., Lecuyer,
532
E., Degros, N., Lebaron, P. and Christaki, U. (2009) Temporal changes of major bacterial groups
533
and bacterial heterotrophic activity during a Phaeocystis globosa bloom in the eastern English
534
Channel. Aquat. Microb. Ecol., 58, 95--107.
535
Lancelot, C. (1995) The mucilage phenomenon in the continental coastal waters of the North Sea.
536
Sci. Total Environ., 165, 83--102.
537
Lancelot, C., Keller, M. D., Rousseau, V., Smith, W. O. Jr and Mathot, S. (1998) Autecology of the
538
marine haptophyte Phaeocystis sp. In: Anderson DM, Cembella AD, Hallegraeff GM (eds)
539
Physiological ecology of harmful algal blooms. Springer- Verlag, Berlin, pp 209--224.
540
Leising AW, Pierson JJ, Halsband-Lenk C, Horner RA, Postel JR (2005a) Copepod grazing during
541
spring blooms: does Calanus pacificus avoid harmful diatoms? Prog. Oceanogr., 67, 384--405.
542
Leising AW, Pierson JJ, Halsband-Lenk C, Horner RA, Postel JR (2005b) Copepod grazing during
543
spring blooms: can Pseudocalanus newmani induce trophic cascades? Prog. Oceanogr.,
67,406--544
421.
545
Levinsen, H. and Nielsen, T. G. (2002) The trophic role of marine pelagic ciliates and heterotrophic
546
dinoflagellates in arctic and temperate coastal ecosystems: A cross-lattitude comparison. Limnol.
547 Oceanogr., 47, 427--439. 548 1 2 3 4 5 6 7 8 9 10 11 12 13 14 15 16 17 18 19 20 21 22 23 24 25 26 27 28 29 30 31 32 33 34 35 36 37 38 39 40 41 42 43 44 45 46 47 48 49 50 51 52 53 54 55 56 57 58
For Peer Review
Lorenzen, C. J. (1966) A method for continuous measurement of in vivo chlorophyll concentration.
549
Deep-Sea Res. I, 13, 223--247.
550
Maar, M., Nielsen, T. G., Richardson, K., Christaki, U., Hansen, O. S., Zervoudaki, S. and Christou,
551
E. D. (2002) Spatial and temporal variability of food web structure during the spring bloom in the
552
Skagerrak. Mar. Ecol. Prog. Ser., 239, 11--29.
553
Menden-Deuer, S. and Lessard, E. J. (2000) Carbon to volume relationships for dinoflagellates,
554
diatoms, and other protist plankton. Limnol. Oceanogr., 45, 569--579.
555
Menden-Deuer, S., Lessard, E. J., Satterburg, J. and Grünberg, D. (2005) Growth rates and
556
starvation survival of three species of the pallium-feeding thecate dinoflagellate genus
557
Protoperidinium. Aquat. Microb. Ecol., 41, 145--152.
558
Nejstgaard, J. C., Naustvoll, L. J. and Sazhin, A. (2001) Correcting for underestimation of
559
microzooplankton grazing in bottle incubation experiments with mesozooplankton. Mar. Ecol.
560
Prog. Ser., 221, 59--75.
561
Peperzak, L., Colijn, F., Gieskes, W. W. C. and Peeters, J. C. H. (1998) Development of the
diatom-562
Phaeocystis spring bloom in the Dutch coastal zone (North Sea): the silicon depletion versus the
563
daily irradiance hypothesis. J. Plankton Res., 20, 517--537.
564
Plankton Ciliate Project (2002) http://www.liv.ac.uk/ciliate/intro.htm, University of Liverpool.
565
Porter, K. G. and Feig, Y. S. (1980) The use of DAPI for identifying and counting aquatic
566
microflora. Limnol. Oceanogr. 25, 943--948.
567
Putt, M. and Stoecker, D. K. (1989) An experimentally determined carbon:volume ratio for marine
568
'oligotrichous' ciliates from estuarine and coastal waters. Limnol. Oceanogr., 34, 1097--1103.
569
Ribera d'Alcala, M., Conversano, F., Corato, F., Licandro, P., Mangoni, O., Marino, D., Mazzocchi,
570
M. G., Modogh, M., Montresor, M., Nardella, M., Saggiomo, V., Sarno, D. and Zingone, A.
571
(2004) Seasonal patterns in plankton communities in a pluriannual time series at a coastal
572
Mediterranean site (Gulf of Naples): an attempt to discern recurrences and trends. Sci. Mar., 68
573
(suppl 1), 65--83.
574
Rose, M. (1933) Copépodes pélagiques, Faune de France. Librairies de la faculté des sciences,
575
Paris, 26, 374 pp.
576
Rousseau, V., Becquevort, S., Parent, J.-Y., Gasparini, S., Daro, M. H., Tackx, M. and Lancelot, C.
577
(2000) Trophic efficiency of the planktonic food web in a coastal ecosystem dominated by
578
Phaeocystis colonies. J. Sea Res., 43, 357--372.
579 1 2 3 4 5 6 7 8 9 10 11 12 13 14 15 16 17 18 19 20 21 22 23 24 25 26 27 28 29 30 31 32 33 34 35 36 37 38 39 40 41 42 43 44 45 46 47 48 49 50 51 52 53 54 55 56 57 58
For Peer Review
Rousseau, V., Chrétiennot-Dinet, M.-J., Jacobsen, A., Verity P. and Whipple S. (2007) The life
580
cycle of Phaeocystis: state of knowledge and presumptive role in ecology. Biogeochem., 83,
29--581
47.
582
Rousseau, V., Leynaert, A., Daoud, N. and Lancelot, C. (2002) Diatom succession, silicification and
583
availability in Belgian coastal waters (southern North Sea). Mar. Ecol. Prog. Ser., 236, 61--73.
584
Scherffel, A. (1900) Phaeocystis globosa nov. spec. nebst einigen Betrachtungen über die
585
Phylogenie niederer, insbesondere brauner Organismen. Wissenschaftliche
586
Meeresuntersuchungen Abteilung Helgoland NF Bd 4, 1--29.
587
Schiller, J. (1931–1937) Dinoflagellatae (Peridinineae) in monographischer Behandlung. In:
588
Rabenhorst, L. (ed.), Kryptogamen-Flora von Deutschland, Österreichs und der Schweiz. Akad.
589
Verlag., Leipzig. Vol. 10 (3): Teil 1 (1–3) (1931–1933): Teil 2 (1–4) (1935–1937).
590
Seuront, L. and Vincent, D. (2008) Increased seawater viscosity, Phaeocystis globosa spring bloom
591
and Temora longicornis feeding and swimming behaviours. Mar. Ecol. Prog. Ser., 363,
131--592
145.
593
Sherr, E. B. and Sherr, B. F. (2007) Heterotrophic dinoflagellates: a significant component of
594
microzooplankton biomass and major grazers of diatoms in the sea. Mar. Ecol. Prog. Ser., 352,
595
187--197.
596
Stelfox-Widdicombe, C. E., Archer, S. D., Burkill, P. H. and Stefels, J. (2004) Microzooplankton
597
grazing in Phaeocystis and diatom dominated waters in the southern North Sea in spring. J. Sea
598
Res., 51, 37--51.
599
Stoecker, D. K. and Capuzzo, J. M. (1990) Predation on protozoa: its importance to zooplankton. J.
600
Plankton Res., 12, 891--908.
601
Stoecker, D. K., Gifford, D. J. and Putt, M. (1994) Preservation of marine planktonic ciliates: loss
602
and cell shrinkage during fixation. Mar. Ecol. Prog. Ser., 110, 293--299.
603
Strickland, J. and Parsons, T. (1972) A practical handbook of seawater analysis. Bull. Fish. Res.
604
Board Can., 167, 1--310.
605
Strom, S. (2002) Novel interactions between phytoplankton and microzooplankton: their influence
606
on the coupling between growth and grazing rates in the sea. Hydrobiologia, 480, 41--54.
607
Strom, S. L. and Morello, A. T. (1998) Comparative growth rates and yields of ciliates and
608
heterotrophic dinoflagellates. J. Plankton Res., 20, 571--584.
609 1 2 3 4 5 6 7 8 9 10 11 12 13 14 15 16 17 18 19 20 21 22 23 24 25 26 27 28 29 30 31 32 33 34 35 36 37 38 39 40 41 42 43 44 45 46 47 48 49 50 51 52 53 54 55 56 57 58