HAL Id: hal-02946643
https://hal.sorbonne-universite.fr/hal-02946643
Submitted on 23 Sep 2020
HAL is a multi-disciplinary open access
archive for the deposit and dissemination of
sci-entific research documents, whether they are
pub-lished or not. The documents may come from
teaching and research institutions in France or
abroad, or from public or private research centers.
L’archive ouverte pluridisciplinaire HAL, est
destinée au dépôt et à la diffusion de documents
scientifiques de niveau recherche, publiés ou non,
émanant des établissements d’enseignement et de
recherche français ou étrangers, des laboratoires
publics ou privés.
Circulating Receptor Activator of Nuclear Factor kB
Ligand and triglycerides are associated with progression
of lower limb arterial calcification in type 2 diabetes: a
prospective, observational cohort study
Olivier Bourron, Franck Phan, Mamadou Hassimiou Diallo, David Hajage,
Carole-Elodie Aubert, Aurélie Carlier, Joe-Elie Salem, Christian
Funck-Brentano, Salim Kemel, Philippe Cluzel, et al.
To cite this version:
Olivier Bourron, Franck Phan, Mamadou Hassimiou Diallo, David Hajage, Carole-Elodie Aubert, et
al.. Circulating Receptor Activator of Nuclear Factor kB Ligand and triglycerides are associated with
progression of lower limb arterial calcification in type 2 diabetes: a prospective, observational cohort
study. Cardiovascular Diabetology, BioMed Central, 2020, 19 (1), pp.140.
�10.1186/s12933-020-01122-4�. �hal-02946643�
ORIGINAL INVESTIGATION
Circulating Receptor Activator of Nuclear
Factor kB Ligand and triglycerides are
associated with progression of lower limb
arterial calcification in type 2 diabetes:
a prospective, observational cohort study
Olivier Bourron
1,2,6,18,21*, Franck Phan
1,2,6,18, Mamadou Hassimiou Diallo
3, David Hajage
19,
Carole‑Elodie Aubert
2, Aurélie Carlier
1,2,6, Joe‑Elie Salem
1,4,5,6, Christian Funck‑Brentano
1,4,5,6, Salim Kemel
1,7,8,
Philippe Cluzel
1,6,7,8, Alban Redheuil
1,6,7,8, Jean‑Michel Davaine
1, Ziad Massy
9, Romuald Mentaverri
10,
Dominique Bonnefont‑Rousselot
11,12, Philippe Gillery
13,14, Stéphane Jaisson
13,14, Cees Vermeer
15,
Jean‑Marc Lacorte
1,16,17, Nesrine Bouziri
20, Suzanne Laroche
1,2,6, Chloé Amouyal
1,2,6and Agnes Hartemann
1,2,6,18Abstract
Background: Lower limb arterial calcification is a frequent, underestimated but serious complication of diabetes. The
DIACART study is a prospective cohort study designed to evaluate the determinants of the progression of lower limb arterial calcification in 198 patients with type 2 diabetes.
Methods: Lower limb arterial calcification scores were determined by computed tomography at baseline and after
a mean follow up of 31.20 ± 3.86 months. Serum RANKL (Receptor Activator of Nuclear factor kB Ligand) and bone remodeling, inflammatory and metabolic parameters were measured at baseline. The predictive effect of these mark‑ ers on calcification progression was analyzed by a multivariate linear regression model.
Results: At baseline, mean ± SD and median lower limb arterial calcification scores were, 2364 ± 5613 and 527
respectively and at the end of the study, 3739 ± 6886 and 1355 respectively. Using multivariate analysis, the pro‑ gression of lower limb arterial log calcification score was found to be associated with (β coefficient [slope], 95% CI, p‑value) baseline log(calcification score) (1.02, 1.00–1.04, p < 0.001), triglycerides (0.11, 0.03–0.20, p = 0.007), log(RANKL) (0.07, 0.02–0.11, p = 0.016), previous ischemic cardiomyopathy (0.36, 0.15–0.57, p = 0.001), statin use (0.39, 0.06–0.72, p = 0.023) and duration of follow up (0.04, 0.01–0.06, p = 0.004).
Conclusion: In patients with type 2 diabetes, lower limb arterial calcification is frequent and can progress rapidly.
Circulating RANKL and triglycerides are independently associated with this progression. These results open new thera‑ peutic perspectives in peripheral diabetic calcifying arteriopathy.
Trial registration NCT02431234
© The Author(s) 2020. This article is licensed under a Creative Commons Attribution 4.0 International License, which permits use, sharing, adaptation, distribution and reproduction in any medium or format, as long as you give appropriate credit to the original author(s) and the source, provide a link to the Creative Commons licence, and indicate if changes were made. The images or other third party material in this article are included in the article’s Creative Commons licence, unless indicated otherwise in a credit line to the material. If material is not included in the article’s Creative Commons licence and your intended use is not permitted by statutory regulation or exceeds the permitted use, you will need to obtain permission directly from the copyright holder. To view a copy of this licence, visit http://creat iveco mmons .org/licen ses/by/4.0/. The Creative Commons Public Domain Dedication waiver (http://creat iveco mmons .org/publi cdoma in/ zero/1.0/) applies to the data made available in this article, unless otherwise stated in a credit line to the data.
Open Access
*Correspondence: olivier.bourron@aphp.fr
21 Diabetology Department, Pitié‑Salpêtrière Hospital, 47‑83 Boulevard de l’Hôpital, Paris, France
Page 2 of 9 Bourron et al. Cardiovasc Diabetol (2020) 19:140
Background
Arterial calcification is particularly prevalent in ageing, diabetes or renal failure [1]. Lower limb arterial calcifica-tion is observed in up to 50% patients with type 2 diabetes and is independently associated with cardiovascular mor-bidity, renal failure and mortality [2–4]. Due to its impli-cation in peripheral arterial occlusive disease (PAOD), a major complication of lower limb arterial calcification is amputation [4–6]. Although endovascular and open sur-gery are efficient procedures in diabetic PAOD, arterial calcification is a risk factor of arterial revascularization failure [7, 8]. Understanding the pathophysiology of the progression of peripheral arterial calcification is impor-tant in opening new therapeutic perspectives.
For a long time, the mechanism of arterial calcification was considered as a passive process resulting in the pre-cipitation and deposition of hydroxyapatite crystals. But now vascular calcification is considered as a complex and actively controlled molecular process of “arterial ossifi-cation”, involving the differentiation of vascular smooth muscle cells and other cells into osteoblast-like cells [4, 9, 10]. There is growing evidence that the OPG (osteo-protegerin)/RANKL(Receptor Activator of Nuclear fac-tor κB ligand) signaling axis could also play a central role [11, 12]. Others pathways are also suspected such as i) mechanical stress and hypertension, ii) induction of cal-cification by lipids, inflammation, glucose, advanced gly-cation end-products (AGEs) and their soluble receptor (sRAGE) [9, 13–15]. Furthermore, neuropathy could also participate in the calcification process [4].
The prospective DIACART study was designed to look at the potential determinants of lower limb arterial cal-cification progression in type 2 diabetes. The primary objective was to determine if the RANKL pathway is associated with the progression of lower limb arterial cal-cification in Type 2 Diabetes. Secondary objectives were to assess association between the others proteins of bone remodeling, traditional cardiovascular risk factors, mark-ers of inflammation, metabolic parametmark-ers and the pro-gression of lower limb arterial calcification.
Methods
Study design
The DIACART (for “DIAbète et Calcification ARTeri-elle”) study is a prospective monocentric cohort study [4]. The recruitment period extended from February to October 2014. Inclusion criteria were: Type 2 Diabetes with at least a history of coronary artery disease and/or peripheral arterial occlusive disease and/or age > 50 years
for men and > 60 years for women. Exclusion criteria were: [1] an estimated glomerular filtration rate (GFR) calculated by the modification of diet in renal disease equation < 30 ml/min, [2] a history of lower limbs angi-oplasty and/or bypass, or [3] type 1 diabetes. The study was approved by the local ethics committee and regis-tered in ClinicalTrials.gov (Identifier: NCT02431234). All patients were informed of the study objectives and pro-cedures. Participants gave their written informed consent of participation prior to inclusion.
Study follow‑up
At the inclusion visit and after a mean follow up of 31.2 ± 3.9 months (median 30.5 months and range 26-44.8 months), all patients had a clinical evaluation, laboratory blood tests, and helicoidal CT (computerized tomography) scans. Patient interviews focused on comor-bidities and their personal disease history. Their medical records were reviewed to check the clinical information and to record concomitant treatments. Ischemic cardio-myopathy was defined as a history of myocardial infarc-tion, acute coronary syndrome or any surgical procedures undergone due to coronary artery disease.
Assessment of peripheral neuropathy
The physician who performed the clinical tests was not informed of the calcification score nor the laboratory results. Peripheral neuropathy was assessed by the Neu-ropathy Disability Score (NDS) [16]. It assesses sensory vibration of the big toe using a 128-Hz tuning fork, tem-perature sense on the dorsum of the foot using a tuning fork with a beaker of ice or warm water, pinprick sense by applying a pin near the nail of the big toe and the Achilles reflex test. Each sensory test scores 0 for normal and 1 for abnormal sensation, on each foot. Achilles reflexes score 0 if they are present, 1 if they are present with reinforce-ment and 2 if they are absent, for each foot. An NDS ≥ 6 leads to the diagnosis of diabetic peripheral neuropathy.
Laboratory evaluations
Blood and urine samples were collected after an over-night fast for the measurement of routine biochemistry diagnostic tests, glucose, glycated hemoglobin (HbA1c), cholesterol (total and HDL), triglycerides, high-sensitiv-ity C-reactive protein (hsCRP), calcium, phosphate, urine albumin and creatinin.
Total OPG was measured by ELISA (ELISA MicroVue; Quidel Corporation), and soluble RANKL (sRANKL) concentrations were evaluated using the human RANKL
Single Plex kit from Millipore (Ref: HBN51K1RANKL; eBioscienceo). With this kit, the minimum detectable concentration of sRANKL is 4.8 pg/ml and inter- and intra-assay precision is below 6% coefficient of variation. The OPG to sRANKL concentration ratio was calculated for each patient without any postanalytical modifications.
Circulating total adiponectin concentrations were measured in serum using an enzyme-linked immuno-sorbent assay kit (ALPCO, Eurobio, Paris, France) as recommended by the manufacturer, with the lowest detection limit of 0.4 µg/ml for total adiponectin. Inter-assay coefficients of variation of low and high human pool controls for total adiponectin were 7.93% and 8.46%, respectively.
Selected assays (including desphospho–uncarboxy-lated MGP (dp-ucMGP) and total-uncarboxydesphospho–uncarboxy-lated MGP (t-ucMGP) assays) were performed on thawed samples, which had been frozen and stored at − 80 °C. A dual-antibody ELISA was used to measure dp-ucMGP levels; the capture antibody was directed against the non-phos-phorylated MGP sequence 3–15 (mAb-dpMGP; VitaK BV, Maastricht, Netherlands) and the detecting antibody was directed against the uncarboxylated MGP sequence 35–49 (mAb-ucMGP; VitaK BV). The same antibodies have already been used elsewhere for immunohistochem-ical staining [15, 17]. Intra-assay variability was 5,6% for dp-ucMGP and 8,9% for t-ucMGP, while inter-assay vari-ability was 9,9% for dp-ucMGP and 11,4% for t-ucMGP. A competitive (single-antibody) ELISA was used to meas-ure t-ucMGP levels, as described previously [18, 19].
Soluble RAGE (sRAGE) was measured on plasma samples with a commercially available ELISA kit (Quan-tikine Human RAGE Immunoassay, R&D Systems, Min-neapolis, USA; see http://www.rndsy stems .com/Produ cts/DRG00 for detailed description of the measurement method).
Advanced Glycation End products (Carboxymethylly-sine (CML), Methylglyoxal-derived hydroimidazolone1 (MG‐H1) and pentosidine) were determined on serum samples by liquid chromatography coupled with tandem mass spectrometry (API4000 system ABSciex, Les Ulis, France) [20]. AGEs concentrations were expressed as a ratio of total protein concentrations.
Total cholesterol and triglyceride concentrations were determined by an automated enzymatic method (Kon-elab, Thermoclinical Labsystems, Cergy Pontoise, France and Biomerieux, Marcy L’Etoile, France, respectively). HDL-cholesterol was measured by a direct method (Kon-elab). LDL-cholesterol was calculated using Friedewald’s equation on triglycerides ≤ 3.9 mmol/l or directly meas-ured when triglycerides were > 3.9 mmol/l using a Kon-elab kit. Inter- and intra-assay coefficients of variation were 2.2% and 0.9%, 1.3% and 0.9%, 3.5% and 0.97%, 1.3%
and 0.9%, respectively for total cholesterol, HDL-choles-terol, triglycerides and LDL-cholesHDL-choles-terol, respectively.
Serum human Fetuin A was evaluated using ELISA kit (TECOmedical Group, France) and was performed according to instructions provided by Epitope Diagnos-tics (intra-assay coefficient of variation: < 5.5%, inter-assay coefficient of variation: < 6.8%; detection limit of the assay: 5.0 ng/ml).
Serum human C-terminal FGF23 (Fibroblast Growth Factor 23) was determined using an ELISA kit (TECO-medical Group, France) and was performed according to the instructions provided by Immutopics (intra-assay coefficient of variation: < 2.4%, inter-assay coefficient of variation: < 4.7%; detection limit of the assay: 1.5 RU/ml).
IL-6 (Interleukine-6) was quantified using automated assays with Access 2 (Beckman Coulter Inc, Villepinte, France) according to the manufacturer’s instructions. IGF-1 (Insulin like Growth Factor 1), 25-hydroxyvitamin D, intact parathyroid hormone (iPTH) were measured by a single step chemiluminescence sandwich method on the Liaison XL (DiaSorin) analyzer. Because IGF-1 decreases with age, a standardized IGF-1 score was calculated as previously described [IGF-1 score = (log [IGF-1 (micro-grams per liter)] + 0.00625 × age − 2.555)/0.104] [21].
Assessment of insulin resistance
Insulin resistance was evaluated by the TyG index (tri-glycerides glucose index), which was calculated as ln(fasting triglycerides [mg/dL]*fasting glucose [mg/ dL]/2) [22].
Imaging for below‑knee arterial calcification score
Below-knee artery calcification score was obtained after scanning with a 128-slice multidetector dual source CT-scanner (Somatom Definition Flash, Siemens Health-ineers Healthcare, Erlangen, Germany) without contrast, from the base of the patella down to the ankle. Three mil-limeter cross-sectional slices were analyzed. The analysis was performed by radiologists who were blinded to the results of color duplex ultrasonography, laboratory tests or clinical examination, using a commercially available software package (Heartbeat CaScore, Philips Healthcare, Eindhoven, Netherlands). On cross-sectional images, areas of calcification along below-knee arteries with a density of ≥ 130 Hounsfield units attenuation and a sur-face area of > 1 mm2 were identified semi automatically. Calcification score, determined according to the method described by Agatston et al., was obtained separately for each of the main below-knee arteries (distal popliteal, anterior tibial, posterior tibial and peroneal arteries) and then added up to obtain the total calcification score [23]. Below-knee artery calcification scoring was performed at the inclusion visit and at the end of the study [4].
Page 4 of 9 Bourron et al. Cardiovasc Diabetol (2020) 19:140
Statistical analysis
Quantitative variables were described by their mean, standard deviation, median and quartiles Q1–Q3. Qualitative variables were described by their frequency and percentage. The effect of baseline serum RANKL on the progression of calcification of leg arteries between baseline and the end of the follow-up was ana-lyzed using univariable and multivariable linear regres-sion model adjusted on arterial calcification score at baseline. This method is fully equivalent to an analysis of covariance (ANCOVA). Distributions of biological parameters were checked graphically and those with a log-normal distribution were subsequently transformed before any analysis to improve normality. This model was adjusted on baseline cardiovascular risk factors and other factors known to be associated with vascu-lar calcification (age, gender, tobacco use, hypertension, waist circumference, BMI, triglycerides, total choles-terol, HDL-cholescholes-terol, LDL-cholescholes-terol, ApoA1, uri-nary albumin-creatinine ratio, HbA1c, lower limb log calcification score at baseline, hsCRP, parathormone, glomerular filtration rate (MDRD), and duration of fol-low up). Cook distance was used for the detection of highly influential observations on the coefficient esti-mates. A backward stepwise variable selection proce-dure based on the Akaike Information Criterion was used to select the final multivariate model. Coefficient estimates were provided with their corresponding 95% confidence intervals.
The effects of other bone remodeling factors, markers of inflammation and glycation (Calcium, iPTH, OPG, MGP, IGF-1, Fetuin A, FGF-23, hsCRP, IL-6, carboxymé-thyllysine, MG-H1, pentosidine, RAGE) were evaluated with multivariate linear regression model using the same procedure.
Significance was defined as p-values of less than 0.05. Statistical analyses were performed using R 3.5.1 (http:// www.R-proje ct.org).
Sample size
It was assumed that the correlation between the loga-rithm of the serum RANKL level and the logaloga-rithm of the artery calcification score at 2 years, adjusted on the covariates, is about 0.20 (or an R2 of 0.04). In addition, it was assumed that the multivariate linear model (based on RANKL and associated risk factors) will explain about 15% of the variability. Under these assumptions, at least 169 patients were needed to demonstrate a significant effect of RANKL on the calcification score with an alpha risk of 5% (bilateral formulation) and a power of 80%. In order to take into account 15% of patients lost to follow-up, 198 subjects were planned for the study.
Results
At baseline, a total of 198 patients were included in the DIACART study. During the study follow-up (mean 31.2 ± 3.9 months; median 30.5 months and range 26–44.8), 18 patients were lost to follow up and 11 patients died before the second determination of calci-fication score. RANKL measurements were missing in 6 patients. This led to 163 evaluable patients.
Patients’ characteristics
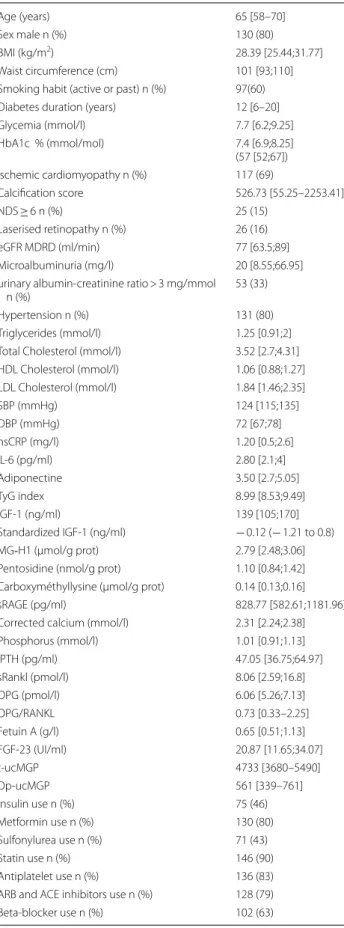
The characteristics of the participating patients at base-line (n = 163) are presented in Table 1. At baseline, patients were predominantly middle aged (median [Q1– Q3], 65 years [58–70]) overweight (median [Q1–Q3] BMI, 28.39 kg/m2 [25.44;31.77]) male (80%), with a long duration of diabetes (median [Q1–Q3], 12 years [6–20]), and a relatively good glycemic control (median [Q1–Q3] HbA1c, 7.4% [6.9;8.25]; 57 mmol/mol [52;67]). Less than 20% of the patients had laserized retinopathy or neuropa-thy. Nearly a third of the patients had nephropathy but the GFR (median [Q1–Q3], 77 ml/min [63.5;89]) was relatively preserved as expected since a GFR of < 30 ml/ min was an exclusion criterion. Most of the patients had ischemic cardiomyopathy (69%), were smokers (60%) and treated for hypertension (80%) with arterial pressure at target (126 ± 17 mmHg). They often took statins (90%), antiplatelet therapies (83%), β-blockers (63%) and renin-angiotensin system inhibitors (79%). Diabetes was often treated with metformin, insulin and sulfonylurea (respec-tively 79%, 57% and 46%).
Progression of lower limb calcification and independent predictors
At baseline, mean ± SD and median lower limb arterial calcification scores were 2364 ± 5613 and 527 respec-tively. At the end of the study, mean ± SD and median arterial lower limb calcification scores were 3739 ± 6886 and 1355 respectively. In Table 2, lower limb arterial cal-cification scores are shown for all patients and according to circulating RANKL quartiles at baseline.
In univariate analysis (cf Table 3), lower limb log cal-cification score at the end of follow-up is correlated with (β coefficient [slope], 95% CI, p-value) baseline log calcification score (0.88, 0.81–0.95, p < 0.001), age (0.15, 0.06–0.25, p < 0.001), male sex (3.51, 1.64–5.38, p < 0.001), tobacco use (for patients without tobacco consumption, − 1.69; − 3.27 to − 0.12, p = 0.0035), ischemic cardiomy-opathy (3.73, 2.15–5.32, p < 0.001), MDRD (− 0.06, − 0.10 to − 0.02, p = 0.005), t-ucMGP (− 2.74, − 4.85 to − 0.64, p = 0.011), dp-ucMGP (1.61, 0.53–2.70, p = 0.004), Fetuin A (− 1.82, − 3.36 to − 0.29, p = 0.02), pentosidine (2.16, 0.35–3.96, p = 0.02), CML (1.61, 0.53–2.70, p = 0.004),
MG-H1 (− 3.15, − 5.79 to − 0.51, p = 0.020) and iPTH (0.04, 0.01–0.07, p = 0.012). But peripheral neuropa-thy (defined by NDS ≥ 6) was not associated with lower limb arterial calcification progression (0.15, − 0.86–1.17, p = 0.765). HbA1c, diabetes duration, calcemia, phospho-remia, RAGE, Fetuin A, FGF-23, IGF-1, LDL-cholesterol, HDL-cholesterol, total cholesterol, blood pressure, BMI, hsCRP and IL-6 were also not associated with lower limb arterial calcification progression.
In multivariate analysis (cf Table 4), and after exclusion of highly influential observations, progression of lower limb arterial calcification was associated with (β coeffi-cient [slope], 95% CI, p-value) baseline log calcification score (1.02, 1.00–1.04, p < 0.001), duration of follow up (0.04, 0.01–0.06, p = 0.004), ischemic cardiomyopathy (0.36, 0.15–0.57, p = 0.001), statin use (0.39, 0.06–0.72, p = 0.023), triglycerides (0.11, 0.03–0.20, p = 0.007) and log RANKL (0.07, 0.02–0.11, p = 0.016). Similarly, the analysis of the predictive power of the others biomark-ers showed that Log(OPG/RANKL ratio) was also asso-ciated with lower limb arterial calcification progression (− 0.06, − 0.12–0, p = 0.03) while OPG alone (− 0.15, − 0.52–0.23, p = 0.409) was not. Other markers poten-tially involved in arterial calcification pathophysiology were not implicated in lower limb arterial calcification progression in the DIACART study.
Discussion
Our study confirms that the prevalence of arterial calci-fication in the lower limbs of patients with type 2 diabe-tes and with a high cardio-vascular risk is high, but also shows that this pathological process progresses signifi-cantly. The association of the calcification progression with the severity of pre-existing calcification, the dura-tion of follow-up and a history of ischemic cardiomyopa-thy has already been described. But our results highlight the putative role of the RANK/RANKL pathway and cir-culating triglycerides in this phenomenon.
Table 1 Baseline characteristics of the patients (n = 163)
Age (years) 65 [58–70]
Sex male n (%) 130 (80)
BMI (kg/m2) 28.39 [25.44;31.77]
Waist circumference (cm) 101 [93;110] Smoking habit (active or past) n (%) 97(60) Diabetes duration (years) 12 [6–20]
Glycemia (mmol/l) 7.7 [6.2;9.25] HbA1c % (mmol/mol) 7.4 [6.9;8.25] (57 [52;67]) Ischemic cardiomyopathy n (%) 117 (69) Calcification score 526.73 [55.25–2253.41] NDS ≥ 6 n (%) 25 (15) Laserised retinopathy n (%) 26 (16) eGFR MDRD (ml/min) 77 [63.5;89] Microalbuminuria (mg/l) 20 [8.55;66.95] urinary albumin‑creatinine ratio > 3 mg/mmol
n (%) 53 (33)
Hypertension n (%) 131 (80)
Triglycerides (mmol/l) 1.25 [0.91;2] Total Cholesterol (mmol/l) 3.52 [2.7;4.31] HDL Cholesterol (mmol/l) 1.06 [0.88;1.27] LDL Cholesterol (mmol/l) 1.84 [1.46;2.35] SBP (mmHg) 124 [115;135] DBP (mmHg) 72 [67;78] hsCRP (mg/l) 1.20 [0.5;2.6] IL‑6 (pg/ml) 2.80 [2.1;4] Adiponectine 3.50 [2.7;5.05] TyG index 8.99 [8.53;9.49] IGF‑1 (ng/ml) 139 [105;170] Standardized IGF‑1 (ng/ml) − 0.12 (− 1.21 to 0.8) MG‐H1 (µmol/g prot) 2.79 [2.48;3.06] Pentosidine (nmol/g prot) 1.10 [0.84;1.42] Carboxyméthyllysine (µmol/g prot) 0.14 [0.13;0.16]
sRAGE (pg/ml) 828.77 [582.61;1181.96]
Corrected calcium (mmol/l) 2.31 [2.24;2.38] Phosphorus (mmol/l) 1.01 [0.91;1.13] iPTH (pg/ml) 47.05 [36.75;64.97] sRankl (pmol/l) 8.06 [2.59;16.8] OPG (pmol/l) 6.06 [5.26;7.13] OPG/RANKL 0.73 [0.33–2.25] Fetuin A (g/l) 0.65 [0.51;1.13] FGF‑23 (UI/ml) 20.87 [11.65;34.07] t‑ucMGP 4733 [3680–5490] Dp‑ucMGP 561 [339–761] Insulin use n (%) 75 (46) Metformin use n (%) 130 (80) Sulfonylurea use n (%) 71 (43) Statin use n (%) 146 (90) Antiplatelet use n (%) 136 (83) ARB and ACE inhibitors use n (%) 128 (79) Beta‑blocker use n (%) 102 (63)
Table 1 (continued)
Data are given as median (and quartiles Q1–Q3) or as the number (and percentage) for binary variables
ARB angiotensin receptor blockers, ACE angiotensin converting enzyme, BMI
body mass index, CVD cardiovascular disease, DBP diastolic blood pressure,
FGF-23 fibroblast growth factor 23, eGFR MDRD estimated glomerular filtration
rate calculated with the modification of diet in renal disease formula, HbA1c haemoglobin A1C, HDL high density lipoprotein, hsCRP high sensitivity C-reactive protein, IGF-1 insulin growth factor-1, IL-6 interleukin 6, iPTH intact parathyroid hormone, LDL low density lipoprotein, MG‐H1
Methylglyoxal-derived hydroimidazolone1, dp-ucMGP desphospho-uncarboxylated matrix gla protein, t-ucMGP Total uncarboxylated matrix gla protein, NDS neuropathy disability score, OPG osteoprotegerin, SBP systolic blood pressure, sRAGE soluble form of receptor for advanced glycation end products, sRANKL soluble form of Receptor Activator of Nuclear factor kB Ligand, TyG triglyceride glucose index
Page 6 of 9 Bourron et al. Cardiovasc Diabetol (2020) 19:140
RANKL/RANK/OPG system and lower limb arterial calcification
Our results suggest that an emerging pathway in arte-rial calcification pathophysiology is the RANKL/RANK/ OPG system. RANKL, which is produced by osteo-blasts, vascular cells, stromal cells, T-cells, macrophages and monocytes, binds to its receptor RANK which is expressed by osteoclasts but also by vascular smooth muscular cells (VSMCs). This binding activates several downstream targets such as the Nuclear Factor-kappa B (NFkB). In contrast, OPG acts as a decoy receptor block-ing the RANKL-RANK interaction [24]. RANKL actively promotes vascular calcification by inducing, via its recep-tor RANK, differentiation of VSMCs into osteoblast-like cells [12, 25]. RANK is a member of the Tumor Necro-sis Factor Receptor (TNFR) superfamiliy, and TNFR- 1 is associated with the risk of major amputation in diabe-tes [26]. OPG was shown to be associated with carotid intima-media thickness in T2D patients [27] and is also suspected to be involved in the regulation of the vascu-lar calcification process. Indeed, OPG-deficient mice develop accelerated arterial calcification whereas inacti-vation of RANKL signaling in these mice counteracts this effect [28]. This suggests that RANKL plays a central role in the regulation of vascular calcification, whereas OPG would rather play a modulatory function. In human, both tissue and serum RANKL have been associated with lower limb artery and carotid calcification [12, 29]. The RANKL/OPG ratio has also been correlated with the cor-onary artery calcium score [30]. In the DIACART study, both circulating RANKL and RANKL/OPG ratio, but not serum OPG, were correlated with the progression of lower limb arterial calcification. Thus when circulating RANKL concentration increases, it would be associated with an acceleration of the arterial calcification process.
Lipids and lower limb arterial calcification
We also found and association between plasma triglyc-erides and the progression of lower limb arterial calci-fication. However we did not find any correlation of the calcification progression with others lipids, although sortilin, which is implicated in lipid metabolism,
extra-cellular matrix mineralization and atherosclerotic plaque burden, was recently found to be associated with the presence of PAOD in T2D [31]. Previous studies have shown a relationship between triglycerides and coronary artery calcium score progression in patients with or with-out diabetes [32, 33]. When accumulated in the tissue, triglycerides can generate species such as free fatty acids, sphingolipids and particularly ceramides, which could induce pathophysiological pathways involved in vascu-lar calcification. Saturated fatty acids are associated with vascular disease and with the development of vascular smooth muscle cell calcification via the NF-kB pathway induction [34]. Among sphingolipids species, ceramides are known to induce human vascular smooth muscle cell calcification via p38 mitogen-activated protein kinase signaling [35]. It would be interesting to study the role of lipid derivatives, such as sphingolipids, on lower limb vascular calcification development occurring in type 2 diabetes.
Insulin resistance and lower limb arterial calcification
Circulating triglycerides are also a strong marker of insu-lin resistance and visceral obesity. However in our study others biomarkers of insulin resistance and/or visceral obesity (Triglyceride-Glucose index (TyG index), waist circumference and serum adiponectin) did not correlate with the progression of lower limb vascular calcification. This suggests that triglycerides act through an independ-ent pathway to insulin resistance and visceral obesity.
Inflammation and lower limb arterial calcification
Recently low levels of Omentin-1, which is an adipokine with anti-inflammatory properties, were shown to be associated with the presence and severity of PAOD in T2D [36]. However inflammatory markers like IL-6 and hsCRP were not associated with the progression of the calcification in our study.
Therapeutic perspectives
Denosumab is a human monoclonal antibody which inhibits the RANKL pathway. It is one of the latest therapeutic options for osteoporosis [37]. It has been
Table 2 Calcium score at baseline and at the end of the follow-up in all the population and according to circulating RANKL quartiles (n = 163)
Data are given as median (and quartiles Q1–Q3). sRANKL soluble form of Receptor Activator of Nuclear factor kB Ligand
All sRANKL quartiles
< Q1 [Q1–Q2] [Q2–Q3] > Q3
Calcium score at
baseline 527 [55–2253] 1200 [152–2311] 535 [66–1339] 384 [237–3175] 815 [55–4488] Calcium score at the
shown that Denosumab attenuates aortic calcification in a murine model [38]. However, in the human, a study has prospectively explored the effects of 12 months of Denosumab treatment on coronary artery calcium scores in 48 patients on hemodialysis [39]. Interest-ingly, the coronary artery calcium score of patients treated with Denosumab did not increase, even though these patients had very high coronary artery calcium scores at baseline. These data suggest that Denosumab could at least stop the progression of vascular calcifica-tion in patients highly exposed to this risk. But inter-ventional studies are needed to determine if targeting RANKL may be beneficial in peripheral arterial calcifi-cation progression in type 2 diabetes.
To our knowledge, the effect of fibrates on arterial calcification has not been explored. Hence, targeting triglycerides could be another interesting therapeutic path to take.
As previously reported with accelerated coronary artery calcification in T2D patients with advanced ath-erosclerosis, statin use is associated with the progres-sion of lower limb arterial calcification in our study [40]. Statins are thought to increase the density of arte-rial calcification to improve plaque stability but don’t seem able to reduce lower limb arterial calcification progression.
The strengths of the present study are its prospective design, the objective quantitative assessment of arte-rial calcification by CT, the measurement of numerous original markers and the use of a high sensitive kit to measure RANKL. The limitations are the relative small sample size, the absence of a non-diabetic control pop-ulation, and the absence of distinction between intima and medial calcification [41]. In addition, uncalcified plaques were not assessed in this study.
Table 3 Univariate linear regression analysis: variables associated with calcification score at the end of follow-up (n = 163 patients; mean follow-up duration = 31.20 ± 3.86 months)
BMI body mass index, DBP diastolic blood pressure, FGF-23 fibroblast growth
factor 23, eGFR MDRD estimated glomerular filtration rate calculated with the modification of diet in renal disease formula, HbA1c haemoglobin A1C,
hsCRP high sensitivity C-reactive protein, IGF-1 insulin growth factor-1, IL-6
interleukin 6, iPTH intact parathyroid hormone, MG‐H1 Methylglyoxal-derived
hydroimidazolone1, dp-ucMGP desphospho-uncarboxylated matrix gla protein,
t-ucMGP Total uncarboxylated matrix gla protein, NDS neuropathy disability
score, OPG osteoprotegerin, sRAGE soluble form of receptor for advanced glycation end products, sRANKL soluble form of Receptor Activator of Nuclear factor kB Ligand, TyG triglyceride glucose index
p-values indicating significance are shown in italics type
β coefficient [slope]
IC 95 p value
Log(calcium score at baseline) 0.88 [0.81;0.95] < 0.001
Follow‑up duration − 0.07 [− 0.27;0.13] 0.49
Age 0.15 [0.06;0.25] 0.001
Sex (male) 3.51 [1.64–5.38] < 0.001
Smoking habits (never) − 1.69 [− 3.27 to − 0.12] 0.03
Hypertension (absence) − 0.75 [− 2.72 to 1.22] 0.45
BMI − 0.05 [− 0.2 to 0.09] 0.48
Waist circumference 0 [− 0.02 to0.03] 0.75
HbA1c 0.05 [− 0.53 to 0.62] 0.87 Diabetes duration 0.07 [− 0.01;0.14] 0.09 NDS ≥ 6 0.15 [− 0.86 to 1.17] 0.76 Ischemic cardiomyopathy 3.73 [2.15–5.32] < 0.001 eGFR MDRD − 0.06 [− 0.01; − 0.02] 0.005 hsCRP − 0.16 [− 0.47 to 0.16] 0.32 Log IL‑6 1.05 [− 0.22 to 2.32] 0.10 Triglycerides 0.43 [− 0.3 to 1.16] 0.25 Cholesterol total − 0.51 [− 1.39 to 0.37] 0.25 HDL − 2.01 [− 4.27 to 0.25] 0.08 LDL 0.56 [− 1.6 to 0.48] 0.29 Log(sRANKL) 0.04 [− 0.39 to 0.46] 0.86 Log(OPG) 1.84 [− 1.14 to 4.83] 0.22 Log(OPG/sRANKL) 0 [− 0.41 to 0.41] 0.99 iPTH 0.04 [0.01–0.07] 0.01
Log (Corrected calcium) − 9.99 [− 26 to 6.02] 0.22
Log(t‑ucMGP) − 2.74 [− 4.85 to − 0.64] 0.01 Log(dp‑ucMGP) 1.61 [0.53–2.7] 0.004 Log(FGF‑23) 0.56 [− 0.03 to 1.16] 0.06 Log(Fetuine A) − 1.82 [− 3.36 to − 0.29] 0.02 Log(Pentosidine) 2.16 [0.35‑3.96] 0.02 Log(Carboxymethylysine) 1.30 [− 2.67 to 5.27] 0.52 Log(MG‑H1) − 3.15 [− 5.79 to − 0.51] 0.02 Log(sRAGE) 0.69 [− 0.79 to 2.16] 0.36 Log(IGF‑1) − 2.06 [− 4.15 to 0.02] 0.05 Standardized IGF‑1 − 0.24 [− 0.75 to 0.27] 0.36 Log adiponectin 1.59 [0.12–3.06] 0.03 TyG INDEX 0.02 [− 0.02 to 0.06] 0.25 Statin use 1.62 [− 0.93;4.17] 0.21
Table 4 Final multivariate linear regression model: variables independently associated with the progression of calcification score during follow-up (n = 163 patients; mean follow up duration = 31.2 ± 3.86 months)
OPG osteoprotegerin, sRANKL soluble form of Receptor Activator of Nuclear
factor kB Ligand
p-values indicating significance are shown in italics type
β IC95 p value
Log(calcium score at baseline) 1.02 [1–1.04] < 0.001 Follow‑up duration 0.04 [0.01; 0.06] 0.004 Ischemic cardiomyopathy 0.36 [0.15; 0.57] 0.001 Log(sRANKL) 0.07 [0.02; 0.11] 0.016 Log(OPG/sRANKL) − 0.06 [− 0.12–0] 0.03 Triglycerides 0.11 [0.03; 0.2] 0.007 Statin use 0.39 [0.06; 0.72] 0.023
Page 8 of 9 Bourron et al. Cardiovasc Diabetol (2020) 19:140
Conclusions
Lower limb arterial calcification, which has serious clinical consequences, is a frequent pathological pro-cess in patients with type 2 diabetes and high cardio-vascular risk. It progresses rapidly. The demonstration of the association of RANKL and triglycerides with this progression open up new therapeutic perspectives. Further interventional studies are therefore required to address these issues fully.
Abbreviations
AGEs: Advanced glycation end‑products; BMI: Body Mass Index; CML: Car‑ boxymethyllysine; DIACART : Acronym of « DIAbète et Calcification ARTerielle »; dp‑ucMGP: Desphospho–uncarboxylated Matrix Gla Protein; GFR: Glomerular filtration rate; HbA1c: Glycated hemoglobin; hsCRP: High‑sensitivity C‑reactive protein; IGF‑1: Insulin like growth factor 1; IL‑6: Intelukine‑6; iPTH: intact para‑ thyroid hormone; MG‐H1: Methylglyoxal‑derived hydroimidazolone1; NDS: Neuropathy disability score; OPG: Osteoprotegerin; PAOD: Peripheral arterial occlusive disease; RANK: Receptor Activator of Nuclear factor κB; RANKL: Receptor Activator of Nuclear factor κB Ligand; sRAGE: Soluble receptor of advanced glycation end‑products; sRANKL: Soluble RANKL; t‑ucMGP: Total‑ uncarboxylated Matrix Gla Protein; TyG index: Triglycerides glucose index.
Acknowledgements
The authors thank all the patients, investigators, and CIC‑1901 staff members involved in the conduct of the trial. We would also like to thank Dr. Froogh Darakhshan ‑ Hajduch (Anglais Pour Vous, Melun, France) for professional edit‑ ing of the article.
Authors’ contributions
FP, C‑EA, AC, MH, J‑ES, CF‑B, SK, AR, PC, J‑MD, ZM, RM, DB‑R, PG, SJ, CV, J‑ML, SL and CA contributed to the acquisition and interpretation of the data. MHD and DH contributed to the acquisition of the data and performed statistical analysis. AH and OB contributed to the study design, to the acquisition and interpretation of the data. OB drafted the report. All authors contributed to the review of the report and approved the final version for submission. OB is the guarantor of this work and, as such, had full access to all the data in the study and takes responsibility for the integrity of the data and the accuracy of the data analysis. All authors read and approved the final manuscript.
Funding
DIACART study was funded by the French Ministry of Health grant (PHRC Code projet: P111105; N° ID RCB: 2013‑A00896‑39). This study was supported by a fund from the Lilly Company. The company was neither involved in the design of the study nor in data collection. The research activities of C.E. Aubert were supported by a doctoral research scholarship from the University of Lausanne. The authors have no relevant conflicts of interest to disclose.
Availability of data and materials
Data are available on request from the corresponding author.
Ethics approval and consent to participate
The study was approved by the local ethics committee (PARIS VI CPP) and registered in ClinicalTrials.gov (Identifier: NCT02431234). All patients were informed about the study objectives and procedure. Participants gave their written informed consent to participation prior to inclusion.
Consent for publication
Not applicable.
Competing interests
No conflict of interest in the area of this study. DIACART study was supported by a fund from the Lilly Company. The company was neither involved in the design of the study nor in data collection.
Author details
1 Sorbonne Université, Paris, France. 2 Assistance Publique‑Hôpitaux de Paris (APHP), Diabetology Department, La Pitié Salpêtrière‑Charles Foix University Hospital, Paris, France. 3 Unité de Recherche Clinique Salpêtrière ‑ Charles Foix, AP‑HP, Hôpitaux Universitaires Pitié Salpêtrière ‑ Charles Foix, 75013 Paris, France. 4 Department of Pharmacology and CIC‑1421, AP‑HP La Pitié Salpêtrière Charles Foix University Hospital, Paris, France. 5 INSERM, CIC‑1901, Paris, France. 6 Institute of Cardiometabolism and Nutrition ICAN, Paris, France. 7 Laboratoire d’Imagerie Biomédicale INSERM_1146, CNRS_7371, Paris, France. 8 Assistance Publique‑Hôpitaux de Paris (APHP), Department of Radiology, La Pitié Salpêtrière‑Charles Foix University Hospital, Paris, France. 9 Division of Nephrology, Ambroise Paré Hospital, AP‑HP, Université Paris‑Saclay, Paris, France. 10 INSERM_1088, Centre Universitaire de Recherche en Santé, Université de Picardie Jules Verne, Amiens, France. 11 Department of Metabolic Biochemistry, La Pitié Salpêtrière‑Charles Foix University Hospital (AP‑HP), Paris, France. 12 UTCBS, CNRS UMR8258 – INSERM_1267, Faculty of Pharmacy of Paris, University of Paris, Paris, France. 13 University of Reims‑ Champagne‑Ardenne, CNRS, MEDyC UMR 7369, Reims, France. 14 Laboratory of Biochemisry‑Pharmacology‑Toxicology, University Hospital of Reims, Maison Blanche Hospital, Reims, France. 15 Cardiovascular Research Institute CARIM, Maastricht University, Maastricht, The Netherlands. 16 Department of Endo‑ crine and Oncologic Biochemistry, AP‑HP, Pitié‑Salpêtrière Hospital, Paris, France. 17 INSERM U1166, Paris, France. 18 INSERM, UMR_S 1138, Centre de Recherche des Cordeliers, Paris 06, France. 19 Département de Santé, Centre de Pharmacoépidémiologie (Cephepi), CIC‑1421, Sorbonne Université, INSERM, Institut Pierre Louis d’Epidémiologie et de Santé Publique, AP‑HP, Hôpitaux Universitaires Pitié Salpêtrière‑Charles Foix, 75013 Paris, France. 20 Sorbonne University, ACTION Study Group, INSERM, UMRS 1166, Institut de Cardiologie, Hôpital Pitié‑Salpêtrière (AP‑HP), Paris, France. 21 Diabetology Department, Pitié‑Salpêtrière Hospital, 47‑83 Boulevard de l’Hôpital, Paris, France. Received: 17 May 2020 Accepted: 12 September 2020
References
1. Johnson RC, Leopold JA, Loscalzo J. Vascular calcification: pathobiological mechanisms and clinical implications. Circ Res. 2006;99:1044–59. 2. Toussaint ND, Kerr PG. Vascular calcification and arterial stiffness in
chronic kidney disease: implications and management. Nephrology. 2007;12:500–9.
3. Stabley JN, Towler DA. Arterial calcification in diabetes mellitus: preclinical models and translational implications. Arterioscler Thromb Vasc Biol. 2017;37:205–17.
4. Bourron O, Aubert CE, Liabeuf S, Cluzel P, Lajat‑Kiss F, Dadon M, Komajda M, Mentaverri R, Brazier M, Pierucci A, et al. Below‑knee arterial calcifica‑ tion in type 2 diabetes: association with receptor activator of nuclear factor kappaB ligand, osteoprotegerin, and neuropathy. J Clin Endocrinol Metab. 2014;99:4250–8.
5. Everhart JE, Pettitt DJ, Knowler WC, Rose FA, Bennett PH. Medial arterial calcification and its association with mortality and complications of diabetes. Diabetologia. 1988;31:16–23.
6. Guzman RJ, Brinkley DM, Schumacher PM, Donahue RM, Beavers H, Qin X. Tibial artery calcification as a marker of amputation risk in patients with peripheral arterial disease. J Am Coll Cardiol. 2008;51:1967–74.
7. Alessandrino G, Chevalier B, Lefevre T, Sanguineti F, Garot P, Unterseeh T, Hovasse T, Morice MC, Louvard Y. A clinical and angiographic scoring system to predict the probability of successful first‑attempt percutaneous coronary intervention in patients with total chronic coronary occlusion. JACC Cardiovasc Interv. 2015;8:1540–8.
8. Mattesini A, Di Mario C. Calcium: a predictor of interventional treat‑ ment failure across all fields of cardiovascular medicine. Int J Cardiol. 2017;231:97–8.
9. Evrard S, Delanaye P, Kamel S, Cristol JP, Cavalier E. Vascular calcification: from pathophysiology to biomarkers. Clin Chim Acta. 2015;438:401–14. 10. Mary A, Hartemann A, Brazier M, Aubert CE, Kemel S, Salem JE, Cluzel P, Liabeuf S, Massy Z, Mentaverri R, et al. Higher parathyroid hormone levels are associated with increased below‑the‑knee arterial calcification in type 2 diabetes. Diabetes Metab. 2018;44:305–8.
11. Harper E, Forde H, Davenport C, Rochfort KD, Smith D, Cummins PM. Vascular calcification in type‑2 diabetes and cardiovascular disease: inte‑ grative roles for OPG, RANKL and TRAIL. Vascul Pharmacol. 2016;82:30–40. 12. Ndip A, Williams A, Jude EB, Serracino‑Inglott F, Richardson S, Smyth JV,
Boulton AJ, Alexander MY. The RANKL/RANK/OPG signaling pathway mediates medial arterial calcification in diabetic Charcot neuroarthropa‑ thy. Diabetes. 2011;60:2187–96.
13. Aubert CE, Liabeuf S, Amouyal C, Kemel S, Lajat‑Kiss F, Lacorte JM, Hal‑ bron M, Carlier A, Salem JE, Funck‑Brentano C, et al. Serum concentration and vascular expression of adiponectin are differentially associated with the diabetic calcifying peripheral arteriopathy. Diabetol Metab Syndr. 2019;11:32.
14. Rattazzi M, Bertacco E, Puato M, Faggin E, Pauletto P. Hypertension and vascular calcification: a vicious cycle? J Hypertens. 2012;30:1885–93. 15. Liabeuf S, Bourron O, Vemeer C, Theuwissen E, Magdeleyns E, Aubert CE,
Brazier M, Mentaverri R, Hartemann A, Massy ZA. Vascular calcification in patients with type 2 diabetes: the involvement of matrix Gla protein. Cardiovasc Diabetol. 2014;13:85.
16. Abbott CA, Carrington AL, Ashe H, Bath S, Every LC, Griffiths J, Hann AW, Hussein A, Jackson N, Johnson KE, et al. The North‑West Diabetes Foot Care Study: incidence of, and risk factors for, new diabetic foot ulceration in a community‑based patient cohort. Diabet Med. 2002;19:377–84. 17. Schurgers LJ, Teunissen KJ, Knapen MH, Kwaijtaal M, van Diest R, Appels
A, Reutelingsperger CP, Cleutjens JP, Vermeer C. Novel conformation‑ specific antibodies against matrix gamma‑carboxyglutamic acid (Gla) protein: undercarboxylated matrix Gla protein as marker for vascular calcification. Arterioscler Thromb Vasc Biol. 2005;25:1629–33. 18. Cranenburg EC, Koos R, Schurgers LJ, Magdeleyns EJ, Schoonbrood TH,
Landewe RB, Brandenburg VM, Bekers O, Vermeer C. Characterisation and potential diagnostic value of circulating matrix Gla protein (MGP) species. Thromb Haemost. 2010;104:811–22.
19. Cranenburg EC, Vermeer C, Koos R, Boumans ML, Hackeng TM, Bouwman FG, Kwaijtaal M, Brandenburg VM, Ketteler M, Schurgers LJ. The circulating inactive form of matrix Gla Protein (ucMGP) as a biomarker for cardiovas‑ cular calcification. J Vasc Res. 2008;45:427–36.
20. Mahmoudi R, Jaisson S, Badr S, Jaidi Y, Bertholon LA, Novella JL, Gillery P. Post‑translational modification‑derived products are associated with frailty status in elderly subjects. Clin Chem Lab Med. 2019;57:1153–61. 21. Bourron O, Le Bouc Y, Berard L, Kotti S, Brunel N, Ritz B, Leclercq F,
Tabone X, Drouet E, Mulak G, et al. Impact of age‑adjusted insulin‑like growth factor 1 on major cardiovascular events after acute myocardial infarction: results from the fast‑MI registry. J Clin Endocrinol Metab. 2015;100:1879–86.
22. Guerrero‑Romero F, Simental‑Mendia LE, Gonzalez‑Ortiz M, Martinez‑ Abundis E, Ramos‑Zavala MG, Hernandez‑Gonzalez SO, Jacques‑Cama‑ rena O, Rodriguez‑Moran M. The product of triglycerides and glucose, a simple measure of insulin sensitivity. Comparison with the euglycemic‑ hyperinsulinemic clamp. J Clin Endocrinol Metab. 2010;95:3347–51. 23. Agatston AS, Janowitz WR, Hildner FJ, Zusmer NR, Viamonte M Jr, Detrano
R. Quantification of coronary artery calcium using ultrafast computed tomography. J Am Coll Cardiol. 1990;15:827–32.
24. Baud’huin M, Lamoureux F, Duplomb L, Redini F, Heymann D. RANKL, RANK, osteoprotegerin: key partners of osteoimmunology and vascular diseases. Cell Mol Life Sci. 2007;64:2334–50.
25. Panizo S, Cardus A, Encinas M, Parisi E, Valcheva P, Lopez‑Ongil S, Coll B, Fernandez E, Valdivielso JM. RANKL increases vascular smooth muscle cell calcification through a RANK‑BMP4‑dependent pathway. Circ Res. 2009;104:1041–8.
26. Schneider F, Saulnier PJ, Gand E, Desvergnes M, Lefort N, Thorin E, Thorin‑ Trescases N, Mohammedi K, Ragot S, Ricco JB, et al. Influence of micro‑ and macro‑vascular disease and Tumor Necrosis Factor Receptor 1 on the level of lower‑extremity amputation in patients with type 2 diabetes. Cardiovasc Diabetol. 2018;17:81.
27. Gaudio A, Privitera F, Pulvirenti I, Canzonieri E, Rapisarda R, Fiore CE. Relationships between osteoprotegerin, receptor activator of the nuclear
factor kB ligand serum levels and carotid intima‑media thickness in patients with type 2 diabetes mellitus. Panminerva Med. 2014;56:221–5. 28. Callegari A, Coons ML, Ricks JL, Rosenfeld ME, Scatena M. Increased calci‑
fication in osteoprotegerin‑deficient smooth muscle cells: dependence on receptor activator of NF‑kappaB ligand and interleukin 6. J Vasc Res. 2014;51:118–31.
29. Higgins CL, Isbilir S, Basto P, Chen IY, Vaduganathan M, Vaduganathan P, Reardon MJ, Lawrie G, Peterson L, Morrisett JD. Distribution of alkaline phosphatase, osteopontin, RANK ligand and osteoprotegerin in calcified human carotid atheroma. Protein J. 2015;34:315–28.
30. Mohammadpour AH, Shamsara J, Nazemi S, Ghadirzadeh S, Shahsavand S, Ramezani M. Evaluation of RANKL/OPG serum concentration ratio as a new biomarker for coronary artery calcification: a pilot study. Thrombosis. 2012;2012:306263.
31. Biscetti F, Bonadia N, Santini F, Angelini F, Nardella E, Pitocco D, San‑ toliquido A, Filipponi M, Landolfi R, Flex A. Sortilin levels are associated with peripheral arterial disease in type 2 diabetic subjects. Cardiovasc Diabetol. 2019;18:5.
32. Qamar A, Khetarpal SA, Khera AV, Qasim A, Rader DJ, Reilly MP. Plasma apolipoprotein C‑III levels, triglycerides, and coronary artery calcification in type 2 diabetics. Arterioscler Thromb Vasc Biol. 2015;35:1880–8. 33. Bjornstad P, Maahs DM, Wadwa RP, Pyle L, Rewers M, Eckel RH, Snell‑
Bergeon JK. Plasma triglycerides predict incident albuminuria and progression of coronary artery calcification in adults with type 1 diabetes: the coronary artery calcification in type 1 diabetes study. J Clin Lipidol. 2014;8:576–83.
34. Kageyama A, Matsui H, Ohta M, Sambuichi K, Kawano H, Notsu T, Imada K, Yokoyama T, Kurabayashi M. Palmitic acid induces osteoblastic differen‑ tiation in vascular smooth muscle cells through ACSL3 and NF‑kappaB, novel targets of eicosapentaenoic acid. PLoS ONE. 2013;8:e68197. 35. Liao L, Zhou Q, Song Y, Wu W, Yu H, Wang S, Chen Y, Ye M, Lu L. Ceramide
mediates Ox‑LDL‑induced human vascular smooth muscle cell calcifica‑ tion via p38 mitogen‑activated protein kinase signaling. PLoS ONE. 2013;8:e82379.
36. Biscetti F, Nardella E, Bonadia N, Angelini F, Pitocco D, Santoliquido A, Filipponi M, Landolfi R, Flex A. Association between plasma omentin‑1 levels in type 2 diabetic patients and peripheral artery disease. Cardiovasc Diabetol. 2019;18:74.
37. Bone HG, Wagman RB, Brandi ML, Brown JP, Chapurlat R, Cummings SR, Czerwinski E, Fahrleitner‑Pammer A, Kendler DL, Lippuner K, et al. 10 years of denosumab treatment in postmenopausal women with osteoporosis: results from the phase 3 randomised FREEDOM trial and open‑label extension. Lancet Diabetes Endocrinol. 2017;5:513–23. 38. Helas S, Goettsch C, Schoppet M, Zeitz U, Hempel U, Morawietz H,
Kostenuik PJ, Erben RG, Hofbauer LC. Inhibition of receptor activator of NF‑kappaB ligand by denosumab attenuates vascular calcium deposition in mice. Am J Pathol. 2009;175:473–8.
39. Iseri K, Watanabe M, Yoshikawa H, Mitsui H, Endo T, Yamamoto Y, Iyoda M, Ryu K, Inaba T, Shibata T. Effects of Denosumab and Alendronate on Bone Health and Vascular Function in Hemodialysis Patients: a Randomized, Controlled Trial. J Bone Miner Res. 2019;34:1014–24.
40. Saremi A, Bahn G, Reaven PD. Progression of vascular calcification is increased with statin use in the Veterans Affairs Diabetes Trial (VADT). Diabetes Care. 2012;35:2390–2.
41. Konijn LCD, van Overhagen H, Takx RAP, de Jong PA, Veger HTC, Mali W. CT calcification patterns of peripheral arteries in patients without known peripheral arterial disease. Eur J Radiol. 2020;128:108973.
Publisher’s Note
Springer Nature remains neutral with regard to jurisdictional claims in pub‑ lished maps and institutional affiliations.