Publisher’s version / Version de l'éditeur:
Vous avez des questions? Nous pouvons vous aider. Pour communiquer directement avec un auteur, consultez la
première page de la revue dans laquelle son article a été publié afin de trouver ses coordonnées. Si vous n’arrivez pas à les repérer, communiquez avec nous à PublicationsArchive-ArchivesPublications@nrc-cnrc.gc.ca.
Questions? Contact the NRC Publications Archive team at
PublicationsArchive-ArchivesPublications@nrc-cnrc.gc.ca. If you wish to email the authors directly, please see the first page of the publication for their contact information.
https://publications-cnrc.canada.ca/fra/droits
L’accès à ce site Web et l’utilisation de son contenu sont assujettis aux conditions présentées dans le site LISEZ CES CONDITIONS ATTENTIVEMENT AVANT D’UTILISER CE SITE WEB.
Building Research Note, 1982-01
READ THESE TERMS AND CONDITIONS CAREFULLY BEFORE USING THIS WEBSITE. https://nrc-publications.canada.ca/eng/copyright
NRC Publications Archive Record / Notice des Archives des publications du CNRC :
https://nrc-publications.canada.ca/eng/view/object/?id=28a16a3b-ed3d-4bad-bb4d-f57482a09403 https://publications-cnrc.canada.ca/fra/voir/objet/?id=28a16a3b-ed3d-4bad-bb4d-f57482a09403
NRC Publications Archive
Archives des publications du CNRC
This publication could be one of several versions: author’s original, accepted manuscript or the publisher’s version. / La version de cette publication peut être l’une des suivantes : la version prépublication de l’auteur, la version acceptée du manuscrit ou la version de l’éditeur.
For the publisher’s version, please access the DOI link below./ Pour consulter la version de l’éditeur, utilisez le lien DOI ci-dessous.
https://doi.org/10.4224/40000533
Access and use of this website and the material on it are subject to the Terms and Conditions set forth at
Recorded energy consumption data on office buildings
RECORDED ENERGY CONSUMPTION
DATA ON OFFICE
BUILDINGSA.H. Elmahdy
The Standing Committee on Energy Conservation in Buildings is
a ttemp tirrg, o n b e h a l f of the National Research Council Associate
CornmiLtee on the National B u i l d i n g Code, Lo d e f i n e appropriate energy consmp tion targets f o r dif f *rent classes of b u i l d i n g s . ahese a r e p a r t l y based on t h e actual. energy consumption of existing buildings. Annual energy consumption d a t a o n groups 0 5 o f f ice b u i l d i n g s are
provided in t h i s r e p o r t t o demonstrate the pattern of energy consumption
f o r t h i s c l a s s of building. Table 1 g i v e s a summary of the sample s i z e , the average, maximum and m i n i m u m floor areas, and t h e annual energy consumption for each group of office b u i l d i n g s .
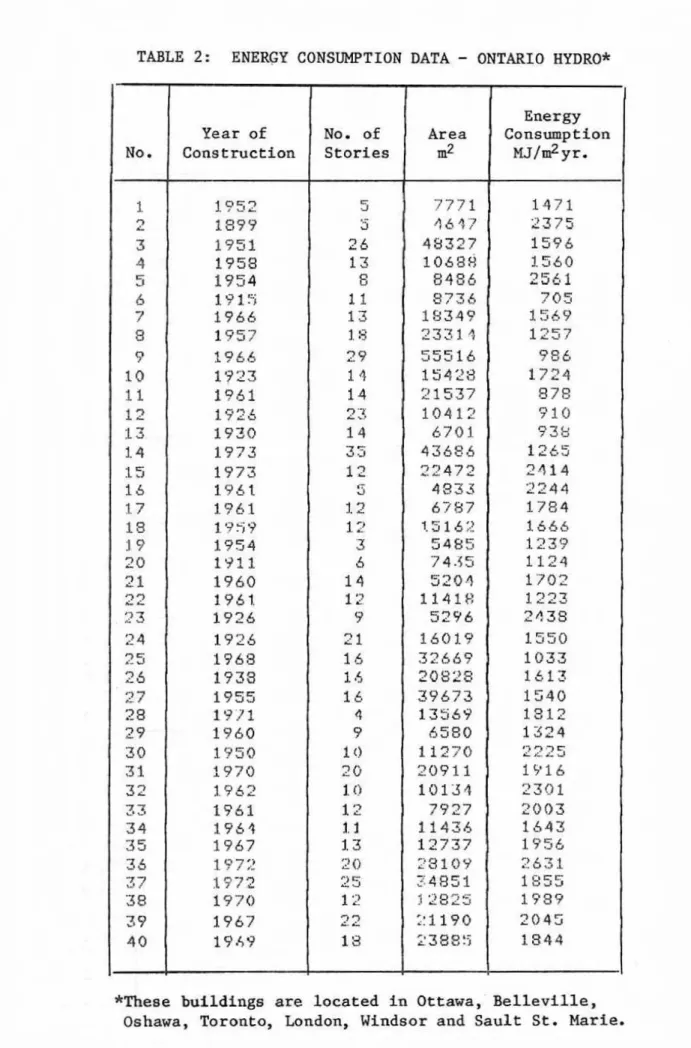
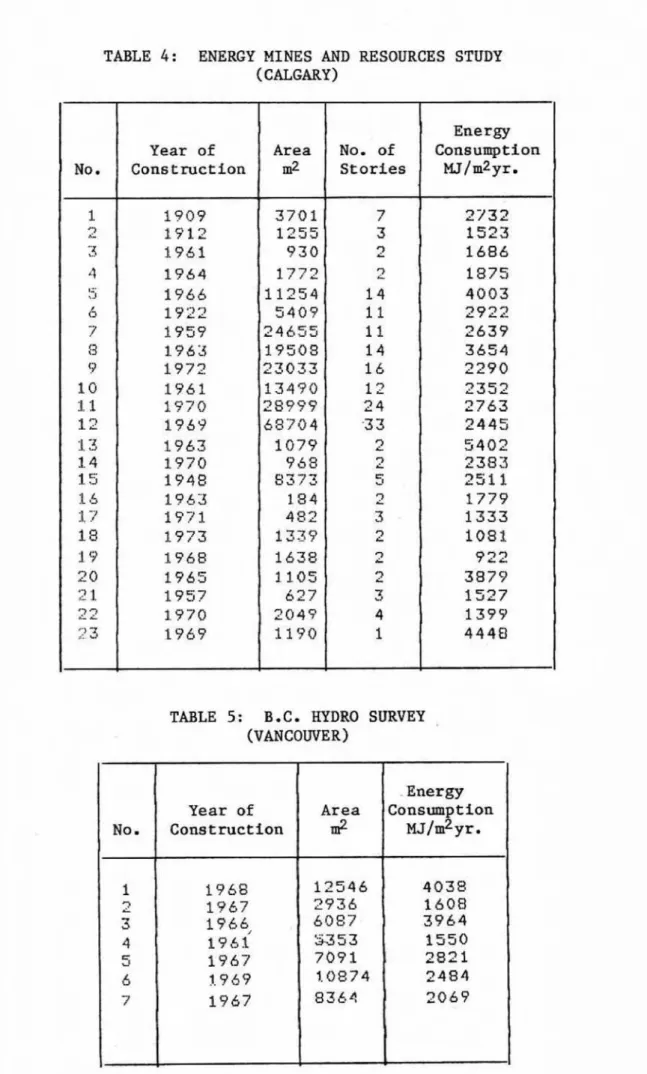
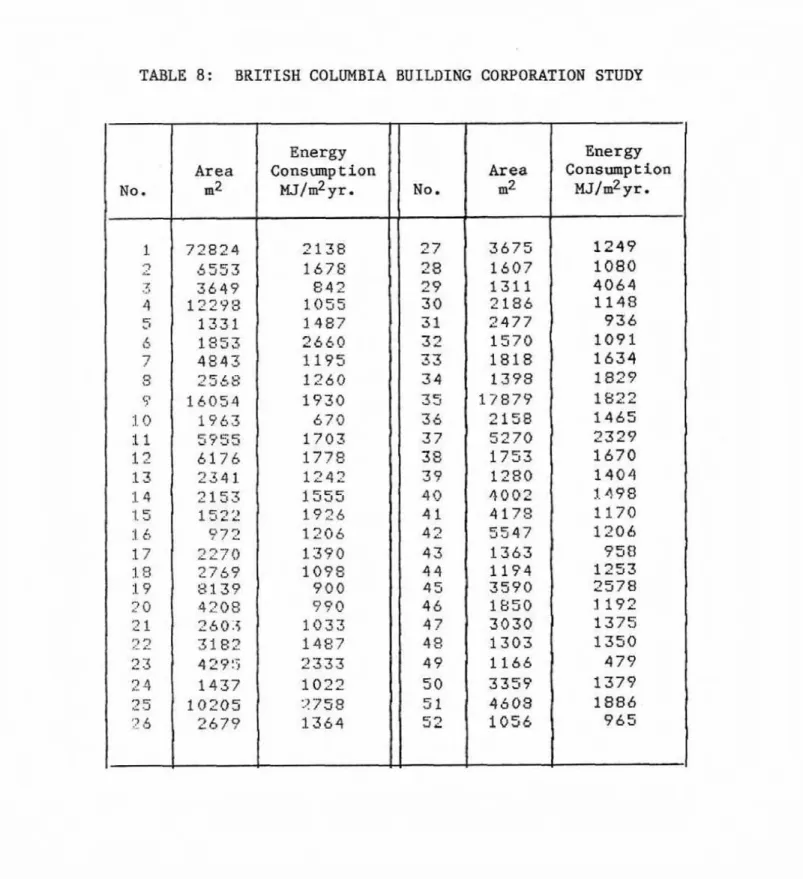
Complete listings of energy consumption and other relevant information are presented in T a b l e s 2 through 8. Although n o attempt has been made to correlate energy consumption d a t a with other v a r i a b l e s ,
p l o t s of energy consump t i o n i n ~ 3 / m ~ ~ r . versus building f l o o r area are
shown in Figures 1 through 4. The right-hand side ordinate on these figures shows the frequency of occurrence kn the corresponding energy consumption bins lEsted on the left-hand sTde. Figure 1 shows the
variation af a n n u a l energy consumption according to f l o o r area f o r a b o u t
80 o f f i c e b u i l d i n g s , as surveyed by Ontario H y d r o in
1974.
A sample of 39 of these o f f i c e buildings was resurveyed i n1977,
A s shown in Table 3, these was a reduction in the annual energy consumption for 1977 compared t o t h a t f o r
1974
for some of the b u i l d i n g s in the O n t a r i o Hydra Study. T h i s reduction is shown in Figure 2 f o r changes greater than or equal t o 0.3 G J / & ~ ~ .No
explanation given asto
the cause of t h i s d e c l i n e . However, it could be c r e d i t e d to one or more of the following factors:1. weather changes;
2. occupancy and vacancy p a t t e r n s ;
3 . implementation of energy conservation programs.
ACKNOWLEDGEMENT
The author wishes to acknowledge the contribution of the
f o l l m i n g organizations, who p r o v i d e d the data included in this report.
a) O n t a r i o Hydro
) Conservation and Renewable Energy Resources, M i n i s t r y of Energy,
Mines and Resources c) British Columbia Hydro
d ) Ontario Ministry of Government Services
e ) Hanitoba Public Works
f) British Columbia Building Corporation
The author a l s o w i s h e s to thank R.W. Slntzel for his assistance in preparing t h e graphs and t a b l e s .
bat2
k M w a a P I
6 6 6 W W W
TABLE
2
: ENERGYCONSUMPTION DATA
-
ONTARIO HYDRO*
*These buildings are located in Ottawa, B e l l e v i l l e , Oshawa, Toronto, London, Windsor and Sault St. Marie.
TABLE
2 (cont'd): ENERGY CONSUMPTION DATA-
ONTARIO
HYDRO**These buildings
are
locatedin
Ottawa, Belleville, Oshawa, Toronto, London, Windsor and Sault St. Marie.TABLE 3 :
ONTARIO
HYDRO RESURVEY(1)
The sequence number I n this t a b l e curresponds wlth thatfn
Table 2.
TABLE
4:
ENERGY MIMS ANDRESOURCES STUDY
(CALGARY)
TABLE 5 r B .C. HYDRO SURVEY
TABLE
6:ONTARIO
MINISTRY OF
GOVERNMENT SERVICES SURVEYC
TORONTO)TABLE 7:
MANITOBA
PUBLICWORKS
STUDYFIGURE 1 ONTAR
I0
HYDRO QFFl CE BU I LO l NGS 1974F1 GURE 2 ONTAR l O
HYDRO
1974-1977Selected bundings showing a
change i n onergy c o n s u ~ t i o n 2 g r e a t e r than 0.3 GJJrnyr. , - 0
-
al 0o
r
a L L-
3 0 0 1 0 '+-
0 )r 18 w 9-
tTa
50Lk
- 7 6 - 5-
i X NE
4 - \ 3 C3 c 3 - 0.-
4E
2 - C 0 0 1-
0 s w4 ShwLES+
w??
SAMPLES, , - , TBf4 TOTAL SAMPLE MEAN
--
-
t87f TOTAL S A M E MEANArea
m2
loJ
0 0 0 0 0 0 no 0 m 0 0 a 8 n o a m a MEAN O 0 0 m 0 ,,,---b'----
'--"4------
0_---
---
B o o a d 010 am 0 o a 0 :ffoo 0 0 a 0 S e 0 a , 0 0 m I I r I I I I 0 10 20 30 40 50 60 70 80 IFIGURE 3 ENERGY M l NES AND RESOURCES STUDY (CALGARY)
A r e a
m2
FIGURE 4 HR l TI SH COLUMB


