HAL Id: tel-01529771
https://tel.archives-ouvertes.fr/tel-01529771
Submitted on 31 May 2017HAL is a multi-disciplinary open access archive for the deposit and dissemination of sci-entific research documents, whether they are pub-lished or not. The documents may come from teaching and research institutions in France or
L’archive ouverte pluridisciplinaire HAL, est destinée au dépôt et à la diffusion de documents scientifiques de niveau recherche, publiés ou non, émanant des établissements d’enseignement et de recherche français ou étrangers, des laboratoires
3D tongue motion visualization based on the B-mode
ultrasound tongue images
Kele Xu
To cite this version:
Kele Xu. 3D tongue motion visualization based on the B-mode ultrasound tongue images. Computer Aided Engineering. Université Pierre et Marie Curie - Paris VI, 2016. English. �NNT : 2016PA066498�. �tel-01529771�
THÈSE DE DOCTORAT DE
l’UNIVERSITÉ PIERRE ET MARIE CURIE
Spécialité
Électronique
École Doctorale Informatique, Télécommunications et Électronique (Paris)
Présentée par
Kele Xu
Pour obtenir le grade de
DOCTEUR de l’UNIVERSITÉ PIERRE ET MARIE CURIE
Sujet de la thèse :
Visualisation tridimensionnelle de la langue basée sur des
séquences d'image échographique en mode-B
soutenue le 13 décembre 2016 devant le jury composé de :
M. Bruce Denby Directeur de thèse M. Pierre Badin Rapporteur M. James Scobbie Rapporteur M. Mohamed Chetouani Examinateur Mme. Sylvie Le Hégarat Examinateur
Acknowledgements
I would like to express my gratitude to my supervisor, Prof. Bruce Denby, whose expertise, patience and understanding, added considerably to my experience of study during the whole thesis. I appreciate his vast knowledge and skills in many areas, as the topic of this thesis is highly interdisciplinary. I appreciate all of his contributions of time and effort to make my thesis possible.
Very special thanks go out to Prof. Gérard Dreyfus and Pierre Roussel, without whose support and help in my daily life, I would not have completed my thesis. I would like to thank the members of our group: Aurore Jaumard-Hakoun, Clémence Leboullenger, for the friendships between us, as well as the good collaborations. I must also acknowledge Prof. Maureen Stone from University of Maryland Dental School and Prof. Yin Yang from University of New Mexico, who helped a lot for my thesis.
I would like to thank the China Scholarship Council (CSC), the ESPCI-ParisTech and Université Pierre et Marie Curie for their financial support for my thesis.
For this thesis, I would like to acknowledge the members of the jury, Prof. Pierre Badin, Prof. James Scobbie, Prof. Mohamed Chetouani, and Prof. Sylvie Le Hégarat, for their time, help and constructive suggestions.
Lastly, I would also like to thanks my parents, three sisters and my wife for the support through my life.
Abstract
A silent speech interface (SSI) is a system to enable speech communication with non-audible signal, that employs sensors to capture non-acoustic features for speech recognition and synthesis. Extracting robust articulatory features from such signals, however, remains a challenge. As the tongue is a major component of the vocal tract, and the most important articulator during speech production, a realistic simulation of tongue motion in 3D can provide a direct, effective visual representation of speech production. This representation could in turn be used to improve the performance of speech recognition of an SSI, or serve as a tool for speech production research and the study of articulation disorders.
In this thesis, we explore a novel 3D tongue visualization framework, which combines the 2D ultrasound imaging and 3D physics-based modeling technique. Firstly, different approaches are employed to follow the motion of the tongue in the ultrasound image sequences, which can be divided into two main types of methods: speckle tracking and contour tracking. The methods to track speckles include deformation registration, optical-flow, and local invariant features-based method. Moreover, an image-based tracking re-initialization method is proposed to improve the robustness of speckle tracking.
Compared to speckle tracking, the extraction of the contour of the tongue surface from ultrasound images exhibits superior performance and robustness. In this thesis, a novel contour-tracking algorithm is presented for ultrasound tongue image sequences, which can follow the motion of tongue contours over long durations with good robustness. To cope with missing segments caused by noise, or by the tongue midsagittal surface being parallel to the direction of ultrasound wave propagation, active contours with a contour-similarity constraint are introduced, which can be used to provide “prior” shape information. Experiments on synthetic data and on real 60 frame per second data from different subjects demonstrate that the proposed method gives good contour tracking for ultrasound image sequences even over durations of minutes, which can be useful in applications such as speech recognition where very long sequences must be analyzed in their entirety.
Using speckle tracking, the motion information can be extracted by following the speckles, which can be used to drive a generic 3D Finite Element Model (FEM) directly. Modal reduction and modal warping techniques are applied to model the deformation of the tongue physically and efficiently in 3D, which can handle with large deformation while retaining calculation efficiency. Nevertheless, the performance of speckle tracking was found to be somewhat unstable with comparison to contour tracking method in ultrasound tongue image sequences, which leads to unrealistic deformation of the 3D tongue model. Contour tracking can be more stable for the characterization of the motion of the tongue. However, obtaining the correspondence between contours of different frames is of great difficulty and registration between the 2D ultrasound image and 3D tongue model a major challenge. In this thesis, we show that these challenges can actually be converted into a “3D shape search” problem, based on which a more robust and realistic simulation is achieved. Compared to 2D images, such a 3D tongue motion visualization system can provide additional visual information and a quantitative description of the tongue’s 3D motion. This work can be helpful in a variety of fields, such as speech production, articulation training, speech disorder study, etc.
Résumé
Une interface vocale silencieuse (SSI) est un système permettant une communication vocale à partir d’un signal non audible. Un tel système emploie des capteurs qui enregistrent des données non-acoustiques, pour la reconnaissance et la synthèse vocales. Cependant, l’extraction des caractéristiques articulatoires robustes à partir de ces signaux reste un défi. La langue est une composante majeure de l'appareil vocal, et l'articulateur le plus important dans la production de parole. Une simulation réaliste du mouvement de la langue en 3D peut fournir une représentation visuelle directe et efficace de la production de parole. Cette représentation pourrait à son tour être utilisée pour améliorer les performances de reconnaissance vocale d'un SSI, ou servir d'outil dans le cadre de recherches sur la production de parole et de l'étude des troubles de l'articulation.
Dans cette thèse, nous explorons un nouveau cadre de visualisation en trois dimensions de la langue, qui combine l'imagerie échographique 2D et une technique de modélisation tridimensionnelle fondée sur la physique. Tout d'abord, différentes approches sont utilisées pour suivre le mouvement de la langue dans les séquences d'images échographiques, qui peuvent être regroupées en deux principaux types de méthodes : le suivi de la granularité et le suivi de contour. Les méthodes de suivi du chatoiement (speckle tracking) comprennent le recalage de déformations (deformation registration), le flux optique, et la méthode de transformation de caractéristiques visuelles invariante à l'échelle (Scale-invariant feature
transform, ou SIFT). En outre, une méthode de suivi réinitialisation basée sur l'image est
proposée afin d'améliorer la robustesse du suivi du chatoiement.
En comparaison avec le suivi de chatoiement, l'extraction du contour de la surface de la langue à partir d'images échographiques présente des performances supérieures et une meilleure robustesse. Dans cette thèse, un nouvel algorithme de suivi de contour est présenté pour des séquences d'images échographiques de la langue. Cet algorithme permet de suivre le mouvement des contours de la langue sur de longues durées avec une bonne robustesse. Pour résoudre la difficulté causée par les segments manquants dus au bruit ou celle causée par la surface mi-sagittale de la langue qui est parallèle à la direction de propagation de l'onde ultrasonore, nous proposons d’utiliser des contours actifs avec une contrainte de similitude de
contour, qui fournissent des informations a priori sur la forme de la langue. Des expériences sur des données synthétiques et sur des images réelles acquises sur différents sujets à la cadence de 60 images par seconde montrent que la méthode proposée donne un bon contour de suivi pour ultrasons des séquences d'images, même sur des durées de quelques minutes. Cette technique peut par conséquent être utile dans des applications telles que la reconnaissance vocale où de très longues séquences doivent être analysées dans leur intégralité.
Pour le suivi du chatoiement, l'information de mouvement peut être extraite en suivant des tavelures, qui peuvent être utilisées pour piloter un modèle 3D générique utilisant la méthode des éléments finis (Finite Element Model, ou FEM) directement. Des techniques de réduction et de déformation modales sont appliquées pour modéliser efficacement de manière physique la déformation de la langue en 3D, permettant de traiter avec une grande déformation tout en conservant l'efficacité de calcul. Néanmoins, les performances du speckle
tracking a été jugée plutôt instable par rapport à la méthode de suivi de contour dans des
séquences d’images échographiques de la langue, ce qui conduit à une déformation irréaliste du modèle 3D de la langue. Le suivi de contour peut être plus stable pour caractériser le mouvement de la langue. Cependant, l'obtention de la correspondance entre les contours des différentes images est d'une grande difficulté et trouver la correspondance entre l'image de l'échographie 2D et modèle de langue 3D est un défi majeur. Dans cette thèse, nous montrons que ces défis peuvent effectivement être convertis en un problème de "recherche de forme 3D", sur la base duquel une simulation plus robuste et réaliste est atteinte. Par rapport à des images 2D, un tel système de visualisation de mouvement 3D de la langue peut fournir des informations visuelles supplémentaires et une description quantitative du mouvement 3D de la langue. Ce travail peut être utile dans une variété de domaines, tels que l’étude de la production de la parole, l’orthophonie, l’étude des troubles de la parole, etc.
Table of Contents
Acknowledgements ... 3 Abstract ... 5 Résumé ... 7 Table of Contents ... 9 List of Figures ... 13 List of Tables ... 17 Abbreviation ... 19 Chapter 1 Introduction ... 211.1 Silent speech interface concepts ... 21
1.2 Related work ... 22
1.3 The thesis work ... 27
1.4 Structure of the thesis... 32
Chapter 2 Principles of ultrasound tongue imaging ... 35
2.1 Introduction ... 35
2.2 Basic principles of medical ultrasound imaging ... 36
2.2.1 Basic physics of medical ultrasound imaging ... 36
2.2.2 Ultrasound pulse ... 38
2.2.3 Ultrasound scan types ... 38
2.3.1 Ultrasound tissue interaction ... 41
2.3.2 Ultrasound tongue image distortions ... 43
2.3.3 Ultrasound tongue data acquisition ... 44
2.4 Conclusion ... 45
Chapter 3 Speckle tracking in ultrasound tongue images ... 47
3.1 Introduction ... 47
3.2 Speckle tracking in ultrasound tongue images ... 48
3.2.1 Fundamentals of speckle tracking ... 49
3.2.2 Deformation registration ... 50
3.2.3 Optical flow ... 55
3.2.4 Local invariant feature ... 57
3.2.5 Comparison between different speckle tracking methods in ultrasound tongue images ... 60
3.3 Similarity-based automatic speckle tracking re-initialization ... 62
3.3.1 Ultrasound image similarity measurement ... 63
3.3.2 Ultrasound image-based speckle tracking re-initialization ... 68
3.4 Conclusion ... 68
Chapter 4 Contour tracking in ultrasound tongue images ... 71
4.1 Introduction ... 71
4.2 Active contour model with Contour group-similarity constraint ... 72
4.2.1 Active contour model with contour group-similarity constraint ... 72
4.2.2 Automatic re-initialization during contour tracking ... 75
4.3 A comparative study on the different contour tracking algorithms ... 85
4.3.1 Comparison of contour tracking methods with re-initialization ... 85
4.3.2 Similarity-based contour extraction... 86
4.4 Conclusion ... 88
Chapter 5 Physics-based 3D tongue motion modeling ... 91
5.1 Introduction ... 91
5.2 Physics-based 3D tongue modeling ... 92
5.2.1 Theoretical foundations of motion-driven based 3D tongue modeling ... 92
5.2.2 Interface overview ... 94
5.3 Speckle tracking-based tongue motion simulation ... 95
5.3.1 Speckle tracking-based tongue motion visualization ... 95
5.3.2 Experimental results ... 97
5.4 Contour-guided 3D tongue motion visualization ... 99
5.4.1 Contour-based 3D tongue motion visualization ... 99
5.4.2 Experimental results ... 102 5.5 Conclusion ... 104 Chapter 6 Conclusions ... 107 6.1 Conclusions ... 107 6.2 Perspectives... 109 Publications ... 111 References ... 115
List of Figures
Figure 1-1 Ultrasound-based SSI (schematic). ... 22
Figure 1-2 Different imaging techniques used to visualize the vocal tract... 23
Figure 1-3 New potential ultrasound-based SSI framework... 28
Figure 1-4 Framework of the whole thesis. ... 29
Figure 1-5 The tetrahedral mesh used for the simulation, and smoothed generic tongue mesh consists of 12,967 nodes and 43,930 elements. ... 29
Figure 2-1 Framework of medical ultrasound imaging system. ... 37
Figure 2-2 Exemplar ultrasound processing pipeline for RF signal to B-mode image conversion. ... 40
Figure 2-3 Ultrasound-tongue imaging. ... 42
Figure 2-4 A particular segment of tongue results in a specific spatial distribution of gray values, the speckle pattern, in the ultrasound tongue images, which can be used as the acoustic marker of the tongue tissue. ... 43
Figure 2-5 Multi-sensor Hyper-Helmet: (1) Adjustable headband. (2) Probe height adjustment strut. (3) Adjustable US probe platform. (4) Lip camera with proximity and orientation adjustment. ... 45
Figure 3-1 Deformation registration of ultrasound tongue images. ... 53
Figure 3-2 Deformation registration-based virtual land markers tracking in ultrasound tongue images. ... 54
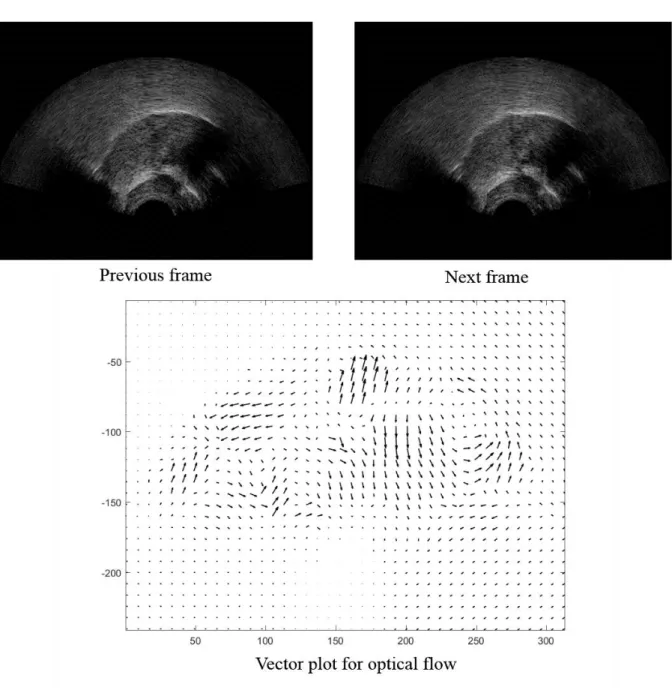
Figure 3-3 Application of optical-flow in ultrasound tongue images. ... 56
Figure 3-4 Describe the keypoints by using the feature vector. ... 58
Figure 3-6 Application of SIFT flow on the ultrasound tongue images. ... 59 Figure 3-7 The MSD error of different speckle tracking methods. ... 61 Figure 3-8 Two frames used to calculate the similarity index, the size of the frame is 320× 240. (c) is the difference between Frame 1 and Frame 46. (a) Frame number: 1; (b) Frame number: 46; (c) Frame 46 - Frame 1 (colormap). ... 63
Figure 3-9 A quantitative comparison experiment was conducted on different similarity indexes using the synthetic image (the unit for the rotation is degree). ... 66
Figure 3-10 Comparison between different similarity indices on different situations using real ultrasound tongue images. ... 66
Figure 3-11 CW-SSIM index of the entire image in an ultrasound image sequence of five utterances of phoneme /k/. Three different levels of decomposition M are shown. ... 67
Figure 3-12 MSD error of speckle tracking methods with automatic re-initialization. ... 68 Figure 4-1 Evaluation of contour tracking on synthetic data. (a) Validation on the synthetic data, each row represents the image sequences and the red line represents the contour extracted from the image. The red line in the top row shows the contour extracted without similarity constraint while the one in the bottom row is the one with similarity constraint. In our experiment, m = 6 and n = 24 (see discussion in text). (b) Validation on the ultrasound tongue data. The red line in the left column shows the contour extracted without similarity constraint while the one in the right column is the one with similarity constraint. . 75
Figure 4-2 Example of automatic re-initialization in the contour tracking. As the CW-SSIM index between the first frame and the Frame 93 exceeds the threshold, the contour is re-initialized to the original position in the first frame. (The CW-SSIM index between Frame1 and frame 92 is 0.79). ... 76
Figure 4-3 The comparison between the contour-extracted with contour similarity constraint (red line in second column) and without contour similarity constraint (yellow line in third column). As the number of frames is small, image-similarity-based re-initialization was not necessary here. ... 78
Figure 4-4 The results (Female 2) of contour tracking in the sequences of long duration (green lines are the contour tracked in each frame, while the blue points represent the points
to represent the curve). To keep the original result, no contour extrapolation is made. ... 79
Figure 4-5 Examples for poor tracking (Female 2). ... 80
Figure 4-6 Some examples of results for Female 1 ... 82
Figure 4-7 Some examples of results for Male 1. ... 82
Figure 4-8 Some examples of results for Male 2. ... 83
Figure 4-9 Some examples of results for Male 3. ... 84
Figure 4-10 Sample frames from the image dictionary. The yellow curves represent the contours labeled manually. ... 87
Figure 4-11 The frame in (a) is the frame pending processing, while the two frames in (b) and (c) give the most similar hand-labeled frames selected from the database by using CW-SSIM index. The yellow lines are the contour label manually. The similarity index between (a) and (b) is 0.9569, while the similarity index between (a) and (c) is 0.9636. ... 87
Figure 4-12 Errors by using different methods MSD Errors across (pixels, 1 pixel = 0.295 mm) ... 88
Figure 5-1 A snapshot of the user interface of the platform being developed. ... 94
Figure 5-2 Generic tongue model with anchor (yellow) and mid-sagittal constraint nodes (green), for driving the model, are shown in the rest configuration. Anchor nodes’ displacements are zero during the motion of the tongue model. ... 96
Figure 5-3 Vocal tract ultrasound scan: (1) the “shadow” of Hyoid bone; (2) upper tongue surface; (3) tendon; (4) tongue surface; (5) central groove. ... 96
Figure 5-4 Some examples of the visualization results. ... 97
Figure 5-5 Volume change of the tongue model. ... 98 Figure 5-6 Elements used for the 3D visualization. (a) The 3D model used in our framework, the green circles denote the constraint nodes, whose displacements are associated with the modal displacement. The yellow nodes are anchor nodes whose displacements are
zero during the deformation of the tongue model. (b) Target curve extracted from the image, the green lines are the surface of the tongue. ... 99
Figure 5-7 Sample frames in the 3D tongue shape dataset. ... 100 Figure 5-8 Sample frames of 3D tongue modeling. The ultrasound images are given in the left column. The meaning of the color line and points is the same as Fig. 1. The 3D tongue shapes are given in the right column, which are selected from the 3D tongue database based on the method proposed in section 4... 103
Figure 5-9 Validation for the proposed method for 3D tongue modeling. The left column gives the 3D tongue model, while the right column gives the ultrasound tongue image with tongue extracted (the green lines denote the contour extracted). The midsagittal planes of the 3D tongue model are placed over the ultrasound tongue images in transparency. ... 104
List of Tables
Table 1-1 Summary of contour extraction methods in ultrasound tongue images ... 24 Table 1-2 Related literatures of 3D vocal tract modeling ... 26 Table 4-1 Errors by using different methods for different subjects (For Female 2,400 contours were extracted manually, for Male 2, 1000 contours were extracted manually, while 2000 contours were extracted manually for Male 3.) The standard deviation is also given in this table. ... 81
Table 4-2 A comparison between with and without automatic re-initialization method (1 pixel = 0.295 mm) ... 86
Abbreviation
SSI Silent Speech Interface MRI Magnetic Resonance Imaging EMA Electromagnetic Articulography SNR Signal-to-Noise Ratio
FEM Finite Element Model FPS Frame Per Second
SSIM Structural Similarity Metric
CW-SSIM Complex Wavelet Structural Similarity Metric RF Radio Frequency
SONAR Sound Navigation and Ranging PSF Point Spread Function
STE Speckle Tracking Echocardiography SAD Sum of Absolute Differences
MAD Minimum Absolute Differences SSD Sum of Squared Differences
NCC Normalized Correlation Coefficient ML Maximum Likelihood
PDF Probability Density Function MSE Mean Square Error
PSNR Peak Signal-to-Noise Ratio
SIFT Scale-Invariant Feature Transform SIFT Flow Scale-Invariant Feature Transform flow
Chapter 1
Introduction
1.1 Silent speech interface concepts
Speech is the vocalized form for human-to-human communication, which is the most common and useful interface for human daily communication. Unfortunately, traditional natural speech interfaces present several problems:
Speech is one-to-many modality, which can give rise to problems of users’ interference and communication security;
If there is a high level of background noise, the quality of speech communication degrades rapidly;
The speech modality may be impossible when a speaker is incapacitated by illness or injury, either temporarily (laryngitis, flu, etc.) or permanently (cancer, laryngectomy, pulmonary insufficiency, accident, etc.);
Speech communication may be impossible when the parties involved do not share a common language.
All of these difficulties arise from the propagation nature of the acoustic speech signal. The situation is similar with Automatic Speech Recognition (ASR) for machines, although this technique has suffered considerable evolution in last decades. When the audio signal is corrupted by environmental noise, the speech recognition performance degrades rapidly, which makes the communication unfeasible.
Were it feasible, however, to capture an exploitable speech signal at the production stage, before an audible speech is produced, or indeed suppress completely the audible speech signal by interdicting the use of the vocal chords, which could overcome the abovementioned difficulties. Such a system is referred to as a silent speech interface (SSI) [1], which enables
speech communication with non-audible signals (Figure 1.1 gives the framework of the ultrasound and optical imaging-based SSI [2]), that employs sensors to capture non-acoustic features for speech recognition. As the SSIs system can capture the signals before the speech production, they have the potential to be background noise insensitive, natural sounding.
Although the performance of SSI system is not stable yet, the potential applications of SSI seem evident in several different domains, just to name a few, telecommunication, medical fields, speech production (acoustic-articulatory inversion), et al. Over the past several years, such a SSI concept had gained more public acceptance, and more and more imaging techniques have been employed for the silent speech recognition problem. Indeed, the feasibility of SSIs for practical communication began to be shown.
Figure 1-1 Ultrasound-based SSI (schematic).
1.2 Related work
To some sense, the SSIs are the speech recognition systems based on the analysis of the non-acoustical signal recorded during speech production. Thus, understanding and modeling the procedure that produces speech is essential to advance speech production science, which may also be helpful to improve the performance of SSI. Indeed, speech production has been studied over several decades using a variety of different types of sensors. During speech production, the tongue is the most important component of the vocal tract [3] for forming
robustly, the SSI systems’ recognition performance may be further improved. However, measuring tongue’s motion directly is difficult since the tongue lies within the oral cavity and is inaccessible to most instruments. Various imaging techniques have been used to analyze the movement indirectly, including Magnetic Resonance Imaging (MRI) [4] (as shown in Figure 1-2 (a), accessed from [5]), X-ray [6] (as shown in Figure 1-2 (b)), ultrasound [3] (as shown in Figure 1-2 (c)) and electromagnetic mid-sagittal articulography (EMA) [7] (as shown in Figure 1-2 (d), accessed from [8]).
Figure 1-2 Different imaging techniques used to visualize the vocal tract.
X-ray imaging has better temporal resolution, but exposes subjects to radiation and is a through-transmission technique, which projects the entire 3D head onto a single 2D image. MRI system captures tongue movement with good resolution (as can be seen in Figure 1-2
(b)), but requires summation of repetitions to get good spatiotemporal resolution. MRI images are recorded in supine position, which is atypical for speech. EMA data can provide directly motion information by measuring the motion trajectory of the tongue, however, its invasive property makes it difficult for natural speech production recording. Ultrasound is another widely used tool in the speech production research. Nevertheless, the Signal-to-Noise Ratio (SNR) of the ultrasound image is quite low, and the speckle noise degrades the images by concealing fine structures and reduces the signal to noise level. The strength of ultrasound imaging is that it images tongue motion at a fairly rapid frame rate (60Hz), which can capture subtle and swift movement during speech production. Furthermore, ultrasound imaging is noninvasive, less expensive than other imaging systems, and convenient for experimentation. In this thesis, due to its appealing properties, we employ the ultrasound to capture the motion information of tongue. To recover the continuous motion of the tongue, robust tracking approach is in high demand for ultrasound-based SSI system.
Tracking the tongue in an ultrasound image sequence is a challenging task due to the poor image quality and fast, irregular motion. Many literatures aimed to solve aforementioned problems. The classical approach to quantify the motion of the tongue is to extract the upper surface of the contour in the ultrasound image sequences. A non-exhaustive literature summary (Table 1-1) is conducted on the contour tracking approaches in ultrasound tongue images. As can be seen from the table, a variety of processing techniques can be used to track the contours of the tongue in the ultrasound images, for example, active contour models (also called as “Snake” model) [9], [10]; active appearance models (AAM) [11]; machine leaning-based tracking [12], [13], [14]; ultrasound image segmentation-leaning-based approaches. Most of the algorithms were applied to a static frame.
Table 1-1 Summary of contour extraction methods in ultrasound tongue images
Authors Title Methods
Yusuf Sinan Akgul, Chandra Kambhamettu, and Maureen Stone [9]. (1999)
Automatic extraction and tracking of
the tongue contours. Active contour model Li Min, Chandra Kambhamettu,
and Maureen Stone [10]. (2005) Automatic contour tracking in ultrasound images. Active contour model Anastasios Roussos,
Athanassios Katsamanis, and Petros Maragos [11]. (2009)
Tongue tracking in ultrasound images with active appearance models.
Active appearance model
Ian Fasel and Jeffrey Berry [12].
(2010) Deep belief networks for real-time extraction of tongue contours form ultrasound during speech.
Ghassan Hamarneh [15]. (2012) ultrasound via high-order MRFs and
efficient fusion moves. segmentation-based Diandra Fabre, Thomas Hueber,
Florent Bocquelet, and Pierre Badin [13]. (2015)
Tongue Tracking in Ultrasound Images using EigenTongue Decomposition and Artificial Neural Networks.
Machine-learning based method
Aurore Jaumard-Hakoun, Kele Xu, Gerard Dreyfus, Pierre Roussel, Maureen Stone and Bruce Denby [14]. (2015)
Tongue contour extraction from ultrasound images based on deep neural network.
Machine-learning based method
Since the revolution of the neural networks [16], machine-learning based contour tracking method has made great progress. However, the training depends on the large number of hand-labeled frames, which are not easy to obtain. Due to their ability to be guided by constraint forces, active contours may be particularly useful for contour tracking in images of the tongue. Indeed, tongue contour tracking using energy-minimization-based active contours, or “Snake”, has been used extensively in previous research. In the contour tracking algorithm proposed in [9], the snake model was used on ultrasound tongue images for the first time, introducing gradient information in the definition of an external energy term. By including an intensity-related constraint, [10] proposed a new contour tracking system, named EdgeTrak, which works very well for sequences in which the entire contour always remains visible. If a part of the contour disappears in some images, however, due to poor acoustic coupling or a decrease in reflected energy, the obtained contour can become erroneous and require manual re-initialization to get back on track. This can become problematic for applications where long speech sequences are to be analyzed.
To help cope with low SNR in ultrasound images, some researchers have proposed to use other imaging modalities (e.g., X-rays) to obtain prior tongue shape information [11]. However, these modalities may use different frame rates, and registration between different modalities can also be difficult, making such an approach impractical (the use of X-ray is also nowadays banned). Thus, the contour tracking problem still poses a challenge in ultrasound tongue image sequences.
For a very long time, tongue motion analysis has been essentially limited to the midsagittal plane, but progress of the 3D imaging system (e.g. 3D MRI imaging system and 3D ultrasound imaging system) and the progress of the 3D computer simulation in anatomical and physiological field, have brought into this domain led to the point where dynamic 3D visualization of tongue motion has been unavoidable. 3D tongue modeling based on
finite-element-modeling (FEM) became more and more popular in the research field of speech production. Compared to the 2D image sequences, the effective 3D visualizing motion of the human tongue can provide extra visual information. A summary on the related literature of 3D vocal tract modeling are given in the table below.
Table 1-2 Related literature of 3D vocal tract modeling
Authors Title
Maureen Stone [17]. (1990) A three-dimensional model of tongue movement based on ultrasound and x-ray microbeam data.
Reiner Wilhelms‐Tricarico [18]. (1995) Physiological modeling of speech production: Methods for modeling soft‐ tissue articulators.
Olov Engwall [19]. (1999) Vocal tract modeling in 3D.
Olov Engwall [20]. (2000) A 3D tongue model based on MRI data. Olov Engwall [21]. (2001) Using linguopalatal contact patterns to tune a
3d tongue model.
Olov Engwall [22]. (2003) Combining MRI, EMA and EPG measurements in a three-dimensional tongue model.
Ian Stavness, John E. Lloyd, Sidney Fels [23].
(2012) Automatic prediction of tongue muscle activations using a finite element model. John E. Lloyd, Ian Stavness, Sidney Fels [24].
(2012) ArtiSynth: A fast interactive biomechanical modeling toolkit combining multi-body and finite element simulation.
Yin Yang, Xiaohu Guo, Jennell Vick, Luis
G.Torres, Thomas Campell [25]. (2013) Physical-based visualization. deformable tongue
In brief, previous efforts made 3D tongue modeling focus on three categories: static tongue modeling using geometry data-driven method ( [17], [18], [19], [20], [21] and [22]), dynamic tongue modeling using muscle activation approach ( [23], [24]), and motion-driven 3D tongue modeling [25]. In more detail, static tongue modeling aims to recover the 3D tongue shape using multi-slice using different imaging techniques, the slice come from both the midsagittal plane and the coronal plane. For dynamic tongue modeling, researchers aim to model the tongue’s motion by simulating the stimulus of muscle, which can be used to drive the 3D tongue model in a dynamic manner. But, the tongue is complicated to model due to its large global and local deformation and intrinsic muscular activation. However, the treatment of muscle activation in the tongue still presents a number of challenges, despite many attempts to characterize the bio-mechanical properties of the tongue. Indeed, our understanding of human tongue bio-mechanical property is still very limited. Motion-driven
widely used for computer animation. Rather than muscle-driven 3D tongue modeling, motion-derived 3D modeling is used in our framework, as an alternate type of dynamic tongue modeling. This kind of inverse dynamics-based [25] approach can govern the deformation of the tongue model by using the motion information as position constraints, then forward dynamics by using the prescribed target motion trajectory.
As our goal is to recover the continuous motion of the tongue, the static modeling method may not be applicable in our case. Moreover, as the tongue’s movement is swift, the 3D dynamic tongue model should generate different gestures in a short time-step. Thus, muscle-driven based approach may be also unsuitable for our work.
1.3 The thesis work
Based on the summary of previous work on contour tracking and 3D tongue modeling, we can see that 3D tongue modeling using ultrasound image sequences is a great challenge even through sustainable efforts have been made. However, if we can model the motion of the tongue quantitatively in 3D, extra information may be obtained to help improve the performance of the ultrasound-based silent speech interface.
Indeed, up until now, ultrasound-based silent speech interfaces have remained experimental due to the difficulties in rendering the sensor data independent of experimental conditions. Ultrasound images are noisy and difficult to interpret even under the best of conditions, and are highly dependent on exact sensor placement. Moreover, the ultrasound imaging quality varies between subjects, the woman’s imaging quality is usually better than male subject is, the younger subject is always better than the elder [3]. Speaker-independent recognition (or multi-speakers’ recognition) poses a greater challenge, and how to extract the robust and distinctive feature is of importance for the success of the SSI recognition system. On the other hand, devising a stable sensor acquisition platform is an extremely challenging task, as is indeed the inverse procedure of trying to correct for sensing problems using real-time post-processing.
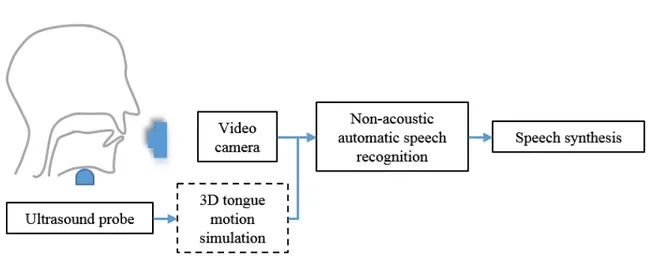
This can be accomplished by making use of non-acoustic sensing of the articulator movement to create an acoustic vocal tract model (the component in the rectangle with the dotted line in Figure 1-3), and driving the model in software with an artificial vocalization
signal. The breakthrough required in order to make this type of instrumentation viable for silent speech/song production modalities will consist of devising imaging processing techniques capable of accurately and reliably measuring articulator movement in real time in a series of standard video and ultrasound images of the vocal tract. This will require, for example, bringing image processing algorithms on the difficult problems of noise, occlusion, acoustic contact ambient lighting conditions, etc., and also incorporating a priori anatomical knowledge about the articulators via 3D finite element physical models of these organs. Thus the thesis topic, the development of an active real-time model of the vocal tract, sits at the crossroads of the data acquisition, image processing, feature extraction, 3D modeling and human anatomy.
Figure 1-3 New potential ultrasound-based SSI framework.
In this thesis, we propose a novel 3D tongue visualization framework based on ultrasound image sequences of the tongue, which combines the 2D motion information extraction from ultrasound imaging system and dynamic 3D physics-based modeling strategy. And it can be useful for speech production research and the enhancement of silent speech recognition. The framework of the thesis work is given in Figure 1-4.
Figure 1-4 Framework of the whole thesis.
As can be seen from the Figure 1-4, the materials used throughout this thesis include ultrasound tongue image sequences and a generic 3D tongue Finite Element Model (FEM), which is extracted from Artisynth [24]. The original tongue model consists of 1,803 nodes and 8,606 tetrahedral elements. In this thesis, to create more smooth mesh and obtain a better visualization result, we subdivide the original generic tongue mesh, which consists of 12,967 nodes and 43,930 tetrahedral elements. (as shown in Figure 1-5).
Figure 1-5 The tetrahedral mesh used for the simulation, and smoothed generic tongue mesh consists of 12,967 nodes and 43,930 elements.
In the early period of the thesis, we aims to track the continuous motion of the tongue using ultrasound with high robustness for long duration. The attempt is twofold: speckle tracking and contour tracking:
Speckle tracking: Speckle tracking methods aim to track the backscattered echoes
produced by ultrasound scatters in the tissue of the tongue. The principle of speckle tracking is quite simple: two-dimensional speckle is defined as the spatial distribution of gray values in the ultrasound image, which is commonly referred as the speckle pattern. If the position within the segment of tongue tissue changes, it can assume that the position of its acoustic fingerprint (texture) will change accordingly. By tracking these patterns, we can follow the motions of tissue in real-time. In this thesis, we analyze the fundamental principles of speckle tracking. Then, different speckle tracking techniques have been implemented and tested on the ultrasound tongue sequences. Moreover, the complex wavelet structural similarity-based automatic speckle tracking re-initialization is also presented in this thesis. However, the performance of the speckle tracking was found to be somewhat unstable.
Contour tracking: Compared to speckle tracking, the extraction of the contour of the
tongue surface from ultrasound images exhibits superior performance and robustness. The goal of contour tracking is to track the surface of tongue in the ultrasound image. However, accurate, robust tongue contour extraction, remains a challenging problem for ultrasound sequences of long duration, due to acoustic effects, speckle noise and poor signal-to-noise-ratio (SNR). Despite significant research efforts, manual refinement is usually needed, which is impractical for large-data tracking systems. Thus, in this thesis, a novel automatic contour tracking algorithm had been developed, wherein active contour model with contour group similarity constraint is used. Experiments on synthetic data and on real 60 frame per second (FPS) data from different subjects demonstrate that the proposed method gives good contour tracking for ultrasound image sequences even over durations of minutes, which can be useful in applications such as speech recognition where very long sequences must be analyzed in their entirety. Moreover, image-similarity-based contour tracking is also presented in this thesis, which achieves state-of-art performance with comparison to previous approaches.
In the later part of the thesis, we aim to employ the motion information extracted by using speckle tracking or contour tracking to drive the 3D Finite-Element Model (FEM) to simulate the motion of the tongue. The 3D tongue modeling technique is based on the deformable modeling technique. In more detail, the 3D model can be driven by imposing extra positional constraints at specified finite element nodes to enforce their displacements to some user-specified values.
Speckle tracking-based modeling: For speckle tracking, to drive the 3D tongue model,
the modal displacement will be calculated by using the movement of the patterns directly, which will be transmitted to certain nodes of on the midsagittal tongue model surface in order to drive the 3D model at the acquisition rate of ultrasound image sequence. However, as mentioned above, the performance of speckle tracking is not robust yet, which make this kind of method unfeasible for practical application.
Contour tracking-based modeling: Using contour tracking to drive the 3D tongue
model is the alternative method. However, due to the change of the contour tracking quality, the length of the contour extracted changes dramatically between adjacent frames, which makes it difficult to obtain the correspondence between contours of different frames. Thus, the registration between the 2D ultrasound image and 3D tongue model poses a great challenge. In the thesis work, we show that these challenges can actually be converted into a “3D shape search” problem, and the deformation simulated with the “3D shape search” framework is informative and qualitatively realistic compared with speckle tracking-based animation.
Overall, the main contributions of our work can be summarized as:
1. Based on the framework of [25], which make use of EMA data to drive the 3D tongue model, a physics-based deformable tongue visualization framework is presented using the finite-element-method (FEM) driven by ultrasound image sequences. Compared to the 2D image sequences, this technique can deliver much enriched visual information and can be used for several different speech tasks. Compared to EMA-based motion visualization, extra visualization can be obtained.
2. To overcome the problem of faint contour and against the signal-level noise, the similarity constraint is added to the active contour model. Moreover, complex wavelet structural similarity (CW-SSIM) measurement technique is used to reset contour tracking automatically, which can improve the robustness of the contour tracking algorithm. 3. By employing the image similarity-based constraint, a novel contour tracking method is
proposed in the work of the thesis, which achieves state-of-art performance. On the other hand, a comparative study is conducted on the different contour tracking algorithms with automatic re-initialization.
4. Different motion tracking-based 3D tongue modeling methods are explored. By using the contour extracted from the ultrasound tongue image sequence, a novel shape
similarity-based 3D tongue dynamic modeling technique is proposed, similarity-based on which a more realistic motion simulation is implemented.
Moreover, although our original target is to design a platform to visualize the 3D tongue motion using the ultrasound data, this platform can also be extended to other imaging modals (e.g. MRI, EMA, X-Ray) to assist the studies on speech production.
1.4 Structure of the thesis
The organization of this thesis is given below, which is mainly based on our attempts to dynamic model the tongue motion in 3D using the ultrasound image sequences.
In detail, in this chapter, after an initial introduction to the rich variety of SSI applications, the ultrasound-based SSI problem is discussed specifically. Then a non-exhaustive literature review is conducted on both the contour tracking in ultrasound tongue image sequences and 3D tongue modeling technique. Then the thesis work is summarized, highlighting the contributions and improvements with comparison to previous solutions.
Chapter 2 describes the fundamentals of B-model ultrasound tongue imaging, including the basic principles of B-mode ultrasound imaging, as well as the ultrasound-tongue tissue interaction, which laid the foundation of speckle tracking and contour tracking in ultrasound tongue image sequences.
Chapter 3 presents the application of speckle tracking techniques in ultrasound tongue image sequences. Firstly, the fundamental principles of speckle tracking are given. Then, the practical implementations of speckle tracking techniques are discussed. Moreover, an image-similarity-based automatic speckle tracking re-initialization method is proposed in this chapter.
In chapter 4, the contour tracking approaches are investigated for ultrasound tongue image sequences. One of the methods is based on the modified active contour model, with the aim to cope with missing segments caused by noise, or by the tongue midsagittal surface being parallel to the direction of ultrasound wave propagation. Also, the image-similarity based automatic contour tracking re- initialization method is discussed in this chapter.
In chapter 5, the summary of the physical-based deformation modeling algorithm adopted in our framework is presented. Speckle tracking and contour tracking based 3D dynamic modeling of the tongue is given in this chapter. The experimental results and analyses are presented.
The last chapter concludes the thesis, outlining the lessons drawn from our study, its limitations, and proposing directions for future research.
Chapter 2
Principles of ultrasound tongue imaging
2.1 Introduction
Compared to other medical imaging modalities (such as MRI, X-ray or EMA), the ultrasound imaging system is portable, non-invasive and relatively inexpensive. Over the last decades, the ultrasound imaging has drawn widespread acceptance and witnessed continuous development in the diagnosis and more complex arrangements designed to have been be used to enhance the imaging performance [26]. The primitive display modes for ultrasound, such as A-mode, and static B-mode have given way to real-time, high-resolution and ultra-fast imaging [27]. Moreover, some new ultrasound systems can visualize the internal structures in three dimensions. In essence, the basic principles of ultrasound imaging are still used in the modern medical ultrasound systems. In this chapter, we begin with the basic principles of ultrasound imaging, including the physics basis and principles of ultrasound imaging, which laid the foundations for ultrasound tongue imaging.
Ultrasound imaging has been used to image the human tongue for over three decades by phoneticians, predominately in a clinical context [17]. In the early stage, the ultrasound equipment was found in the hospitals, which made them difficult to be accessible for the speech production researchers. However, with the improvements in technology and reduced cost, the ultrasound is increasingly used as an imaging tool for the researchers in clinical linguists and phonetics fields [3], [28], [29]. Continuous efforts have been made to understand the motor control during speech production, and the ultrasound-based tongue motion analysis has witnessed great progress in last decades.
The classical method for tongue motion analysis aims to extract the contours of the upper tongue surface using ultrasound imaging. Another potential feasible approach in deriving correspondence is speckle-tracking method. All the motion-tracking approaches are based
upon the characterization between the ultrasound waves and the tongue tissue. Thus, in the second part of this chapter, the interaction of the tongue muscle and the ultrasonic waves is analyzed, laying the foundation for speckle tracking and contour tracking, which are the main topics for the next two chapters.
In more detail, the organization of this chapter is given as follows: firstly, in Section 2.2, the basic principles of the ultrasound B-mode imaging are presented, which include the basic physics of the medical ultrasound imaging, a brief introduction of the ultrasound pulse and a general preview of different ultrasound scan types. Section 2.3 discusses the interaction property between the tongue tissues and the ultrasound waves, and the data-acquisition platform is presented. While, in the last part of Section 2.3, the image distortions, which that may occur during the recording, are analyzed. In the end of this chapter, a conclusion is drawn.
2.2 Basic principles of medical ultrasound imaging
2.2.1 Basic physics of medical ultrasound imagingIn brief, ultrasound image imaging is based upon the echo-location principle. However, the connection between the medical ultrasound sound and the echo-location principle was not made until the mature of the underwater acoustics, which made use of SONAR (Sound Navigation and Ranging) to measure the depth of water at sea. The inventions of SONAR and medical ultrasound imaging can be traced to the sinking of Titanic [30] when scientists tried to detect icebergs underwater using echo ranging. Nevertheless, at that time, there were no practical ways to implement the ideas until the discovery of piezoelectricity. In 1916 and 1917, by making use of technologies of piezoelectricity, Paul Langevin and Constantin Chilowsky invented a high-power echo-ranging system to detect the submarines [31].
The recognition that ultrasound could benefit medical diagnoses can be traced to World War I. Afterward, ultrasound is progressively applied to the therapy and the surgery. In the 1970s, medical ultrasound witnessed a rapid expanding with the advent of 2D real-time systems. Color flow systems occurred in 1990s. Presently, active research field includes contrast agents, molecular imaging, tissue characterization, integration with other modalities,
Despite sustainable efforts been made, the basic principles of medical ultrasound imaging are almost the same today as they were several decades ago [33]. The basic medical ultrasound imaging system is shown in Figure 2-1.
Figure 2-1 Framework of medical ultrasound imaging system.
The pulse is generated from the ultrasound transducers (or probes), which contain multi-piezoelectric crystals. When an electric field is applied to an array of multi-piezoelectric crystal located on the surface of a transducer, mechanical vibration will happen in response. This phenomenon is called the piezoelectric effect, which was originally described by the brothers Pierre Curie and Jacques Curie [34]. The mechanical vibration will result in an ultrasound-high frequency wave, which will propagate through a medium by compression and rarefaction.
The pulse propagates into the body where it reflects off mechanical in the homogeneities regions. In more detail, like audible sound, the pulse will echo back from the interface between transmission mediums of different densities. Strong echoes mean large differences of densities, while weak echoes can occur at the tissues-to-tissues interfaces as they have similar density. Because the distance is the product between the velocity and the time, a
reflector at distance z from the transducer will cause a pulse echo at timet2z c, where c is the sound velocity in the body.
2.2.2 Ultrasound pulse
The ultrasound waves can be described by three terms: frequency, wavelength and amplitude. The frequency and wavelength are inversely related. Modern medical ultrasound devices use sound waves in a range of 1-20 MHz. The wavelength of medical ultrasound varies from 1.5 mm at 1 MHz to 0.15 mm at 10 MHz, which enables good depth resolution. The propagation velocity is dependent on the compressibility of the medium. The average velocity of sound in soft tissues is 1540 meters/second. Frequency selection for the transducer is of importance to obtain optimal resolution for ultrasound images. High-frequency waves can image with higher axial resolution, but are more attenuated than the low frequency waves. Low-frequency provides images of lower resolution but can penetrate deeper in the structures.
A pulse excites the transducer with a short pulse in a particular direction, and the ultrasound waves are generated in pulses, which consists of 2-3 sound cycles of the same frequency. The pulse is often modeled as an amplitude modulated sinusoid.
i top t a t e (2.1)
where 0 2 f0 is the carrier frequency, and a t
is the envelope.The emitted ultrasound pulse can be viewed as the impulse function of the ultrasound medical imaging system. Suppose the echo pulse is used to represent the output of the ultrasound system during interrogation of an ideal point target. The echo pulse can also be regarded as the ultrasound system’s point spread function (PSF), and received echo pulse can be considered as the impulse response of the biological medium. However, as the pulse travel along a straight path and it is quite short, the pulse is often referred as the ultrasound beam.
2.2.3 Ultrasound scan types
There are several different types of ultrasound scanning types, which include A-mode, B-mode, M-mode and some other formats. The display formats are often selected based on the
practical applications. In this part, we will give the preview of A-mode and B-mode scanning types.
A-mode imaging
The A-mode scan type is the simplest mode, which is the basic element for other ultrasound scans. A-mode transducer scans a line though the tissue, and displays the amplitude versus depth for the echo signal, which is used to measure the distance accurately. Echoes will be generated from the tissue interfaces or tissue-air interfaces.
Suppose at depths dddd1, ,, ,, ,, ,ddddnnnn there are interfaces with reflectivities R d
1
1 N n n n R d R d
d d
(2.2)The signal received by the transducer can be modeled as:
1 2 N n n n v t K R d p t d c
(2.3)where K is the constant gain factor relating to the impedances of the transducer, electronic pre-amplification. A natural estimate of the reflectivity is
ˆ 2
R d v d c (2.4)
where v t
is the envelope of the received signal. The estimated reflectivity can be plotted by using the amplitude versus time, which can be regarded as a function of depthd . Hence,this type of ultrasound imaging is called as A-mode imaging [35].
The aforementioned model is a highly simplified model. However, in practical application, when ultrasound wave travels through tissues with different acoustic impedance (the definition is given below), reflection will occur. The acoustic impedances are the measures of the response of the medium to a given acoustic pressure, which is determined by the density and stiffness of the medium. In the tissue, the acoustic impedance is defined as:
For air, as the density and stiffness are low, thus, z is very small. While, for bone, z is much higher, as it has quite high density and stiffness.
B-mode scan
The B-mode ultrasound image is produced by a transducer array, for example, a large number of small transducer elements are arranged in a straight line. B-mode scan can be viewed as a concatenation of A-mode scans. Normally, a complete B-model image is made up more than 100 lines.
The reflected ultrasonic waves are detected by the same transducer and converted into an electrical signal (Radio Frequency signal). Pulses that returned later are displayed in the image as far away from the transducer. The received echo pulse can be viewed as the impulse response of the medium. The raw RF data for ultrasound waves is not well suited for the interpretation by users. The exemplar ultrasound-processing pipeline for RF signal to B-mode conversion is given in Figure 2-2. Firstly, the envelope of the RF signal is detected and coded in a way given as follows: high-amplitude reflections are the bright pixels in an image and low-amplitude reflection is represented by dark. After frequency compounding, the envelope of RF signal is detected to represent the original signal. Afterwards, a nonlinear intensity map is applied to decrease the range of the data. In the end, several different filters specific are used to create a B-model image. In one sense, the B-mode ultrasound imaging was constructed from the echoes to form a cross-sectional image representing tissues and organ boundaries within the body [35]. The brightness of each pixel is related to the amplitude of the reflected pulse. Hence, this type of ultrasound imaging is called as B-mode imaging (Brightness-mode imaging).
Figure 2-2 Exemplar ultrasound processing pipeline for RF signal to B-mode image conversion.
The temporal resolution of B-mode ultrasound image ranges from 30 frame-per-second (FPS) to 80-90 FPS. Although, recently, there are some progress on ultrafast ultrasound imaging [27], the ultrasound machines typically collect up 30-60 FPS. To get a deeper scan, the ultrasound machine settings will employ slower imaging rates as longer time is needed to wait for the returning pulses.
2.3 Ultrasound-tongue tissue interaction
Since last several decades, B-mode ultrasound imaging has been employed to visualize the motion of the tongue with considerable success [29]. When the ultrasound waves travel through a medium, some effects may occur, which include attenuation, reflection, refraction and scattering. The interaction between the sound waves and the medium is determined by the acoustic properties of the medium and the ultrasound imaging system. In this section, firstly, we analyze the interaction between ultrasound and the tongue tissue. Then we present our data recording equipment used throughout this thesis.
2.3.1 Ultrasound tissue interaction
The quality of an ultrasound tongue image is of utmost importance in determining its usefulness. The overall quality of the ultrasound tongue image is the end product of a combination of many factors originating not only from the imaging system but also from the stability of the recording system and the performance of the operator. All of the components within the ultrasound tongue imaging system, including the transducer, image processing, display and recording devices, impact on the ultimate quality of the ultrasound tongue image. It is necessary to analyze the interaction between the ultrasound and tongue tissue, which can be helpful to make better use of ultrasound imaging.
When we are employing ultrasound to measure the motion of the tongue, the transducer typically is placed under the chin (as can be seen from the Figure 2-3). The ultrasound waves will transmit through the tongue body until it is reflected back.
Figure 2-3 Ultrasound-tongue imaging.
When ultrasonic waves travel through the tongue tissues, waves are partly transmitted to deeper structures, partly reflected back to the transducer as echoes, partly scattered, and partly transformed to heat.
Reflection: Reflection of the ultrasound waves occurs when the sound reaches tissue
boundaries (or tissue-air-interface) with different acoustic impedance. In the ultrasound tongue image, due to the difference of acoustic impedances between the air and the tissue, the brightest line in the B-mode ultrasound tongue image is the interface between the tongue surface and the air (as shown in Figure 2-3).
Scattering: In ultrasound tongue imaging, scattering refers to the interaction of
ultrasound wave with microstructures of the tongue, which are much smaller than the wavelength. When the ultrasound wavelength is greater than the structure in the tongue, it will create a uniform amplitude scattering in all directions, which gives rise to the speckle phenomenon in the ultrasound tongue images (as shown in Figure 2-4). In brief, the “speckle” is the specific spatial distribution pattern of gray values in a local region of ultrasound tongue image. The “speckle” is also referred to as a speckle pattern. As the speckle is originated from the RF signal, the “speckle” can also be used to define the amplitude distribution of the RF signal. To distinguish between them, in the rest of this thesis, the gray-value distribution
Attenuation: Different tongue tissues have different acoustical properties, which enhance
or decrease the propagation of the ultrasound waves. As the tongue contains considerable amounts of fat, refraction may occur and the returning echo is significantly attenuated.
Figure 2-4 A particular segment of tongue results in a specific spatial distribution of gray values, the speckle pattern, in the ultrasound tongue images, which can be used as the acoustic marker of the tongue tissue.
The imaging quality varies between different subjects: such as the image quality of female subject is better than the male subject, while the younger subjects are better than the older subjects [28]. On the other hand, it is worthwhile to note that: the tongue tip is not visible in most cases, which makes the characterization of the tongue’s motion more difficult.
2.3.2 Ultrasound tongue image distortions
Due to the sensitivity of the ultrasound imaging quality, there are several image distortions in ultrasound tongue images. In more detail, the distortions include speckle noise contamination, double edges, contour discontinuities, contour invisibility and inconsistent transducer placement and so on. Here, the focus is mainly on the influence of speckle and the contour invisibility.
Speckle noise: Due to the inherent contamination with the speckle noise, the analysis of
ultrasound tongue image poses a great challenge. Although there are more attempts to employ this kind of information to follow the motion, speckle noise processing is still an open issue in ultrasound image processing. Indeed, the speckle noise degrades the ultrasound tongue image, concealing the fine structures [36], which leads to the difficulties in the motion tracking of the tongue.
Hidden from the view (or faint contour): When the tongue tissue goes perpendicular to
the propagation direction of ultrasound waves, the quality of image is good. While, when the tongue tissue goes parallel to the propagation direction of ultrasound waves, the quality of the image is poorly and missing occurs. Take the /i/ as an example, due to the natural motion of the tongue, part of the tongue is invisible. This kind of invisibility increased the difficulties of ultrasound tongue interpretation.
2.3.3 Ultrasound tongue data acquisition
The ultrasound data acquisition devices used in this thesis belong to our SSI system’s data acquisition part, which is comprised of a helmet to hold the ultrasound probe to capture the movement of the tongue at the frame rate of 60 Hz, a VGA, CMOS industrial camera for the lips, a microphone to record acoustic speech signals, an electroglottograph (EGG) to measure and record vocal fold contact movement during speech production. All the different modes of data are recorded synchronously [37].
The lightweight, adjustable helmet (Figure 2-4) is fitted with a micro-convex, 1 inch diameter, 128 element ultrasound probe for tongue imaging [37]. An adjustable platform is used to hold the ultrasound transducer in contact with the skin beneath the chin. The ultrasound machine chosen is the Terason T3000, a system which is lightweight and portable yet retaining high image quality, and allowing data to be directly exported to a PC via Firewire. Our entire SSI system can be placed in a small carrying case, thus enabling everyday applications.
Figure 2-5 Multi-sensor Hyper-Helmet: (1) Adjustable headband. (2) Probe height adjustment strut. (3) Adjustable US probe platform. (4) Lip camera with proximity and orientation adjustment.
2.4 Conclusion
In this chapter, we briefly went through the basic principles of medical ultrasound imaging. Moreover, the ultrasound pulse is discussed, and the ultrasound scan types are presented. In the second part of this chapter, the interaction between ultrasound and tongue is discussed, which include reflection, scattering and attenuation in the ultrasound tongue image sequences. Also, the definition of speckle is given in this part, which is a quite important topic for the next chapter. Based on the interaction between the ultrasound and the tongue, we discussed some distortions in the ultrasound images, such as: contour invisibility, which is a major problem for different previous proposed contour tracking methods. In the end of this chapter, we presented the ultrasound data-recording platform used throughout this thesis.
Chapter 3
Speckle tracking in ultrasound tongue images
3.1 Introduction
In the speech production field, researchers have made sustainable efforts to improve the interpretation of the configurations of the articulators. As the tongue is one of the major components of the vocal tract, the quantification of the tongue’s motion is important to understand the change of articulators over time during the natural speech. As the main objective of this thesis is to model the 3D tongue motion in a dynamic manner, robust correspondences between continuous frames need to be established in the ultrasound tongue image sequences, which will be used to drive the 3D physics-based deformable model dynamically. However, compared to other imaging methods such as x-ray, electromagnetic articulography (EMA), the ultrasound imaging technique can provide limited information on the correspondences. Indeed, the nature of the tongue motion made it even harder to obtain correspondences due to several reasons: complex tongue shape, hidden from the view, high-level speckle noise contamination and out-of-plane motion.
To address the aforementioned difficulties, different approaches can be used in the ultrasound image sequences to obtain point correspondences, one of which is speckle tracking. Speckle tracking has been an active field in ultrasound imaging for the last several years [38]. Specifically, with the advance of ultrasound image quality and the calculation power of computer, the speckle tracking approach matures into practical research to follow the motion. In the cardiology field, speckle-tracking echocardiography (STE) [39] is used to characterize the motion of tissues in the heart, and the utilities of STE are increasing recognized. In the clinical setting, more and more evidence was shown that the assessment of the cardiac deformation by speckle tracking techniques can provide incremental information.